Free Statistics

of Irreproducible Research!

Author's title

Author*The author of this computation has been verified*
R Software Modulerwasp_multipleregression.wasp
Title produced by softwareMultiple Regression
Date of computationThu, 19 Nov 2009 09:02:01 -0700
Cite this page as followsStatistical Computations at FreeStatistics.org, Office for Research Development and Education, URL https://freestatistics.org/blog/index.php?v=date/2009/Nov/19/t1258646580qan6d53pb1ze9hz.htm/, Retrieved Fri, 19 Apr 2024 18:53:17 +0000
Statistical Computations at FreeStatistics.org, Office for Research Development and Education, URL https://freestatistics.org/blog/index.php?pk=57795, Retrieved Fri, 19 Apr 2024 18:53:17 +0000
QR Codes:

Original text written by user:
IsPrivate?No (this computation is public)
User-defined keywords
Estimated Impact129
Family? (F = Feedback message, R = changed R code, M = changed R Module, P = changed Parameters, D = changed Data)
-     [Multiple Regression] [Q1 The Seatbeltlaw] [2007-11-14 19:27:43] [8cd6641b921d30ebe00b648d1481bba0]
- RM D  [Multiple Regression] [Seatbelt] [2009-11-12 14:10:54] [b98453cac15ba1066b407e146608df68]
-    D      [Multiple Regression] [Multiple Regression] [2009-11-19 16:02:01] [d45d8d97b86162be82506c3c0ea6e4a6] [Current]
Feedback Forum

Post a new message
Dataseries X:
1.4	1.9	3	1.5	-0.7	-0.7	-2.9	-0.8	1
1	1.6	3.2	3	1.5	-0.7	-0.7	-2.9	-0.8
-0.8	0	3.1	3.2	3	1.5	-0.7	-0.7	-2.9
-2.9	-1.3	3.9	3.1	3.2	3	1.5	-0.7	-0.7
-0.7	-0.4	1	3.9	3.1	3.2	3	1.5	-0.7
-0.7	-0.3	1.3	1	3.9	3.1	3.2	3	1.5
1.5	1.4	0.8	1.3	1	3.9	3.1	3.2	3
3	2.6	1.2	0.8	1.3	1	3.9	3.1	3.2
3.2	2.8	2.9	1.2	0.8	1.3	1	3.9	3.1
3.1	2.6	3.9	2.9	1.2	0.8	1.3	1	3.9
3.9	3.4	4.5	3.9	2.9	1.2	0.8	1.3	1
1	1.7	4.5	4.5	3.9	2.9	1.2	0.8	1.3
1.3	1.2	3.3	4.5	4.5	3.9	2.9	1.2	0.8
0.8	0	2	3.3	4.5	4.5	3.9	2.9	1.2
1.2	0	1.5	2	3.3	4.5	4.5	3.9	2.9
2.9	1.6	1	1.5	2	3.3	4.5	4.5	3.9
3.9	2.5	2.1	1	1.5	2	3.3	4.5	4.5
4.5	3.2	3	2.1	1	1.5	2	3.3	4.5
4.5	3.4	4	3	2.1	1	1.5	2	3.3
3.3	2.3	5.1	4	3	2.1	1	1.5	2
2	1.9	4.5	5.1	4	3	2.1	1	1.5
1.5	1.7	4.2	4.5	5.1	4	3	2.1	1
1	1.9	3.3	4.2	4.5	5.1	4	3	2.1
2.1	3.3	2.7	3.3	4.2	4.5	5.1	4	3
3	3.8	1.8	2.7	3.3	4.2	4.5	5.1	4
4	4.4	1.4	1.8	2.7	3.3	4.2	4.5	5.1
5.1	4.5	0.5	1.4	1.8	2.7	3.3	4.2	4.5
4.5	3.5	-0.4	0.5	1.4	1.8	2.7	3.3	4.2
4.2	3	0.8	-0.4	0.5	1.4	1.8	2.7	3.3
3.3	2.8	0.7	0.8	-0.4	0.5	1.4	1.8	2.7
2.7	2.9	1.9	0.7	0.8	-0.4	0.5	1.4	1.8
1.8	2.6	2	1.9	0.7	0.8	-0.4	0.5	1.4
1.4	2.1	1.1	2	1.9	0.7	0.8	-0.4	0.5
0.5	1.5	0.9	1.1	2	1.9	0.7	0.8	-0.4
-0.4	1.1	0.4	0.9	1.1	2	1.9	0.7	0.8
0.8	1.5	0.7	0.4	0.9	1.1	2	1.9	0.7
0.7	1.7	2.1	0.7	0.4	0.9	1.1	2	1.9
1.9	2.3	2.8	2.1	0.7	0.4	0.9	1.1	2
2	2.3	3.9	2.8	2.1	0.7	0.4	0.9	1.1
1.1	1.9	3.5	3.9	2.8	2.1	0.7	0.4	0.9
0.9	2	2	3.5	3.9	2.8	2.1	0.7	0.4
0.4	1.6	2	2	3.5	3.9	2.8	2.1	0.7
0.7	1.2	1.5	2	2	3.5	3.9	2.8	2.1
2.1	1.9	2.5	1.5	2	2	3.5	3.9	2.8
2.8	2.1	3.1	2.5	1.5	2	2	3.5	3.9
3.9	2.4	2.7	3.1	2.5	1.5	2	2	3.5
3.5	2.9	2.8	2.7	3.1	2.5	1.5	2	2
2	2.5	2.5	2.8	2.7	3.1	2.5	1.5	2
2	2.3	3	2.5	2.8	2.7	3.1	2.5	1.5
1.5	2.5	3.2	3	2.5	2.8	2.7	3.1	2.5
2.5	2.6	2.8	3.2	3	2.5	2.8	2.7	3.1
3.1	2.4	2.4	2.8	3.2	3	2.5	2.8	2.7
2.7	2.5	2	2.4	2.8	3.2	3	2.5	2.8
2.8	2.1	1.8	2	2.4	2.8	3.2	3	2.5
2.5	2.2	1.1	1.8	2	2.4	2.8	3.2	3
3	2.7	-1.5	1.1	1.8	2	2.4	2.8	3.2
3.2	3	-3.7	-1.5	1.1	1.8	2	2.4	2.8


Summary of computational transaction
Raw Inputview raw input (R code)
Raw Outputview raw output of R engine
Computing time3 seconds
R Server'Gwilym Jenkins' @ 72.249.127.135

\begin{tabular}{lllllllll}
\hline
Summary of computational transaction \tabularnewline
Raw Input & view raw input (R code)  \tabularnewline
Raw Output & view raw output of R engine  \tabularnewline
Computing time & 3 seconds \tabularnewline
R Server & 'Gwilym Jenkins' @ 72.249.127.135 \tabularnewline
\hline
\end{tabular}
%Source: https://freestatistics.org/blog/index.php?pk=57795&T=0

[TABLE]
[ROW][C]Summary of computational transaction[/C][/ROW]
[ROW][C]Raw Input[/C][C]view raw input (R code) [/C][/ROW]
[ROW][C]Raw Output[/C][C]view raw output of R engine [/C][/ROW]
[ROW][C]Computing time[/C][C]3 seconds[/C][/ROW]
[ROW][C]R Server[/C][C]'Gwilym Jenkins' @ 72.249.127.135[/C][/ROW]
[/TABLE]
Source: https://freestatistics.org/blog/index.php?pk=57795&T=0

Globally Unique Identifier (entire table): ba.freestatistics.org/blog/index.php?pk=57795&T=0

As an alternative you can also use a QR Code:  

The GUIDs for individual cells are displayed in the table below:

Summary of computational transaction
Raw Inputview raw input (R code)
Raw Outputview raw output of R engine
Computing time3 seconds
R Server'Gwilym Jenkins' @ 72.249.127.135


Multiple Linear Regression - Estimated Regression Equation
bbp[t] = -0.568423714957236 + 0.703034602878663dnst[t] -0.162054421760413y1[t] + 0.24411627990024y2[t] + 0.266239270044661y3[t] -0.441380268244024y4[t] -0.171511342104913y5[t] + 0.249939654919237y6[t] + 0.470407740917486y7[t] + 0.0512513482374854M1[t] + 0.0693410526133588M2[t] + 0.490218937204835M3[t] + 0.43220779370504M4[t] + 0.694046045024337M5[t] + 0.506546659846355M6[t] + 0.45487878836219M7[t] + 0.334984425545786M8[t] + 0.315369054290805M9[t] + 0.468922783621777M10[t] + 0.459780509456216M11[t] -0.0053212905716026t + e[t]

\begin{tabular}{lllllllll}
\hline
Multiple Linear Regression - Estimated Regression Equation \tabularnewline
bbp[t] =  -0.568423714957236 +  0.703034602878663dnst[t] -0.162054421760413y1[t] +  0.24411627990024y2[t] +  0.266239270044661y3[t] -0.441380268244024y4[t] -0.171511342104913y5[t] +  0.249939654919237y6[t] +  0.470407740917486y7[t] +  0.0512513482374854M1[t] +  0.0693410526133588M2[t] +  0.490218937204835M3[t] +  0.43220779370504M4[t] +  0.694046045024337M5[t] +  0.506546659846355M6[t] +  0.45487878836219M7[t] +  0.334984425545786M8[t] +  0.315369054290805M9[t] +  0.468922783621777M10[t] +  0.459780509456216M11[t] -0.0053212905716026t  + e[t] \tabularnewline
\hline
\end{tabular}
%Source: https://freestatistics.org/blog/index.php?pk=57795&T=1

[TABLE]
[ROW][C]Multiple Linear Regression - Estimated Regression Equation[/C][/ROW]
[ROW][C]bbp[t] =  -0.568423714957236 +  0.703034602878663dnst[t] -0.162054421760413y1[t] +  0.24411627990024y2[t] +  0.266239270044661y3[t] -0.441380268244024y4[t] -0.171511342104913y5[t] +  0.249939654919237y6[t] +  0.470407740917486y7[t] +  0.0512513482374854M1[t] +  0.0693410526133588M2[t] +  0.490218937204835M3[t] +  0.43220779370504M4[t] +  0.694046045024337M5[t] +  0.506546659846355M6[t] +  0.45487878836219M7[t] +  0.334984425545786M8[t] +  0.315369054290805M9[t] +  0.468922783621777M10[t] +  0.459780509456216M11[t] -0.0053212905716026t  + e[t][/C][/ROW]
[/TABLE]
Source: https://freestatistics.org/blog/index.php?pk=57795&T=1

Globally Unique Identifier (entire table): ba.freestatistics.org/blog/index.php?pk=57795&T=1

As an alternative you can also use a QR Code:  

The GUIDs for individual cells are displayed in the table below:

Multiple Linear Regression - Estimated Regression Equation
bbp[t] = -0.568423714957236 + 0.703034602878663dnst[t] -0.162054421760413y1[t] + 0.24411627990024y2[t] + 0.266239270044661y3[t] -0.441380268244024y4[t] -0.171511342104913y5[t] + 0.249939654919237y6[t] + 0.470407740917486y7[t] + 0.0512513482374854M1[t] + 0.0693410526133588M2[t] + 0.490218937204835M3[t] + 0.43220779370504M4[t] + 0.694046045024337M5[t] + 0.506546659846355M6[t] + 0.45487878836219M7[t] + 0.334984425545786M8[t] + 0.315369054290805M9[t] + 0.468922783621777M10[t] + 0.459780509456216M11[t] -0.0053212905716026t + e[t]


Multiple Linear Regression - Ordinary Least Squares
VariableParameterS.D.T-STATH0: parameter = 02-tail p-value1-tail p-value
(Intercept)-0.5684237149572360.503963-1.12790.266820.13341
dnst0.7030346028786630.1405345.00261.5e-057e-06
y1-0.1620544217604130.122481-1.32310.1941440.097072
y20.244116279900240.1853971.31670.1962540.098127
y30.2662392700446610.1821381.46170.1524860.076243
y4-0.4413802682440240.181964-2.42560.0204220.010211
y5-0.1715113421049130.160095-1.07130.2911610.14558
y60.2499396549192370.164761.5170.1380010.069001
y70.4704077409174860.1461343.2190.0027240.001362
M10.05125134823748540.4366830.11740.9072230.453612
M20.06934105261335880.4362920.15890.874610.437305
M30.4902189372048350.4477151.09490.2808170.140409
M40.432207793705040.4501690.96010.3434090.171704
M50.6940460450243370.4404971.57560.1238660.061933
M60.5065466598463550.4460081.13570.2635720.131786
M70.454878788362190.4443691.02370.312830.156415
M80.3349844255457860.4557610.7350.4671010.23355
M90.3153690542908050.4635850.68030.5006770.250338
M100.4689227836217770.4718530.99380.3269590.163479
M110.4597805094562160.4500341.02170.313760.15688
t-0.00532129057160260.00576-0.92390.3617080.180854

\begin{tabular}{lllllllll}
\hline
Multiple Linear Regression - Ordinary Least Squares \tabularnewline
Variable & Parameter & S.D. & T-STATH0: parameter = 0 & 2-tail p-value & 1-tail p-value \tabularnewline
(Intercept) & -0.568423714957236 & 0.503963 & -1.1279 & 0.26682 & 0.13341 \tabularnewline
dnst & 0.703034602878663 & 0.140534 & 5.0026 & 1.5e-05 & 7e-06 \tabularnewline
y1 & -0.162054421760413 & 0.122481 & -1.3231 & 0.194144 & 0.097072 \tabularnewline
y2 & 0.24411627990024 & 0.185397 & 1.3167 & 0.196254 & 0.098127 \tabularnewline
y3 & 0.266239270044661 & 0.182138 & 1.4617 & 0.152486 & 0.076243 \tabularnewline
y4 & -0.441380268244024 & 0.181964 & -2.4256 & 0.020422 & 0.010211 \tabularnewline
y5 & -0.171511342104913 & 0.160095 & -1.0713 & 0.291161 & 0.14558 \tabularnewline
y6 & 0.249939654919237 & 0.16476 & 1.517 & 0.138001 & 0.069001 \tabularnewline
y7 & 0.470407740917486 & 0.146134 & 3.219 & 0.002724 & 0.001362 \tabularnewline
M1 & 0.0512513482374854 & 0.436683 & 0.1174 & 0.907223 & 0.453612 \tabularnewline
M2 & 0.0693410526133588 & 0.436292 & 0.1589 & 0.87461 & 0.437305 \tabularnewline
M3 & 0.490218937204835 & 0.447715 & 1.0949 & 0.280817 & 0.140409 \tabularnewline
M4 & 0.43220779370504 & 0.450169 & 0.9601 & 0.343409 & 0.171704 \tabularnewline
M5 & 0.694046045024337 & 0.440497 & 1.5756 & 0.123866 & 0.061933 \tabularnewline
M6 & 0.506546659846355 & 0.446008 & 1.1357 & 0.263572 & 0.131786 \tabularnewline
M7 & 0.45487878836219 & 0.444369 & 1.0237 & 0.31283 & 0.156415 \tabularnewline
M8 & 0.334984425545786 & 0.455761 & 0.735 & 0.467101 & 0.23355 \tabularnewline
M9 & 0.315369054290805 & 0.463585 & 0.6803 & 0.500677 & 0.250338 \tabularnewline
M10 & 0.468922783621777 & 0.471853 & 0.9938 & 0.326959 & 0.163479 \tabularnewline
M11 & 0.459780509456216 & 0.450034 & 1.0217 & 0.31376 & 0.15688 \tabularnewline
t & -0.0053212905716026 & 0.00576 & -0.9239 & 0.361708 & 0.180854 \tabularnewline
\hline
\end{tabular}
%Source: https://freestatistics.org/blog/index.php?pk=57795&T=2

[TABLE]
[ROW][C]Multiple Linear Regression - Ordinary Least Squares[/C][/ROW]
[ROW][C]Variable[/C][C]Parameter[/C][C]S.D.[/C][C]T-STATH0: parameter = 0[/C][C]2-tail p-value[/C][C]1-tail p-value[/C][/ROW]
[ROW][C](Intercept)[/C][C]-0.568423714957236[/C][C]0.503963[/C][C]-1.1279[/C][C]0.26682[/C][C]0.13341[/C][/ROW]
[ROW][C]dnst[/C][C]0.703034602878663[/C][C]0.140534[/C][C]5.0026[/C][C]1.5e-05[/C][C]7e-06[/C][/ROW]
[ROW][C]y1[/C][C]-0.162054421760413[/C][C]0.122481[/C][C]-1.3231[/C][C]0.194144[/C][C]0.097072[/C][/ROW]
[ROW][C]y2[/C][C]0.24411627990024[/C][C]0.185397[/C][C]1.3167[/C][C]0.196254[/C][C]0.098127[/C][/ROW]
[ROW][C]y3[/C][C]0.266239270044661[/C][C]0.182138[/C][C]1.4617[/C][C]0.152486[/C][C]0.076243[/C][/ROW]
[ROW][C]y4[/C][C]-0.441380268244024[/C][C]0.181964[/C][C]-2.4256[/C][C]0.020422[/C][C]0.010211[/C][/ROW]
[ROW][C]y5[/C][C]-0.171511342104913[/C][C]0.160095[/C][C]-1.0713[/C][C]0.291161[/C][C]0.14558[/C][/ROW]
[ROW][C]y6[/C][C]0.249939654919237[/C][C]0.16476[/C][C]1.517[/C][C]0.138001[/C][C]0.069001[/C][/ROW]
[ROW][C]y7[/C][C]0.470407740917486[/C][C]0.146134[/C][C]3.219[/C][C]0.002724[/C][C]0.001362[/C][/ROW]
[ROW][C]M1[/C][C]0.0512513482374854[/C][C]0.436683[/C][C]0.1174[/C][C]0.907223[/C][C]0.453612[/C][/ROW]
[ROW][C]M2[/C][C]0.0693410526133588[/C][C]0.436292[/C][C]0.1589[/C][C]0.87461[/C][C]0.437305[/C][/ROW]
[ROW][C]M3[/C][C]0.490218937204835[/C][C]0.447715[/C][C]1.0949[/C][C]0.280817[/C][C]0.140409[/C][/ROW]
[ROW][C]M4[/C][C]0.43220779370504[/C][C]0.450169[/C][C]0.9601[/C][C]0.343409[/C][C]0.171704[/C][/ROW]
[ROW][C]M5[/C][C]0.694046045024337[/C][C]0.440497[/C][C]1.5756[/C][C]0.123866[/C][C]0.061933[/C][/ROW]
[ROW][C]M6[/C][C]0.506546659846355[/C][C]0.446008[/C][C]1.1357[/C][C]0.263572[/C][C]0.131786[/C][/ROW]
[ROW][C]M7[/C][C]0.45487878836219[/C][C]0.444369[/C][C]1.0237[/C][C]0.31283[/C][C]0.156415[/C][/ROW]
[ROW][C]M8[/C][C]0.334984425545786[/C][C]0.455761[/C][C]0.735[/C][C]0.467101[/C][C]0.23355[/C][/ROW]
[ROW][C]M9[/C][C]0.315369054290805[/C][C]0.463585[/C][C]0.6803[/C][C]0.500677[/C][C]0.250338[/C][/ROW]
[ROW][C]M10[/C][C]0.468922783621777[/C][C]0.471853[/C][C]0.9938[/C][C]0.326959[/C][C]0.163479[/C][/ROW]
[ROW][C]M11[/C][C]0.459780509456216[/C][C]0.450034[/C][C]1.0217[/C][C]0.31376[/C][C]0.15688[/C][/ROW]
[ROW][C]t[/C][C]-0.0053212905716026[/C][C]0.00576[/C][C]-0.9239[/C][C]0.361708[/C][C]0.180854[/C][/ROW]
[/TABLE]
Source: https://freestatistics.org/blog/index.php?pk=57795&T=2

Globally Unique Identifier (entire table): ba.freestatistics.org/blog/index.php?pk=57795&T=2

As an alternative you can also use a QR Code:  

The GUIDs for individual cells are displayed in the table below:

Multiple Linear Regression - Ordinary Least Squares
VariableParameterS.D.T-STATH0: parameter = 02-tail p-value1-tail p-value
(Intercept)-0.5684237149572360.503963-1.12790.266820.13341
dnst0.7030346028786630.1405345.00261.5e-057e-06
y1-0.1620544217604130.122481-1.32310.1941440.097072
y20.244116279900240.1853971.31670.1962540.098127
y30.2662392700446610.1821381.46170.1524860.076243
y4-0.4413802682440240.181964-2.42560.0204220.010211
y5-0.1715113421049130.160095-1.07130.2911610.14558
y60.2499396549192370.164761.5170.1380010.069001
y70.4704077409174860.1461343.2190.0027240.001362
M10.05125134823748540.4366830.11740.9072230.453612
M20.06934105261335880.4362920.15890.874610.437305
M30.4902189372048350.4477151.09490.2808170.140409
M40.432207793705040.4501690.96010.3434090.171704
M50.6940460450243370.4404971.57560.1238660.061933
M60.5065466598463550.4460081.13570.2635720.131786
M70.454878788362190.4443691.02370.312830.156415
M80.3349844255457860.4557610.7350.4671010.23355
M90.3153690542908050.4635850.68030.5006770.250338
M100.4689227836217770.4718530.99380.3269590.163479
M110.4597805094562160.4500341.02170.313760.15688
t-0.00532129057160260.00576-0.92390.3617080.180854


Multiple Linear Regression - Regression Statistics
Multiple R0.946118680767614
R-squared0.89514055809745
Adjusted R-squared0.836885312596034
F-TEST (value)15.3658361644993
F-TEST (DF numerator)20
F-TEST (DF denominator)36
p-value4.29933866286092e-12
Multiple Linear Regression - Residual Statistics
Residual Standard Deviation0.629787561030837
Sum Squared Residuals14.2787653930501

\begin{tabular}{lllllllll}
\hline
Multiple Linear Regression - Regression Statistics \tabularnewline
Multiple R & 0.946118680767614 \tabularnewline
R-squared & 0.89514055809745 \tabularnewline
Adjusted R-squared & 0.836885312596034 \tabularnewline
F-TEST (value) & 15.3658361644993 \tabularnewline
F-TEST (DF numerator) & 20 \tabularnewline
F-TEST (DF denominator) & 36 \tabularnewline
p-value & 4.29933866286092e-12 \tabularnewline
Multiple Linear Regression - Residual Statistics \tabularnewline
Residual Standard Deviation & 0.629787561030837 \tabularnewline
Sum Squared Residuals & 14.2787653930501 \tabularnewline
\hline
\end{tabular}
%Source: https://freestatistics.org/blog/index.php?pk=57795&T=3

[TABLE]
[ROW][C]Multiple Linear Regression - Regression Statistics[/C][/ROW]
[ROW][C]Multiple R[/C][C]0.946118680767614[/C][/ROW]
[ROW][C]R-squared[/C][C]0.89514055809745[/C][/ROW]
[ROW][C]Adjusted R-squared[/C][C]0.836885312596034[/C][/ROW]
[ROW][C]F-TEST (value)[/C][C]15.3658361644993[/C][/ROW]
[ROW][C]F-TEST (DF numerator)[/C][C]20[/C][/ROW]
[ROW][C]F-TEST (DF denominator)[/C][C]36[/C][/ROW]
[ROW][C]p-value[/C][C]4.29933866286092e-12[/C][/ROW]
[ROW][C]Multiple Linear Regression - Residual Statistics[/C][/ROW]
[ROW][C]Residual Standard Deviation[/C][C]0.629787561030837[/C][/ROW]
[ROW][C]Sum Squared Residuals[/C][C]14.2787653930501[/C][/ROW]
[/TABLE]
Source: https://freestatistics.org/blog/index.php?pk=57795&T=3

Globally Unique Identifier (entire table): ba.freestatistics.org/blog/index.php?pk=57795&T=3

As an alternative you can also use a QR Code:  

The GUIDs for individual cells are displayed in the table below:

Multiple Linear Regression - Regression Statistics
Multiple R0.946118680767614
R-squared0.89514055809745
Adjusted R-squared0.836885312596034
F-TEST (value)15.3658361644993
F-TEST (DF numerator)20
F-TEST (DF denominator)36
p-value4.29933866286092e-12
Multiple Linear Regression - Residual Statistics
Residual Standard Deviation0.629787561030837
Sum Squared Residuals14.2787653930501


Multiple Linear Regression - Actuals, Interpolation, and Residuals
Time or IndexActualsInterpolationForecastResidualsPrediction Error
11.41.58372085057313-0.183720850573128
210.5561366514976470.443863348502353
3-0.8-1.097800121106510.297800121106510
4-2.9-2.18038317528797-0.719616824712032
5-0.7-0.448183977912406-0.251816022087594
6-0.70.305378955223529-1.00537895522353
71.51.245363291757600.254636708242399
833.06866232109842-0.0686623210984154
93.23.39124670126731-0.191246701267307
103.13.57904910649754-0.479049106497544
113.93.346506621553140.553493378446865
1211.29615653657522-0.296156536575215
131.30.4766006026276350.823399397372365
140.8-0.2598202879358721.05982028793587
151.20.5466512382563180.653348761743682
162.92.371060044424670.528939955575333
173.93.888723112647870.011276887352129
184.54.321313245152230.178686754847773
194.54.17247939554960.327520604450401
203.32.443134923330720.856865076669277
2121.822905835690460.177094164309539
221.51.469530383325180.0304696166748235
2311.59390884001446-0.593908840014458
242.12.66018401052539-0.560184010525386
2533.79805748529943-0.798057485299434
2644.73420058170684-0.734200581706845
275.15.090609588413240.00939041158676178
284.54.277972206099480.222027793900522
294.23.286768119759690.913231880240314
303.32.981526602734280.318473397265715
312.73.12371071143807-0.423710711438068
321.82.24928994409353-0.449289944093529
331.41.55259547250106-0.152595472501059
340.50.4823927403745730.0176072596254273
35-0.40.268847632604668-0.668847632604668
360.80.4940152722616050.305984727738395
370.71.22591082512252-0.525910825122517
381.92.04578396550286-0.145783965502861
3922.30668376234864-0.306683762348638
401.11.59341749893524-0.493417498935245
410.91.64923219699979-0.74923219699979
420.40.587989156850827-0.187989156850827
430.70.75287268616696-0.0528726861669602
442.12.17056267134489-0.0705626713448856
452.82.97473658811461-0.174736588114607
463.93.469027769802710.430972230197293
473.52.790736905827740.709263094172262
4821.449644180637790.550355819362207
4921.315710236377290.684289763622714
501.52.12369908922852-0.62369908922852
512.53.15385553208832-0.653855532088316
523.12.637933425828580.462066574171422
532.72.623460548505060.0765394514949404
542.82.103792040039130.696207959960868
552.52.60557391508777-0.105573915087772
5633.26835014013245-0.268350140132448
573.22.858515402426570.341484597573434

\begin{tabular}{lllllllll}
\hline
Multiple Linear Regression - Actuals, Interpolation, and Residuals \tabularnewline
Time or Index & Actuals & InterpolationForecast & ResidualsPrediction Error \tabularnewline
1 & 1.4 & 1.58372085057313 & -0.183720850573128 \tabularnewline
2 & 1 & 0.556136651497647 & 0.443863348502353 \tabularnewline
3 & -0.8 & -1.09780012110651 & 0.297800121106510 \tabularnewline
4 & -2.9 & -2.18038317528797 & -0.719616824712032 \tabularnewline
5 & -0.7 & -0.448183977912406 & -0.251816022087594 \tabularnewline
6 & -0.7 & 0.305378955223529 & -1.00537895522353 \tabularnewline
7 & 1.5 & 1.24536329175760 & 0.254636708242399 \tabularnewline
8 & 3 & 3.06866232109842 & -0.0686623210984154 \tabularnewline
9 & 3.2 & 3.39124670126731 & -0.191246701267307 \tabularnewline
10 & 3.1 & 3.57904910649754 & -0.479049106497544 \tabularnewline
11 & 3.9 & 3.34650662155314 & 0.553493378446865 \tabularnewline
12 & 1 & 1.29615653657522 & -0.296156536575215 \tabularnewline
13 & 1.3 & 0.476600602627635 & 0.823399397372365 \tabularnewline
14 & 0.8 & -0.259820287935872 & 1.05982028793587 \tabularnewline
15 & 1.2 & 0.546651238256318 & 0.653348761743682 \tabularnewline
16 & 2.9 & 2.37106004442467 & 0.528939955575333 \tabularnewline
17 & 3.9 & 3.88872311264787 & 0.011276887352129 \tabularnewline
18 & 4.5 & 4.32131324515223 & 0.178686754847773 \tabularnewline
19 & 4.5 & 4.1724793955496 & 0.327520604450401 \tabularnewline
20 & 3.3 & 2.44313492333072 & 0.856865076669277 \tabularnewline
21 & 2 & 1.82290583569046 & 0.177094164309539 \tabularnewline
22 & 1.5 & 1.46953038332518 & 0.0304696166748235 \tabularnewline
23 & 1 & 1.59390884001446 & -0.593908840014458 \tabularnewline
24 & 2.1 & 2.66018401052539 & -0.560184010525386 \tabularnewline
25 & 3 & 3.79805748529943 & -0.798057485299434 \tabularnewline
26 & 4 & 4.73420058170684 & -0.734200581706845 \tabularnewline
27 & 5.1 & 5.09060958841324 & 0.00939041158676178 \tabularnewline
28 & 4.5 & 4.27797220609948 & 0.222027793900522 \tabularnewline
29 & 4.2 & 3.28676811975969 & 0.913231880240314 \tabularnewline
30 & 3.3 & 2.98152660273428 & 0.318473397265715 \tabularnewline
31 & 2.7 & 3.12371071143807 & -0.423710711438068 \tabularnewline
32 & 1.8 & 2.24928994409353 & -0.449289944093529 \tabularnewline
33 & 1.4 & 1.55259547250106 & -0.152595472501059 \tabularnewline
34 & 0.5 & 0.482392740374573 & 0.0176072596254273 \tabularnewline
35 & -0.4 & 0.268847632604668 & -0.668847632604668 \tabularnewline
36 & 0.8 & 0.494015272261605 & 0.305984727738395 \tabularnewline
37 & 0.7 & 1.22591082512252 & -0.525910825122517 \tabularnewline
38 & 1.9 & 2.04578396550286 & -0.145783965502861 \tabularnewline
39 & 2 & 2.30668376234864 & -0.306683762348638 \tabularnewline
40 & 1.1 & 1.59341749893524 & -0.493417498935245 \tabularnewline
41 & 0.9 & 1.64923219699979 & -0.74923219699979 \tabularnewline
42 & 0.4 & 0.587989156850827 & -0.187989156850827 \tabularnewline
43 & 0.7 & 0.75287268616696 & -0.0528726861669602 \tabularnewline
44 & 2.1 & 2.17056267134489 & -0.0705626713448856 \tabularnewline
45 & 2.8 & 2.97473658811461 & -0.174736588114607 \tabularnewline
46 & 3.9 & 3.46902776980271 & 0.430972230197293 \tabularnewline
47 & 3.5 & 2.79073690582774 & 0.709263094172262 \tabularnewline
48 & 2 & 1.44964418063779 & 0.550355819362207 \tabularnewline
49 & 2 & 1.31571023637729 & 0.684289763622714 \tabularnewline
50 & 1.5 & 2.12369908922852 & -0.62369908922852 \tabularnewline
51 & 2.5 & 3.15385553208832 & -0.653855532088316 \tabularnewline
52 & 3.1 & 2.63793342582858 & 0.462066574171422 \tabularnewline
53 & 2.7 & 2.62346054850506 & 0.0765394514949404 \tabularnewline
54 & 2.8 & 2.10379204003913 & 0.696207959960868 \tabularnewline
55 & 2.5 & 2.60557391508777 & -0.105573915087772 \tabularnewline
56 & 3 & 3.26835014013245 & -0.268350140132448 \tabularnewline
57 & 3.2 & 2.85851540242657 & 0.341484597573434 \tabularnewline
\hline
\end{tabular}
%Source: https://freestatistics.org/blog/index.php?pk=57795&T=4

[TABLE]
[ROW][C]Multiple Linear Regression - Actuals, Interpolation, and Residuals[/C][/ROW]
[ROW][C]Time or Index[/C][C]Actuals[/C][C]InterpolationForecast[/C][C]ResidualsPrediction Error[/C][/ROW]
[ROW][C]1[/C][C]1.4[/C][C]1.58372085057313[/C][C]-0.183720850573128[/C][/ROW]
[ROW][C]2[/C][C]1[/C][C]0.556136651497647[/C][C]0.443863348502353[/C][/ROW]
[ROW][C]3[/C][C]-0.8[/C][C]-1.09780012110651[/C][C]0.297800121106510[/C][/ROW]
[ROW][C]4[/C][C]-2.9[/C][C]-2.18038317528797[/C][C]-0.719616824712032[/C][/ROW]
[ROW][C]5[/C][C]-0.7[/C][C]-0.448183977912406[/C][C]-0.251816022087594[/C][/ROW]
[ROW][C]6[/C][C]-0.7[/C][C]0.305378955223529[/C][C]-1.00537895522353[/C][/ROW]
[ROW][C]7[/C][C]1.5[/C][C]1.24536329175760[/C][C]0.254636708242399[/C][/ROW]
[ROW][C]8[/C][C]3[/C][C]3.06866232109842[/C][C]-0.0686623210984154[/C][/ROW]
[ROW][C]9[/C][C]3.2[/C][C]3.39124670126731[/C][C]-0.191246701267307[/C][/ROW]
[ROW][C]10[/C][C]3.1[/C][C]3.57904910649754[/C][C]-0.479049106497544[/C][/ROW]
[ROW][C]11[/C][C]3.9[/C][C]3.34650662155314[/C][C]0.553493378446865[/C][/ROW]
[ROW][C]12[/C][C]1[/C][C]1.29615653657522[/C][C]-0.296156536575215[/C][/ROW]
[ROW][C]13[/C][C]1.3[/C][C]0.476600602627635[/C][C]0.823399397372365[/C][/ROW]
[ROW][C]14[/C][C]0.8[/C][C]-0.259820287935872[/C][C]1.05982028793587[/C][/ROW]
[ROW][C]15[/C][C]1.2[/C][C]0.546651238256318[/C][C]0.653348761743682[/C][/ROW]
[ROW][C]16[/C][C]2.9[/C][C]2.37106004442467[/C][C]0.528939955575333[/C][/ROW]
[ROW][C]17[/C][C]3.9[/C][C]3.88872311264787[/C][C]0.011276887352129[/C][/ROW]
[ROW][C]18[/C][C]4.5[/C][C]4.32131324515223[/C][C]0.178686754847773[/C][/ROW]
[ROW][C]19[/C][C]4.5[/C][C]4.1724793955496[/C][C]0.327520604450401[/C][/ROW]
[ROW][C]20[/C][C]3.3[/C][C]2.44313492333072[/C][C]0.856865076669277[/C][/ROW]
[ROW][C]21[/C][C]2[/C][C]1.82290583569046[/C][C]0.177094164309539[/C][/ROW]
[ROW][C]22[/C][C]1.5[/C][C]1.46953038332518[/C][C]0.0304696166748235[/C][/ROW]
[ROW][C]23[/C][C]1[/C][C]1.59390884001446[/C][C]-0.593908840014458[/C][/ROW]
[ROW][C]24[/C][C]2.1[/C][C]2.66018401052539[/C][C]-0.560184010525386[/C][/ROW]
[ROW][C]25[/C][C]3[/C][C]3.79805748529943[/C][C]-0.798057485299434[/C][/ROW]
[ROW][C]26[/C][C]4[/C][C]4.73420058170684[/C][C]-0.734200581706845[/C][/ROW]
[ROW][C]27[/C][C]5.1[/C][C]5.09060958841324[/C][C]0.00939041158676178[/C][/ROW]
[ROW][C]28[/C][C]4.5[/C][C]4.27797220609948[/C][C]0.222027793900522[/C][/ROW]
[ROW][C]29[/C][C]4.2[/C][C]3.28676811975969[/C][C]0.913231880240314[/C][/ROW]
[ROW][C]30[/C][C]3.3[/C][C]2.98152660273428[/C][C]0.318473397265715[/C][/ROW]
[ROW][C]31[/C][C]2.7[/C][C]3.12371071143807[/C][C]-0.423710711438068[/C][/ROW]
[ROW][C]32[/C][C]1.8[/C][C]2.24928994409353[/C][C]-0.449289944093529[/C][/ROW]
[ROW][C]33[/C][C]1.4[/C][C]1.55259547250106[/C][C]-0.152595472501059[/C][/ROW]
[ROW][C]34[/C][C]0.5[/C][C]0.482392740374573[/C][C]0.0176072596254273[/C][/ROW]
[ROW][C]35[/C][C]-0.4[/C][C]0.268847632604668[/C][C]-0.668847632604668[/C][/ROW]
[ROW][C]36[/C][C]0.8[/C][C]0.494015272261605[/C][C]0.305984727738395[/C][/ROW]
[ROW][C]37[/C][C]0.7[/C][C]1.22591082512252[/C][C]-0.525910825122517[/C][/ROW]
[ROW][C]38[/C][C]1.9[/C][C]2.04578396550286[/C][C]-0.145783965502861[/C][/ROW]
[ROW][C]39[/C][C]2[/C][C]2.30668376234864[/C][C]-0.306683762348638[/C][/ROW]
[ROW][C]40[/C][C]1.1[/C][C]1.59341749893524[/C][C]-0.493417498935245[/C][/ROW]
[ROW][C]41[/C][C]0.9[/C][C]1.64923219699979[/C][C]-0.74923219699979[/C][/ROW]
[ROW][C]42[/C][C]0.4[/C][C]0.587989156850827[/C][C]-0.187989156850827[/C][/ROW]
[ROW][C]43[/C][C]0.7[/C][C]0.75287268616696[/C][C]-0.0528726861669602[/C][/ROW]
[ROW][C]44[/C][C]2.1[/C][C]2.17056267134489[/C][C]-0.0705626713448856[/C][/ROW]
[ROW][C]45[/C][C]2.8[/C][C]2.97473658811461[/C][C]-0.174736588114607[/C][/ROW]
[ROW][C]46[/C][C]3.9[/C][C]3.46902776980271[/C][C]0.430972230197293[/C][/ROW]
[ROW][C]47[/C][C]3.5[/C][C]2.79073690582774[/C][C]0.709263094172262[/C][/ROW]
[ROW][C]48[/C][C]2[/C][C]1.44964418063779[/C][C]0.550355819362207[/C][/ROW]
[ROW][C]49[/C][C]2[/C][C]1.31571023637729[/C][C]0.684289763622714[/C][/ROW]
[ROW][C]50[/C][C]1.5[/C][C]2.12369908922852[/C][C]-0.62369908922852[/C][/ROW]
[ROW][C]51[/C][C]2.5[/C][C]3.15385553208832[/C][C]-0.653855532088316[/C][/ROW]
[ROW][C]52[/C][C]3.1[/C][C]2.63793342582858[/C][C]0.462066574171422[/C][/ROW]
[ROW][C]53[/C][C]2.7[/C][C]2.62346054850506[/C][C]0.0765394514949404[/C][/ROW]
[ROW][C]54[/C][C]2.8[/C][C]2.10379204003913[/C][C]0.696207959960868[/C][/ROW]
[ROW][C]55[/C][C]2.5[/C][C]2.60557391508777[/C][C]-0.105573915087772[/C][/ROW]
[ROW][C]56[/C][C]3[/C][C]3.26835014013245[/C][C]-0.268350140132448[/C][/ROW]
[ROW][C]57[/C][C]3.2[/C][C]2.85851540242657[/C][C]0.341484597573434[/C][/ROW]
[/TABLE]
Source: https://freestatistics.org/blog/index.php?pk=57795&T=4

Globally Unique Identifier (entire table): ba.freestatistics.org/blog/index.php?pk=57795&T=4

As an alternative you can also use a QR Code:  

The GUIDs for individual cells are displayed in the table below:

Multiple Linear Regression - Actuals, Interpolation, and Residuals
Time or IndexActualsInterpolationForecastResidualsPrediction Error
11.41.58372085057313-0.183720850573128
210.5561366514976470.443863348502353
3-0.8-1.097800121106510.297800121106510
4-2.9-2.18038317528797-0.719616824712032
5-0.7-0.448183977912406-0.251816022087594
6-0.70.305378955223529-1.00537895522353
71.51.245363291757600.254636708242399
833.06866232109842-0.0686623210984154
93.23.39124670126731-0.191246701267307
103.13.57904910649754-0.479049106497544
113.93.346506621553140.553493378446865
1211.29615653657522-0.296156536575215
131.30.4766006026276350.823399397372365
140.8-0.2598202879358721.05982028793587
151.20.5466512382563180.653348761743682
162.92.371060044424670.528939955575333
173.93.888723112647870.011276887352129
184.54.321313245152230.178686754847773
194.54.17247939554960.327520604450401
203.32.443134923330720.856865076669277
2121.822905835690460.177094164309539
221.51.469530383325180.0304696166748235
2311.59390884001446-0.593908840014458
242.12.66018401052539-0.560184010525386
2533.79805748529943-0.798057485299434
2644.73420058170684-0.734200581706845
275.15.090609588413240.00939041158676178
284.54.277972206099480.222027793900522
294.23.286768119759690.913231880240314
303.32.981526602734280.318473397265715
312.73.12371071143807-0.423710711438068
321.82.24928994409353-0.449289944093529
331.41.55259547250106-0.152595472501059
340.50.4823927403745730.0176072596254273
35-0.40.268847632604668-0.668847632604668
360.80.4940152722616050.305984727738395
370.71.22591082512252-0.525910825122517
381.92.04578396550286-0.145783965502861
3922.30668376234864-0.306683762348638
401.11.59341749893524-0.493417498935245
410.91.64923219699979-0.74923219699979
420.40.587989156850827-0.187989156850827
430.70.75287268616696-0.0528726861669602
442.12.17056267134489-0.0705626713448856
452.82.97473658811461-0.174736588114607
463.93.469027769802710.430972230197293
473.52.790736905827740.709263094172262
4821.449644180637790.550355819362207
4921.315710236377290.684289763622714
501.52.12369908922852-0.62369908922852
512.53.15385553208832-0.653855532088316
523.12.637933425828580.462066574171422
532.72.623460548505060.0765394514949404
542.82.103792040039130.696207959960868
552.52.60557391508777-0.105573915087772
5633.26835014013245-0.268350140132448
573.22.858515402426570.341484597573434


Goldfeld-Quandt test for Heteroskedasticity
p-valuesAlternative Hypothesis
breakpoint indexgreater2-sidedless
240.4580514990024620.9161029980049250.541948500997538
250.9666377043706570.06672459125868590.0333622956293429
260.9608574301982350.0782851396035290.0391425698017645
270.9353072941596620.1293854116806760.0646927058403381
280.9065576668029220.1868846663941560.0934423331970781
290.9568854833814810.08622903323703780.0431145166185189
300.9178634860068730.1642730279862540.0821365139931271
310.9596658110426590.08066837791468220.0403341889573411
320.9485105002448110.1029789995103780.0514894997551888
330.8883367639994530.2233264720010930.111663236000546

\begin{tabular}{lllllllll}
\hline
Goldfeld-Quandt test for Heteroskedasticity \tabularnewline
p-values & Alternative Hypothesis \tabularnewline
breakpoint index & greater & 2-sided & less \tabularnewline
24 & 0.458051499002462 & 0.916102998004925 & 0.541948500997538 \tabularnewline
25 & 0.966637704370657 & 0.0667245912586859 & 0.0333622956293429 \tabularnewline
26 & 0.960857430198235 & 0.078285139603529 & 0.0391425698017645 \tabularnewline
27 & 0.935307294159662 & 0.129385411680676 & 0.0646927058403381 \tabularnewline
28 & 0.906557666802922 & 0.186884666394156 & 0.0934423331970781 \tabularnewline
29 & 0.956885483381481 & 0.0862290332370378 & 0.0431145166185189 \tabularnewline
30 & 0.917863486006873 & 0.164273027986254 & 0.0821365139931271 \tabularnewline
31 & 0.959665811042659 & 0.0806683779146822 & 0.0403341889573411 \tabularnewline
32 & 0.948510500244811 & 0.102978999510378 & 0.0514894997551888 \tabularnewline
33 & 0.888336763999453 & 0.223326472001093 & 0.111663236000546 \tabularnewline
\hline
\end{tabular}
%Source: https://freestatistics.org/blog/index.php?pk=57795&T=5

[TABLE]
[ROW][C]Goldfeld-Quandt test for Heteroskedasticity[/C][/ROW]
[ROW][C]p-values[/C][C]Alternative Hypothesis[/C][/ROW]
[ROW][C]breakpoint index[/C][C]greater[/C][C]2-sided[/C][C]less[/C][/ROW]
[ROW][C]24[/C][C]0.458051499002462[/C][C]0.916102998004925[/C][C]0.541948500997538[/C][/ROW]
[ROW][C]25[/C][C]0.966637704370657[/C][C]0.0667245912586859[/C][C]0.0333622956293429[/C][/ROW]
[ROW][C]26[/C][C]0.960857430198235[/C][C]0.078285139603529[/C][C]0.0391425698017645[/C][/ROW]
[ROW][C]27[/C][C]0.935307294159662[/C][C]0.129385411680676[/C][C]0.0646927058403381[/C][/ROW]
[ROW][C]28[/C][C]0.906557666802922[/C][C]0.186884666394156[/C][C]0.0934423331970781[/C][/ROW]
[ROW][C]29[/C][C]0.956885483381481[/C][C]0.0862290332370378[/C][C]0.0431145166185189[/C][/ROW]
[ROW][C]30[/C][C]0.917863486006873[/C][C]0.164273027986254[/C][C]0.0821365139931271[/C][/ROW]
[ROW][C]31[/C][C]0.959665811042659[/C][C]0.0806683779146822[/C][C]0.0403341889573411[/C][/ROW]
[ROW][C]32[/C][C]0.948510500244811[/C][C]0.102978999510378[/C][C]0.0514894997551888[/C][/ROW]
[ROW][C]33[/C][C]0.888336763999453[/C][C]0.223326472001093[/C][C]0.111663236000546[/C][/ROW]
[/TABLE]
Source: https://freestatistics.org/blog/index.php?pk=57795&T=5

Globally Unique Identifier (entire table): ba.freestatistics.org/blog/index.php?pk=57795&T=5

As an alternative you can also use a QR Code:  

The GUIDs for individual cells are displayed in the table below:

Goldfeld-Quandt test for Heteroskedasticity
p-valuesAlternative Hypothesis
breakpoint indexgreater2-sidedless
240.4580514990024620.9161029980049250.541948500997538
250.9666377043706570.06672459125868590.0333622956293429
260.9608574301982350.0782851396035290.0391425698017645
270.9353072941596620.1293854116806760.0646927058403381
280.9065576668029220.1868846663941560.0934423331970781
290.9568854833814810.08622903323703780.0431145166185189
300.9178634860068730.1642730279862540.0821365139931271
310.9596658110426590.08066837791468220.0403341889573411
320.9485105002448110.1029789995103780.0514894997551888
330.8883367639994530.2233264720010930.111663236000546


Meta Analysis of Goldfeld-Quandt test for Heteroskedasticity
Description# significant tests% significant testsOK/NOK
1% type I error level00OK
5% type I error level00OK
10% type I error level40.4NOK

\begin{tabular}{lllllllll}
\hline
Meta Analysis of Goldfeld-Quandt test for Heteroskedasticity \tabularnewline
Description & # significant tests & % significant tests & OK/NOK \tabularnewline
1% type I error level & 0 & 0 & OK \tabularnewline
5% type I error level & 0 & 0 & OK \tabularnewline
10% type I error level & 4 & 0.4 & NOK \tabularnewline
\hline
\end{tabular}
%Source: https://freestatistics.org/blog/index.php?pk=57795&T=6

[TABLE]
[ROW][C]Meta Analysis of Goldfeld-Quandt test for Heteroskedasticity[/C][/ROW]
[ROW][C]Description[/C][C]# significant tests[/C][C]% significant tests[/C][C]OK/NOK[/C][/ROW]
[ROW][C]1% type I error level[/C][C]0[/C][C]0[/C][C]OK[/C][/ROW]
[ROW][C]5% type I error level[/C][C]0[/C][C]0[/C][C]OK[/C][/ROW]
[ROW][C]10% type I error level[/C][C]4[/C][C]0.4[/C][C]NOK[/C][/ROW]
[/TABLE]
Source: https://freestatistics.org/blog/index.php?pk=57795&T=6

Globally Unique Identifier (entire table): ba.freestatistics.org/blog/index.php?pk=57795&T=6

As an alternative you can also use a QR Code:  

The GUIDs for individual cells are displayed in the table below:

Meta Analysis of Goldfeld-Quandt test for Heteroskedasticity
Description# significant tests% significant testsOK/NOK
1% type I error level00OK
5% type I error level00OK
10% type I error level40.4NOK


Parameters (Session):
par1 = 1 ; par2 = Include Monthly Dummies ; par3 = Linear Trend ;
Parameters (R input):
par1 = 1 ; par2 = Include Monthly Dummies ; par3 = Linear Trend ;
R code (references can be found in the software module):
library(lattice)
library(lmtest)
n25 <- 25 #minimum number of obs. for Goldfeld-Quandt test
par1 <- as.numeric(par1)
x <- t(y)
k <- length(x[1,])
n <- length(x[,1])
x1 <- cbind(x[,par1], x[,1:k!=par1])
mycolnames <- c(colnames(x)[par1], colnames(x)[1:k!=par1])
colnames(x1) <- mycolnames #colnames(x)[par1]
x <- x1
if (par3 == 'First Differences'){
x2 <- array(0, dim=c(n-1,k), dimnames=list(1:(n-1), paste('(1-B)',colnames(x),sep='')))
for (i in 1:n-1) {
for (j in 1:k) {
x2[i,j] <- x[i+1,j] - x[i,j]
}
}
x <- x2
}
if (par2 == 'Include Monthly Dummies'){
x2 <- array(0, dim=c(n,11), dimnames=list(1:n, paste('M', seq(1:11), sep ='')))
for (i in 1:11){
x2[seq(i,n,12),i] <- 1
}
x <- cbind(x, x2)
}
if (par2 == 'Include Quarterly Dummies'){
x2 <- array(0, dim=c(n,3), dimnames=list(1:n, paste('Q', seq(1:3), sep ='')))
for (i in 1:3){
x2[seq(i,n,4),i] <- 1
}
x <- cbind(x, x2)
}
k <- length(x[1,])
if (par3 == 'Linear Trend'){
x <- cbind(x, c(1:n))
colnames(x)[k+1] <- 't'
}
x
k <- length(x[1,])
df <- as.data.frame(x)
(mylm <- lm(df))
(mysum <- summary(mylm))
if (n > n25) {
kp3 <- k + 3
nmkm3 <- n - k - 3
gqarr <- array(NA, dim=c(nmkm3-kp3+1,3))
numgqtests <- 0
numsignificant1 <- 0
numsignificant5 <- 0
numsignificant10 <- 0
for (mypoint in kp3:nmkm3) {
j <- 0
numgqtests <- numgqtests + 1
for (myalt in c('greater', 'two.sided', 'less')) {
j <- j + 1
gqarr[mypoint-kp3+1,j] <- gqtest(mylm, point=mypoint, alternative=myalt)$p.value
}
if (gqarr[mypoint-kp3+1,2] < 0.01) numsignificant1 <- numsignificant1 + 1
if (gqarr[mypoint-kp3+1,2] < 0.05) numsignificant5 <- numsignificant5 + 1
if (gqarr[mypoint-kp3+1,2] < 0.10) numsignificant10 <- numsignificant10 + 1
}
gqarr
}
bitmap(file='test0.png')
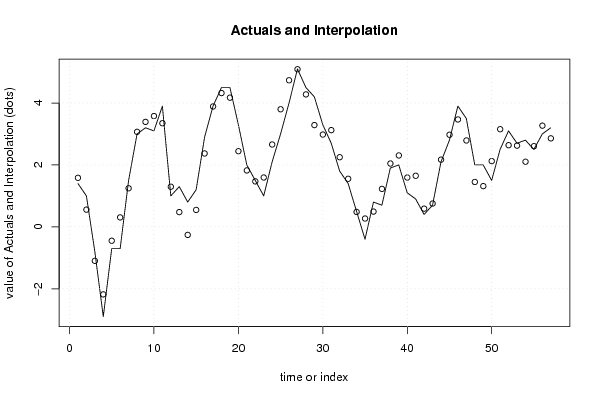
plot(x[,1], type='l', main='Actuals and Interpolation', ylab='value of Actuals and Interpolation (dots)', xlab='time or index')
points(x[,1]-mysum$resid)
grid()
dev.off()
bitmap(file='test1.png')
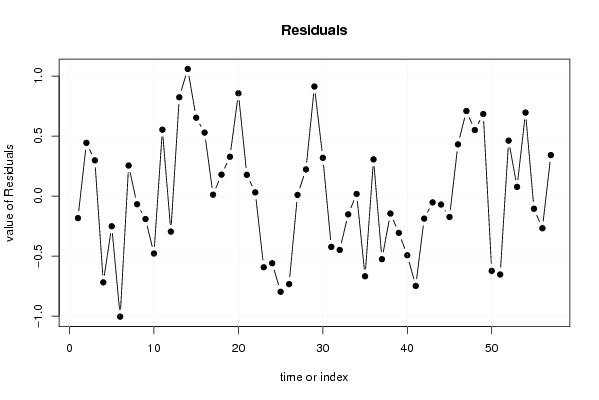
plot(mysum$resid, type='b', pch=19, main='Residuals', ylab='value of Residuals', xlab='time or index')
grid()
dev.off()
bitmap(file='test2.png')
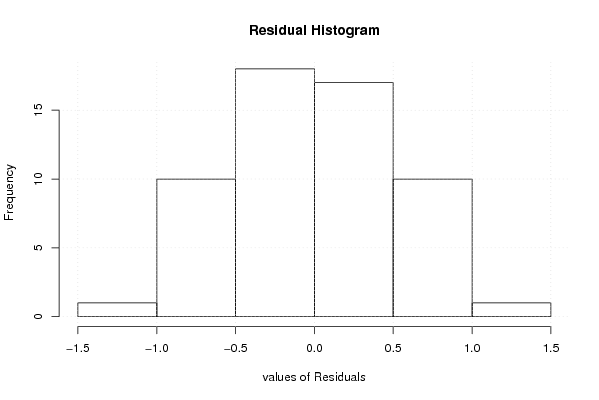
hist(mysum$resid, main='Residual Histogram', xlab='values of Residuals')
grid()
dev.off()
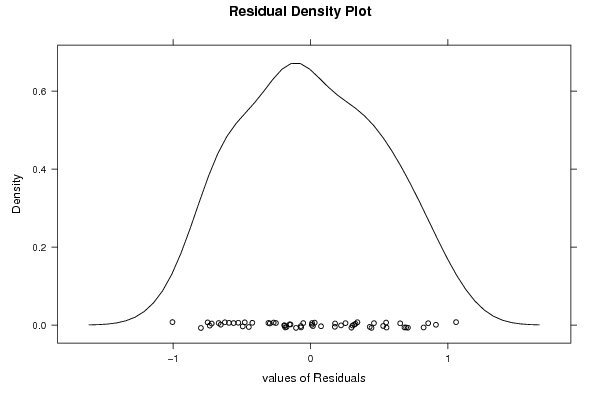
bitmap(file='test3.png')
densityplot(~mysum$resid,col='black',main='Residual Density Plot', xlab='values of Residuals')
dev.off()
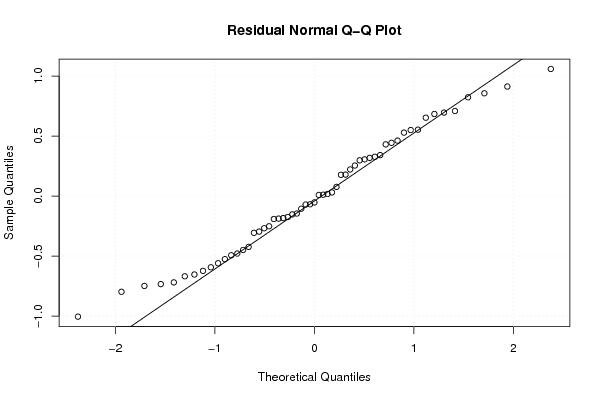
bitmap(file='test4.png')
qqnorm(mysum$resid, main='Residual Normal Q-Q Plot')
qqline(mysum$resid)
grid()
dev.off()
(myerror <- as.ts(mysum$resid))
bitmap(file='test5.png')
dum <- cbind(lag(myerror,k=1),myerror)
dum
dum1 <- dum[2:length(myerror),]
dum1
z <- as.data.frame(dum1)
z
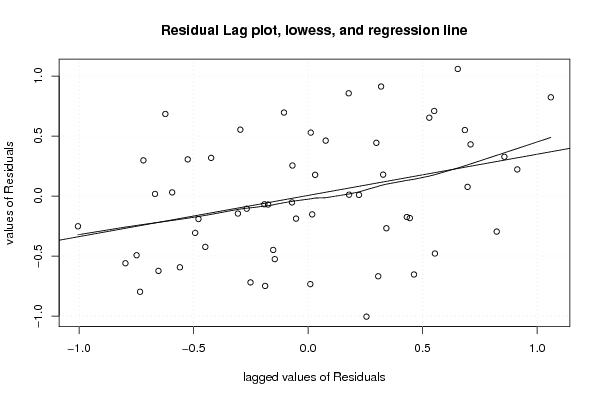
plot(z,main=paste('Residual Lag plot, lowess, and regression line'), ylab='values of Residuals', xlab='lagged values of Residuals')
lines(lowess(z))
abline(lm(z))
grid()
dev.off()
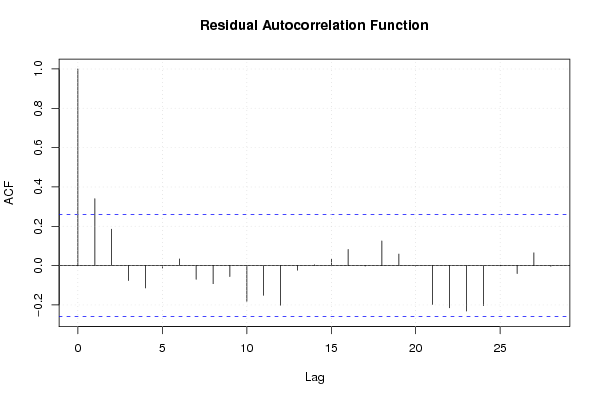
bitmap(file='test6.png')
acf(mysum$resid, lag.max=length(mysum$resid)/2, main='Residual Autocorrelation Function')
grid()
dev.off()
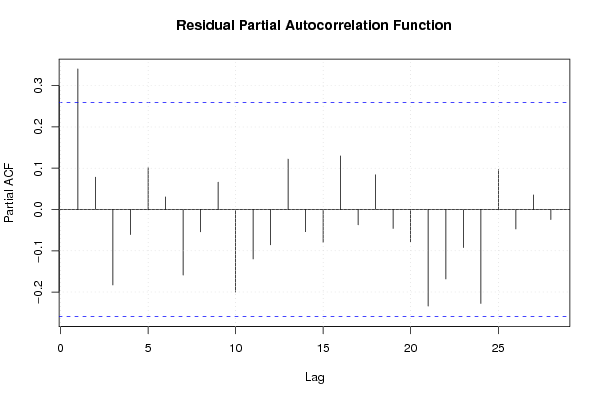
bitmap(file='test7.png')
pacf(mysum$resid, lag.max=length(mysum$resid)/2, main='Residual Partial Autocorrelation Function')
grid()
dev.off()
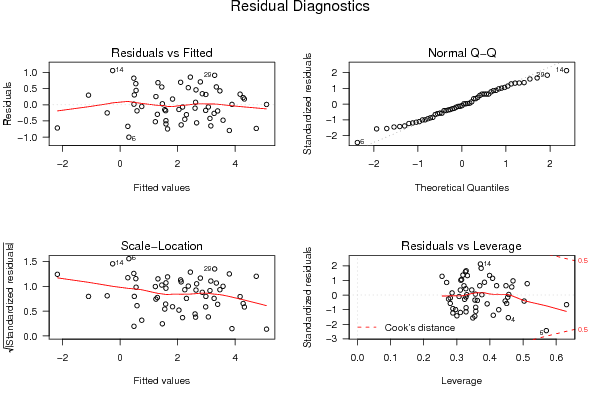
bitmap(file='test8.png')
opar <- par(mfrow = c(2,2), oma = c(0, 0, 1.1, 0))
plot(mylm, las = 1, sub='Residual Diagnostics')
par(opar)
dev.off()
if (n > n25) {
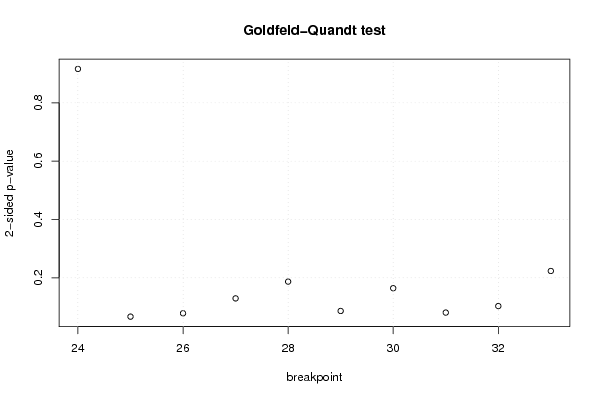
bitmap(file='test9.png')
plot(kp3:nmkm3,gqarr[,2], main='Goldfeld-Quandt test',ylab='2-sided p-value',xlab='breakpoint')
grid()
dev.off()
}
load(file='createtable')
a<-table.start()
a<-table.row.start(a)
a<-table.element(a, 'Multiple Linear Regression - Estimated Regression Equation', 1, TRUE)
a<-table.row.end(a)
myeq <- colnames(x)[1]
myeq <- paste(myeq, '[t] = ', sep='')
for (i in 1:k){
if (mysum$coefficients[i,1] > 0) myeq <- paste(myeq, '+', '')
myeq <- paste(myeq, mysum$coefficients[i,1], sep=' ')
if (rownames(mysum$coefficients)[i] != '(Intercept)') {
myeq <- paste(myeq, rownames(mysum$coefficients)[i], sep='')
if (rownames(mysum$coefficients)[i] != 't') myeq <- paste(myeq, '[t]', sep='')
}
}
myeq <- paste(myeq, ' + e[t]')
a<-table.row.start(a)
a<-table.element(a, myeq)
a<-table.row.end(a)
a<-table.end(a)
table.save(a,file='mytable1.tab')
a<-table.start()
a<-table.row.start(a)
a<-table.element(a,hyperlink('ols1.htm','Multiple Linear Regression - Ordinary Least Squares',''), 6, TRUE)
a<-table.row.end(a)
a<-table.row.start(a)
a<-table.element(a,'Variable',header=TRUE)
a<-table.element(a,'Parameter',header=TRUE)
a<-table.element(a,'S.D.',header=TRUE)
a<-table.element(a,'T-STAT
H0: parameter = 0',header=TRUE)
a<-table.element(a,'2-tail p-value',header=TRUE)
a<-table.element(a,'1-tail p-value',header=TRUE)
a<-table.row.end(a)
for (i in 1:k){
a<-table.row.start(a)
a<-table.element(a,rownames(mysum$coefficients)[i],header=TRUE)
a<-table.element(a,mysum$coefficients[i,1])
a<-table.element(a, round(mysum$coefficients[i,2],6))
a<-table.element(a, round(mysum$coefficients[i,3],4))
a<-table.element(a, round(mysum$coefficients[i,4],6))
a<-table.element(a, round(mysum$coefficients[i,4]/2,6))
a<-table.row.end(a)
}
a<-table.end(a)
table.save(a,file='mytable2.tab')
a<-table.start()
a<-table.row.start(a)
a<-table.element(a, 'Multiple Linear Regression - Regression Statistics', 2, TRUE)
a<-table.row.end(a)
a<-table.row.start(a)
a<-table.element(a, 'Multiple R',1,TRUE)
a<-table.element(a, sqrt(mysum$r.squared))
a<-table.row.end(a)
a<-table.row.start(a)
a<-table.element(a, 'R-squared',1,TRUE)
a<-table.element(a, mysum$r.squared)
a<-table.row.end(a)
a<-table.row.start(a)
a<-table.element(a, 'Adjusted R-squared',1,TRUE)
a<-table.element(a, mysum$adj.r.squared)
a<-table.row.end(a)
a<-table.row.start(a)
a<-table.element(a, 'F-TEST (value)',1,TRUE)
a<-table.element(a, mysum$fstatistic[1])
a<-table.row.end(a)
a<-table.row.start(a)
a<-table.element(a, 'F-TEST (DF numerator)',1,TRUE)
a<-table.element(a, mysum$fstatistic[2])
a<-table.row.end(a)
a<-table.row.start(a)
a<-table.element(a, 'F-TEST (DF denominator)',1,TRUE)
a<-table.element(a, mysum$fstatistic[3])
a<-table.row.end(a)
a<-table.row.start(a)
a<-table.element(a, 'p-value',1,TRUE)
a<-table.element(a, 1-pf(mysum$fstatistic[1],mysum$fstatistic[2],mysum$fstatistic[3]))
a<-table.row.end(a)
a<-table.row.start(a)
a<-table.element(a, 'Multiple Linear Regression - Residual Statistics', 2, TRUE)
a<-table.row.end(a)
a<-table.row.start(a)
a<-table.element(a, 'Residual Standard Deviation',1,TRUE)
a<-table.element(a, mysum$sigma)
a<-table.row.end(a)
a<-table.row.start(a)
a<-table.element(a, 'Sum Squared Residuals',1,TRUE)
a<-table.element(a, sum(myerror*myerror))
a<-table.row.end(a)
a<-table.end(a)
table.save(a,file='mytable3.tab')
a<-table.start()
a<-table.row.start(a)
a<-table.element(a, 'Multiple Linear Regression - Actuals, Interpolation, and Residuals', 4, TRUE)
a<-table.row.end(a)
a<-table.row.start(a)
a<-table.element(a, 'Time or Index', 1, TRUE)
a<-table.element(a, 'Actuals', 1, TRUE)
a<-table.element(a, 'Interpolation
Forecast', 1, TRUE)
a<-table.element(a, 'Residuals
Prediction Error', 1, TRUE)
a<-table.row.end(a)
for (i in 1:n) {
a<-table.row.start(a)
a<-table.element(a,i, 1, TRUE)
a<-table.element(a,x[i])
a<-table.element(a,x[i]-mysum$resid[i])
a<-table.element(a,mysum$resid[i])
a<-table.row.end(a)
}
a<-table.end(a)
table.save(a,file='mytable4.tab')
if (n > n25) {
a<-table.start()
a<-table.row.start(a)
a<-table.element(a,'Goldfeld-Quandt test for Heteroskedasticity',4,TRUE)
a<-table.row.end(a)
a<-table.row.start(a)
a<-table.element(a,'p-values',header=TRUE)
a<-table.element(a,'Alternative Hypothesis',3,header=TRUE)
a<-table.row.end(a)
a<-table.row.start(a)
a<-table.element(a,'breakpoint index',header=TRUE)
a<-table.element(a,'greater',header=TRUE)
a<-table.element(a,'2-sided',header=TRUE)
a<-table.element(a,'less',header=TRUE)
a<-table.row.end(a)
for (mypoint in kp3:nmkm3) {
a<-table.row.start(a)
a<-table.element(a,mypoint,header=TRUE)
a<-table.element(a,gqarr[mypoint-kp3+1,1])
a<-table.element(a,gqarr[mypoint-kp3+1,2])
a<-table.element(a,gqarr[mypoint-kp3+1,3])
a<-table.row.end(a)
}
a<-table.end(a)
table.save(a,file='mytable5.tab')
a<-table.start()
a<-table.row.start(a)
a<-table.element(a,'Meta Analysis of Goldfeld-Quandt test for Heteroskedasticity',4,TRUE)
a<-table.row.end(a)
a<-table.row.start(a)
a<-table.element(a,'Description',header=TRUE)
a<-table.element(a,'# significant tests',header=TRUE)
a<-table.element(a,'% significant tests',header=TRUE)
a<-table.element(a,'OK/NOK',header=TRUE)
a<-table.row.end(a)
a<-table.row.start(a)
a<-table.element(a,'1% type I error level',header=TRUE)
a<-table.element(a,numsignificant1)
a<-table.element(a,numsignificant1/numgqtests)
if (numsignificant1/numgqtests < 0.01) dum <- 'OK' else dum <- 'NOK'
a<-table.element(a,dum)
a<-table.row.end(a)
a<-table.row.start(a)
a<-table.element(a,'5% type I error level',header=TRUE)
a<-table.element(a,numsignificant5)
a<-table.element(a,numsignificant5/numgqtests)
if (numsignificant5/numgqtests < 0.05) dum <- 'OK' else dum <- 'NOK'
a<-table.element(a,dum)
a<-table.row.end(a)
a<-table.row.start(a)
a<-table.element(a,'10% type I error level',header=TRUE)
a<-table.element(a,numsignificant10)
a<-table.element(a,numsignificant10/numgqtests)
if (numsignificant10/numgqtests < 0.1) dum <- 'OK' else dum <- 'NOK'
a<-table.element(a,dum)
a<-table.row.end(a)
a<-table.end(a)
table.save(a,file='mytable6.tab')
}