| Multiple Linear Regression - Estimated Regression Equation |
| bbp[t] = -0.568423714957236 + 0.703034602878663dnst[t] -0.162054421760413y1[t] + 0.24411627990024y2[t] + 0.266239270044661y3[t] -0.441380268244024y4[t] -0.171511342104913y5[t] + 0.249939654919237y6[t] + 0.470407740917486y7[t] + 0.0512513482374854M1[t] + 0.0693410526133588M2[t] + 0.490218937204835M3[t] + 0.43220779370504M4[t] + 0.694046045024337M5[t] + 0.506546659846355M6[t] + 0.45487878836219M7[t] + 0.334984425545786M8[t] + 0.315369054290805M9[t] + 0.468922783621777M10[t] + 0.459780509456216M11[t] -0.0053212905716026t + e[t] |
| Multiple Linear Regression - Ordinary Least Squares | |||||
| Variable | Parameter | S.D. | T-STAT H0: parameter = 0 | 2-tail p-value | 1-tail p-value |
| (Intercept) | -0.568423714957236 | 0.503963 | -1.1279 | 0.26682 | 0.13341 |
| dnst | 0.703034602878663 | 0.140534 | 5.0026 | 1.5e-05 | 7e-06 |
| y1 | -0.162054421760413 | 0.122481 | -1.3231 | 0.194144 | 0.097072 |
| y2 | 0.24411627990024 | 0.185397 | 1.3167 | 0.196254 | 0.098127 |
| y3 | 0.266239270044661 | 0.182138 | 1.4617 | 0.152486 | 0.076243 |
| y4 | -0.441380268244024 | 0.181964 | -2.4256 | 0.020422 | 0.010211 |
| y5 | -0.171511342104913 | 0.160095 | -1.0713 | 0.291161 | 0.14558 |
| y6 | 0.249939654919237 | 0.16476 | 1.517 | 0.138001 | 0.069001 |
| y7 | 0.470407740917486 | 0.146134 | 3.219 | 0.002724 | 0.001362 |
| M1 | 0.0512513482374854 | 0.436683 | 0.1174 | 0.907223 | 0.453612 |
| M2 | 0.0693410526133588 | 0.436292 | 0.1589 | 0.87461 | 0.437305 |
| M3 | 0.490218937204835 | 0.447715 | 1.0949 | 0.280817 | 0.140409 |
| M4 | 0.43220779370504 | 0.450169 | 0.9601 | 0.343409 | 0.171704 |
| M5 | 0.694046045024337 | 0.440497 | 1.5756 | 0.123866 | 0.061933 |
| M6 | 0.506546659846355 | 0.446008 | 1.1357 | 0.263572 | 0.131786 |
| M7 | 0.45487878836219 | 0.444369 | 1.0237 | 0.31283 | 0.156415 |
| M8 | 0.334984425545786 | 0.455761 | 0.735 | 0.467101 | 0.23355 |
| M9 | 0.315369054290805 | 0.463585 | 0.6803 | 0.500677 | 0.250338 |
| M10 | 0.468922783621777 | 0.471853 | 0.9938 | 0.326959 | 0.163479 |
| M11 | 0.459780509456216 | 0.450034 | 1.0217 | 0.31376 | 0.15688 |
| t | -0.0053212905716026 | 0.00576 | -0.9239 | 0.361708 | 0.180854 |
| Multiple Linear Regression - Regression Statistics | |
| Multiple R | 0.946118680767614 |
| R-squared | 0.89514055809745 |
| Adjusted R-squared | 0.836885312596034 |
| F-TEST (value) | 15.3658361644993 |
| F-TEST (DF numerator) | 20 |
| F-TEST (DF denominator) | 36 |
| p-value | 4.29933866286092e-12 |
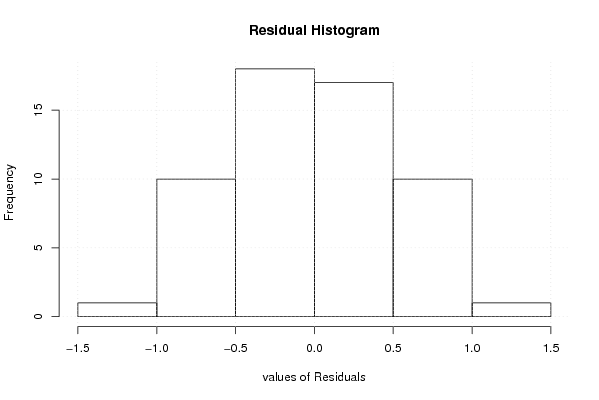
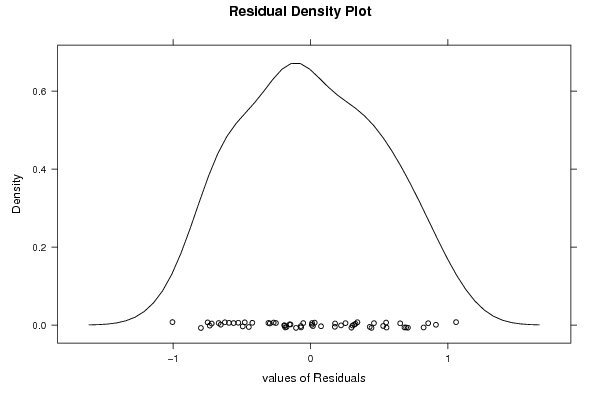
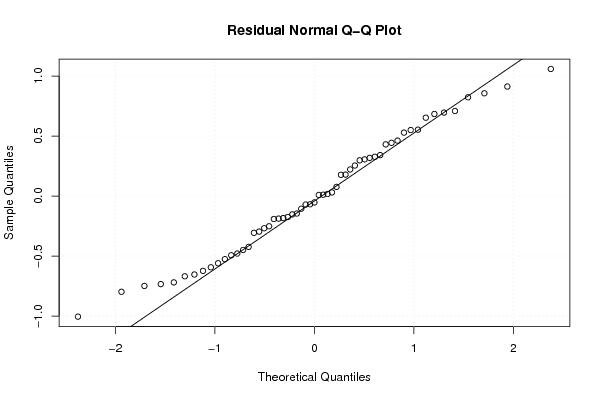
| Multiple Linear Regression - Residual Statistics | |
| Residual Standard Deviation | 0.629787561030837 |
| Sum Squared Residuals | 14.2787653930501 |
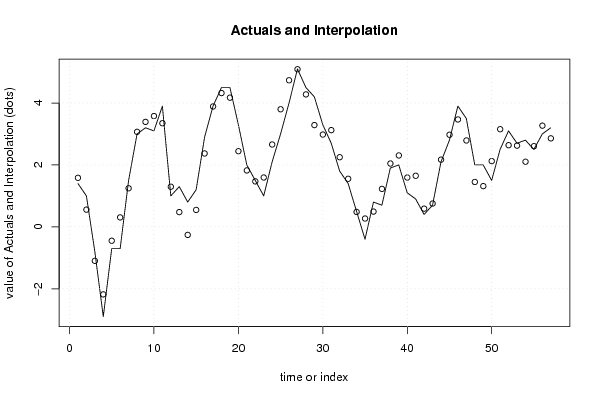
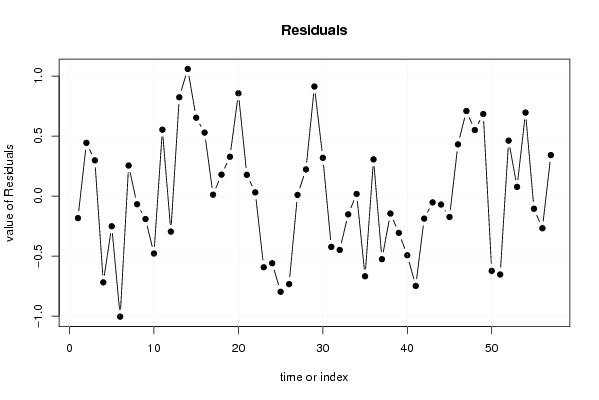
| Multiple Linear Regression - Actuals, Interpolation, and Residuals | |||
| Time or Index | Actuals | Interpolation Forecast | Residuals Prediction Error |
| 1 | 1.4 | 1.58372085057313 | -0.183720850573128 |
| 2 | 1 | 0.556136651497647 | 0.443863348502353 |
| 3 | -0.8 | -1.09780012110651 | 0.297800121106510 |
| 4 | -2.9 | -2.18038317528797 | -0.719616824712032 |
| 5 | -0.7 | -0.448183977912406 | -0.251816022087594 |
| 6 | -0.7 | 0.305378955223529 | -1.00537895522353 |
| 7 | 1.5 | 1.24536329175760 | 0.254636708242399 |
| 8 | 3 | 3.06866232109842 | -0.0686623210984154 |
| 9 | 3.2 | 3.39124670126731 | -0.191246701267307 |
| 10 | 3.1 | 3.57904910649754 | -0.479049106497544 |
| 11 | 3.9 | 3.34650662155314 | 0.553493378446865 |
| 12 | 1 | 1.29615653657522 | -0.296156536575215 |
| 13 | 1.3 | 0.476600602627635 | 0.823399397372365 |
| 14 | 0.8 | -0.259820287935872 | 1.05982028793587 |
| 15 | 1.2 | 0.546651238256318 | 0.653348761743682 |
| 16 | 2.9 | 2.37106004442467 | 0.528939955575333 |
| 17 | 3.9 | 3.88872311264787 | 0.011276887352129 |
| 18 | 4.5 | 4.32131324515223 | 0.178686754847773 |
| 19 | 4.5 | 4.1724793955496 | 0.327520604450401 |
| 20 | 3.3 | 2.44313492333072 | 0.856865076669277 |
| 21 | 2 | 1.82290583569046 | 0.177094164309539 |
| 22 | 1.5 | 1.46953038332518 | 0.0304696166748235 |
| 23 | 1 | 1.59390884001446 | -0.593908840014458 |
| 24 | 2.1 | 2.66018401052539 | -0.560184010525386 |
| 25 | 3 | 3.79805748529943 | -0.798057485299434 |
| 26 | 4 | 4.73420058170684 | -0.734200581706845 |
| 27 | 5.1 | 5.09060958841324 | 0.00939041158676178 |
| 28 | 4.5 | 4.27797220609948 | 0.222027793900522 |
| 29 | 4.2 | 3.28676811975969 | 0.913231880240314 |
| 30 | 3.3 | 2.98152660273428 | 0.318473397265715 |
| 31 | 2.7 | 3.12371071143807 | -0.423710711438068 |
| 32 | 1.8 | 2.24928994409353 | -0.449289944093529 |
| 33 | 1.4 | 1.55259547250106 | -0.152595472501059 |
| 34 | 0.5 | 0.482392740374573 | 0.0176072596254273 |
| 35 | -0.4 | 0.268847632604668 | -0.668847632604668 |
| 36 | 0.8 | 0.494015272261605 | 0.305984727738395 |
| 37 | 0.7 | 1.22591082512252 | -0.525910825122517 |
| 38 | 1.9 | 2.04578396550286 | -0.145783965502861 |
| 39 | 2 | 2.30668376234864 | -0.306683762348638 |
| 40 | 1.1 | 1.59341749893524 | -0.493417498935245 |
| 41 | 0.9 | 1.64923219699979 | -0.74923219699979 |
| 42 | 0.4 | 0.587989156850827 | -0.187989156850827 |
| 43 | 0.7 | 0.75287268616696 | -0.0528726861669602 |
| 44 | 2.1 | 2.17056267134489 | -0.0705626713448856 |
| 45 | 2.8 | 2.97473658811461 | -0.174736588114607 |
| 46 | 3.9 | 3.46902776980271 | 0.430972230197293 |
| 47 | 3.5 | 2.79073690582774 | 0.709263094172262 |
| 48 | 2 | 1.44964418063779 | 0.550355819362207 |
| 49 | 2 | 1.31571023637729 | 0.684289763622714 |
| 50 | 1.5 | 2.12369908922852 | -0.62369908922852 |
| 51 | 2.5 | 3.15385553208832 | -0.653855532088316 |
| 52 | 3.1 | 2.63793342582858 | 0.462066574171422 |
| 53 | 2.7 | 2.62346054850506 | 0.0765394514949404 |
| 54 | 2.8 | 2.10379204003913 | 0.696207959960868 |
| 55 | 2.5 | 2.60557391508777 | -0.105573915087772 |
| 56 | 3 | 3.26835014013245 | -0.268350140132448 |
| 57 | 3.2 | 2.85851540242657 | 0.341484597573434 |
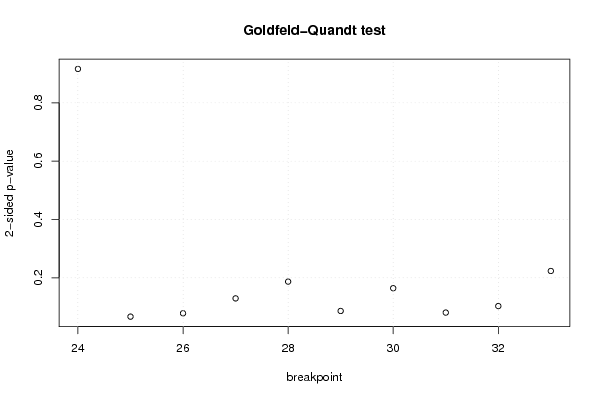
| Goldfeld-Quandt test for Heteroskedasticity | |||
| p-values | Alternative Hypothesis | ||
| breakpoint index | greater | 2-sided | less |
| 24 | 0.458051499002462 | 0.916102998004925 | 0.541948500997538 |
| 25 | 0.966637704370657 | 0.0667245912586859 | 0.0333622956293429 |
| 26 | 0.960857430198235 | 0.078285139603529 | 0.0391425698017645 |
| 27 | 0.935307294159662 | 0.129385411680676 | 0.0646927058403381 |
| 28 | 0.906557666802922 | 0.186884666394156 | 0.0934423331970781 |
| 29 | 0.956885483381481 | 0.0862290332370378 | 0.0431145166185189 |
| 30 | 0.917863486006873 | 0.164273027986254 | 0.0821365139931271 |
| 31 | 0.959665811042659 | 0.0806683779146822 | 0.0403341889573411 |
| 32 | 0.948510500244811 | 0.102978999510378 | 0.0514894997551888 |
| 33 | 0.888336763999453 | 0.223326472001093 | 0.111663236000546 |
| Meta Analysis of Goldfeld-Quandt test for Heteroskedasticity | |||
| Description | # significant tests | % significant tests | OK/NOK |
| 1% type I error level | 0 | 0 | OK |
| 5% type I error level | 0 | 0 | OK |
| 10% type I error level | 4 | 0.4 | NOK |