| Multiple Linear Regression - Estimated Regression Equation |
| werklozen[t] = + 598258.288649425 + 30272.6688218391`crisis `[t] + 38903.9965996168M1[t] + 50321.6527777778M2[t] + 42440.4756226054M3[t] + 21659.5505747127M4[t] + 8242.20675287357M5[t] + 12930.4629310345M6[t] + 16915.1191091954M7[t] + 14656.9752873563M8[t] + 7964.63146551724M9[t] + 5035.88764367817M10[t] -4080.25617816091M11[t] -2039.65617816092t + e[t] |
| Multiple Linear Regression - Ordinary Least Squares | |||||
| Variable | Parameter | S.D. | T-STAT H0: parameter = 0 | 2-tail p-value | 1-tail p-value |
| (Intercept) | 598258.288649425 | 14112.302435 | 42.3927 | 0 | 0 |
| `crisis ` | 30272.6688218391 | 11633.384758 | 2.6022 | 0.012217 | 0.006109 |
| M1 | 38903.9965996168 | 15804.680029 | 2.4615 | 0.017401 | 0.008701 |
| M2 | 50321.6527777778 | 15763.564159 | 3.1923 | 0.002466 | 0.001233 |
| M3 | 42440.4756226054 | 15727.038308 | 2.6986 | 0.009527 | 0.004763 |
| M4 | 21659.5505747127 | 16405.200968 | 1.3203 | 0.192874 | 0.096437 |
| M5 | 8242.20675287357 | 16371.396022 | 0.5035 | 0.616903 | 0.308451 |
| M6 | 12930.4629310345 | 16342.041838 | 0.7912 | 0.432618 | 0.216309 |
| M7 | 16915.1191091954 | 16317.162436 | 1.0366 | 0.30499 | 0.152495 |
| M8 | 14656.9752873563 | 16296.778311 | 0.8994 | 0.37285 | 0.186425 |
| M9 | 7964.63146551724 | 16280.906346 | 0.4892 | 0.626882 | 0.313441 |
| M10 | 5035.88764367817 | 16269.559749 | 0.3095 | 0.758232 | 0.379116 |
| M11 | -4080.25617816091 | 16262.747991 | -0.2509 | 0.802944 | 0.401472 |
| t | -2039.65617816092 | 271.785589 | -7.5047 | 0 | 0 |
| Multiple Linear Regression - Regression Statistics | |
| Multiple R | 0.840177539990154 |
| R-squared | 0.705898298703907 |
| Adjusted R-squared | 0.627871316727393 |
| F-TEST (value) | 9.04684867750464 |
| F-TEST (DF numerator) | 13 |
| F-TEST (DF denominator) | 49 |
| p-value | 4.58399296299206e-09 |
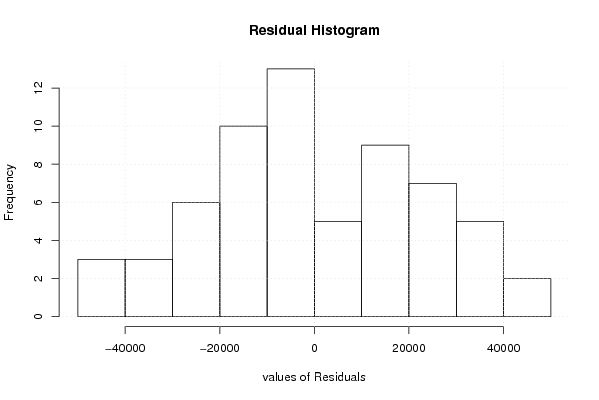
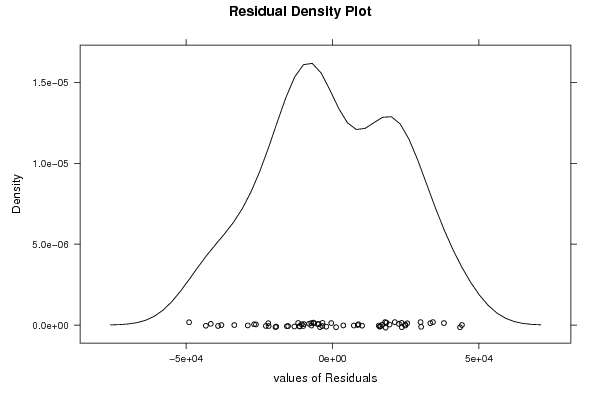
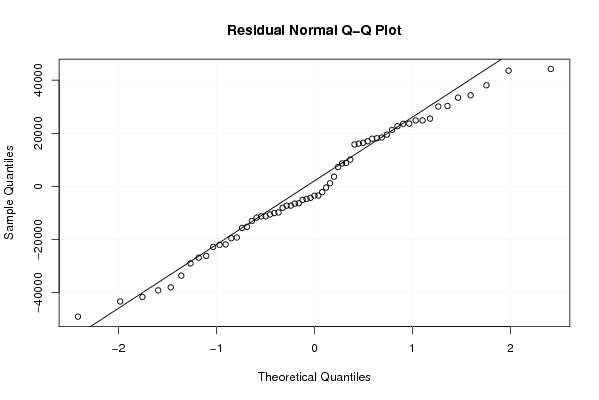
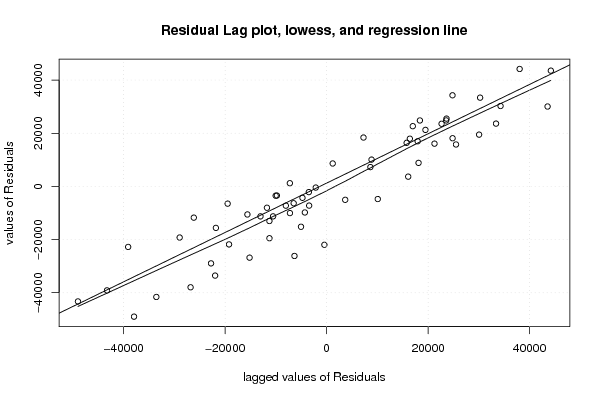
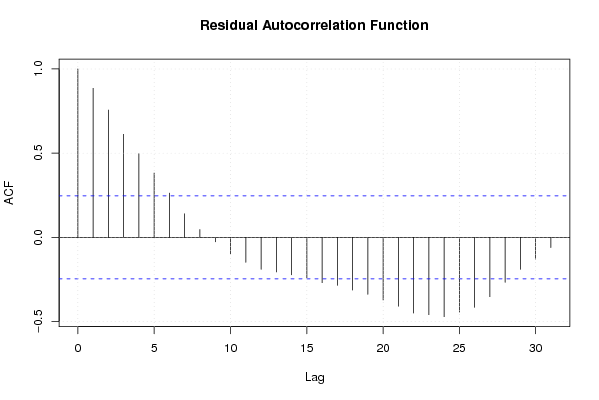
| Multiple Linear Regression - Residual Statistics | |
| Residual Standard Deviation | 25710.0712175971 |
| Sum Squared Residuals | 32389380338.6819 |
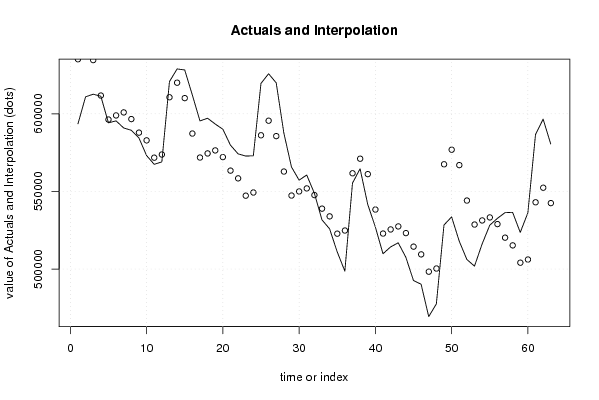
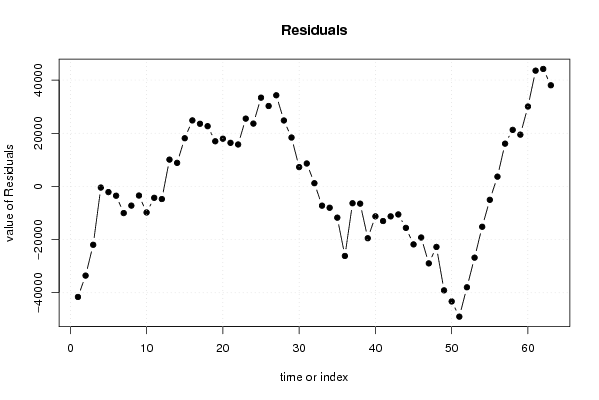
| Multiple Linear Regression - Actuals, Interpolation, and Residuals | |||
| Time or Index | Actuals | Interpolation Forecast | Residuals Prediction Error |
| 1 | 593530 | 635122.629070882 | -41592.6290708817 |
| 2 | 610943 | 644500.629070881 | -33557.6290708812 |
| 3 | 612613 | 634579.795737548 | -21966.7957375479 |
| 4 | 611324 | 611759.214511494 | -435.214511494171 |
| 5 | 594167 | 596302.214511494 | -2135.21451149429 |
| 6 | 595454 | 598950.814511494 | -3496.81451149423 |
| 7 | 590865 | 600895.814511494 | -10030.8145114942 |
| 8 | 589379 | 596598.014511494 | -7219.01451149419 |
| 9 | 584428 | 587866.014511494 | -3438.01451149423 |
| 10 | 573100 | 582897.614511494 | -9797.61451149422 |
| 11 | 567456 | 571741.814511494 | -4285.81451149422 |
| 12 | 569028 | 573782.414511494 | -4754.41451149422 |
| 13 | 620735 | 610646.75493295 | 10088.2450670499 |
| 14 | 628884 | 620024.75493295 | 8859.24506704982 |
| 15 | 628232 | 610103.921599617 | 18128.0784003832 |
| 16 | 612117 | 587283.340373563 | 24833.6596264368 |
| 17 | 595404 | 571826.340373563 | 23577.6596264368 |
| 18 | 597141 | 574474.940373563 | 22666.0596264368 |
| 19 | 593408 | 576419.940373563 | 16988.0596264368 |
| 20 | 590072 | 572122.140373563 | 17949.8596264368 |
| 21 | 579799 | 563390.140373563 | 16408.8596264368 |
| 22 | 574205 | 558421.740373563 | 15783.2596264368 |
| 23 | 572775 | 547265.940373563 | 25509.0596264368 |
| 24 | 572942 | 549306.540373563 | 23635.4596264368 |
| 25 | 619567 | 586170.880795019 | 33396.1192049810 |
| 26 | 625809 | 595548.880795019 | 30260.1192049808 |
| 27 | 619916 | 585628.047461686 | 34287.9525383142 |
| 28 | 587625 | 562807.466235632 | 24817.5337643678 |
| 29 | 565742 | 547350.466235632 | 18391.5337643678 |
| 30 | 557274 | 549999.066235632 | 7274.93376436781 |
| 31 | 560576 | 551944.066235632 | 8631.93376436781 |
| 32 | 548854 | 547646.266235632 | 1207.73376436780 |
| 33 | 531673 | 538914.266235632 | -7241.26623563219 |
| 34 | 525919 | 533945.866235632 | -8026.86623563218 |
| 35 | 511038 | 522790.066235632 | -11752.0662356322 |
| 36 | 498662 | 524830.666235632 | -26168.6662356322 |
| 37 | 555362 | 561695.006657088 | -6333.00665708804 |
| 38 | 564591 | 571073.006657088 | -6482.00665708814 |
| 39 | 541657 | 561152.173323755 | -19495.1733237548 |
| 40 | 527070 | 538331.592097701 | -11261.5920977012 |
| 41 | 509846 | 522874.592097701 | -13028.5920977012 |
| 42 | 514258 | 525523.192097701 | -11265.1920977012 |
| 43 | 516922 | 527468.192097701 | -10546.1920977012 |
| 44 | 507561 | 523170.392097701 | -15609.3920977012 |
| 45 | 492622 | 514438.392097701 | -21816.3920977012 |
| 46 | 490243 | 509469.992097701 | -19226.9920977012 |
| 47 | 469357 | 498314.192097701 | -28957.1920977012 |
| 48 | 477580 | 500354.792097701 | -22774.7920977012 |
| 49 | 528379 | 567491.801340996 | -39112.8013409961 |
| 50 | 533590 | 576869.801340996 | -43279.8013409962 |
| 51 | 517945 | 566948.968007663 | -49003.9680076628 |
| 52 | 506174 | 544128.386781609 | -37954.3867816092 |
| 53 | 501866 | 528671.386781609 | -26805.3867816092 |
| 54 | 516141 | 531319.986781609 | -15178.9867816092 |
| 55 | 528222 | 533264.986781609 | -5042.98678160921 |
| 56 | 532638 | 528967.186781609 | 3670.81321839078 |
| 57 | 536322 | 520235.186781609 | 16086.8132183908 |
| 58 | 536535 | 515266.786781609 | 21268.2132183908 |
| 59 | 523597 | 504110.986781609 | 19486.0132183908 |
| 60 | 536214 | 506151.586781609 | 30062.4132183908 |
| 61 | 586570 | 543015.927203065 | 43554.0727969349 |
| 62 | 596594 | 552393.927203065 | 44200.0727969349 |
| 63 | 580523 | 542473.093869732 | 38049.9061302682 |
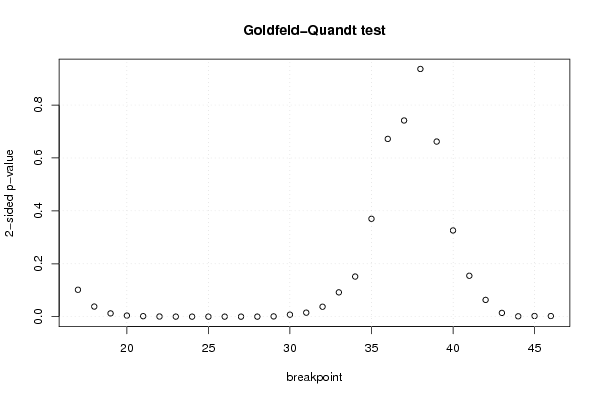
| Goldfeld-Quandt test for Heteroskedasticity | |||
| p-values | Alternative Hypothesis | ||
| breakpoint index | greater | 2-sided | less |
| 17 | 0.0507963836723774 | 0.101592767344755 | 0.949203616327623 |
| 18 | 0.0190547850049731 | 0.0381095700099462 | 0.980945214995027 |
| 19 | 0.00616048110580751 | 0.012320962211615 | 0.993839518894192 |
| 20 | 0.00202004007741811 | 0.00404008015483623 | 0.997979959922582 |
| 21 | 0.000891940292714654 | 0.00178388058542931 | 0.999108059707285 |
| 22 | 0.000246333993625878 | 0.000492667987251756 | 0.999753666006374 |
| 23 | 6.01413529265318e-05 | 0.000120282705853064 | 0.999939858647073 |
| 24 | 1.43100509070488e-05 | 2.86201018140975e-05 | 0.999985689949093 |
| 25 | 3.757602724711e-06 | 7.515205449422e-06 | 0.999996242397275 |
| 26 | 1.04691275238879e-06 | 2.09382550477758e-06 | 0.999998953087248 |
| 27 | 7.487340439449e-07 | 1.4974680878898e-06 | 0.999999251265956 |
| 28 | 4.34382450855794e-05 | 8.68764901711589e-05 | 0.999956561754914 |
| 29 | 0.000494796282451648 | 0.000989592564903295 | 0.999505203717548 |
| 30 | 0.00374114367050629 | 0.00748228734101257 | 0.996258856329494 |
| 31 | 0.00755413335107595 | 0.0151082667021519 | 0.992445866648924 |
| 32 | 0.0187625262546131 | 0.0375250525092262 | 0.981237473745387 |
| 33 | 0.0459269741645197 | 0.0918539483290393 | 0.95407302583548 |
| 34 | 0.0757942339813164 | 0.151588467962633 | 0.924205766018684 |
| 35 | 0.185001154602748 | 0.370002309205497 | 0.814998845397252 |
| 36 | 0.336041509750715 | 0.672083019501429 | 0.663958490249285 |
| 37 | 0.370898731594228 | 0.741797463188457 | 0.629101268405772 |
| 38 | 0.468319065031701 | 0.936638130063401 | 0.531680934968299 |
| 39 | 0.66896947306812 | 0.662061053863759 | 0.331030526931880 |
| 40 | 0.837016529177981 | 0.325966941644038 | 0.162983470822019 |
| 41 | 0.92269245275774 | 0.154615094484520 | 0.0773075472422602 |
| 42 | 0.968335376971356 | 0.0633292460572885 | 0.0316646230286442 |
| 43 | 0.992919535065931 | 0.0141609298681374 | 0.00708046493406868 |
| 44 | 0.99933442908733 | 0.00133114182533970 | 0.000665570912669852 |
| 45 | 0.998725583586919 | 0.00254883282616261 | 0.00127441641308131 |
| 46 | 0.99885953878881 | 0.00228092242237711 | 0.00114046121118855 |
| Meta Analysis of Goldfeld-Quandt test for Heteroskedasticity | |||
| Description | # significant tests | % significant tests | OK/NOK |
| 1% type I error level | 14 | 0.466666666666667 | NOK |
| 5% type I error level | 19 | 0.633333333333333 | NOK |
| 10% type I error level | 21 | 0.7 | NOK |