| Multiple Linear Regression - Estimated Regression Equation |
| Consvertr[t] = + 2.73170303613635 + 0.00637395336616299Aand[t] -0.190088819280827t + e[t] |
| Multiple Linear Regression - Ordinary Least Squares | |||||
| Variable | Parameter | S.D. | T-STAT H0: parameter = 0 | 2-tail p-value | 1-tail p-value |
| (Intercept) | 2.73170303613635 | 1.89563 | 1.4411 | 0.154947 | 0.077474 |
| Aand | 0.00637395336616299 | 0.000513 | 12.4272 | 0 | 0 |
| t | -0.190088819280827 | 0.023593 | -8.0571 | 0 | 0 |
| Multiple Linear Regression - Regression Statistics | |
| Multiple R | 0.885297448485684 |
| R-squared | 0.783751572295263 |
| Adjusted R-squared | 0.776294729960617 |
| F-TEST (value) | 105.105021284114 |
| F-TEST (DF numerator) | 2 |
| F-TEST (DF denominator) | 58 |
| p-value | 0 |
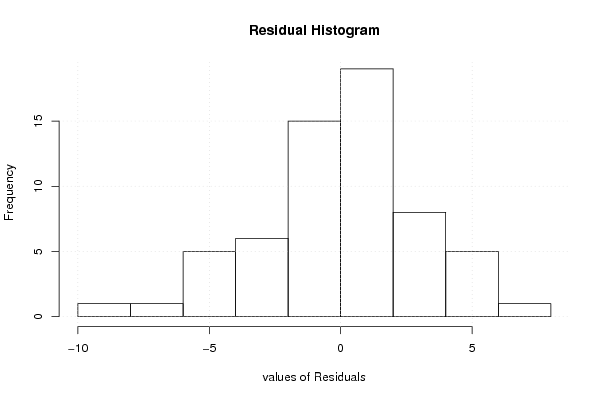
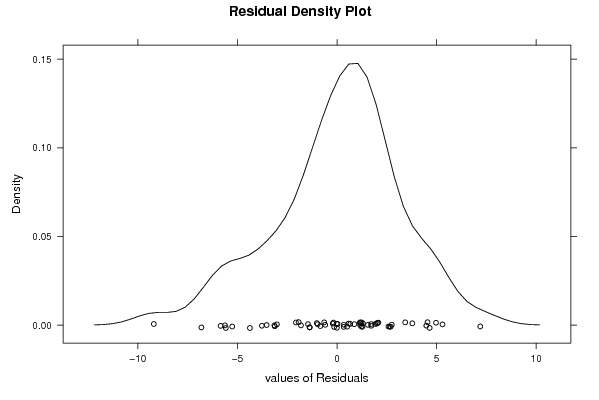
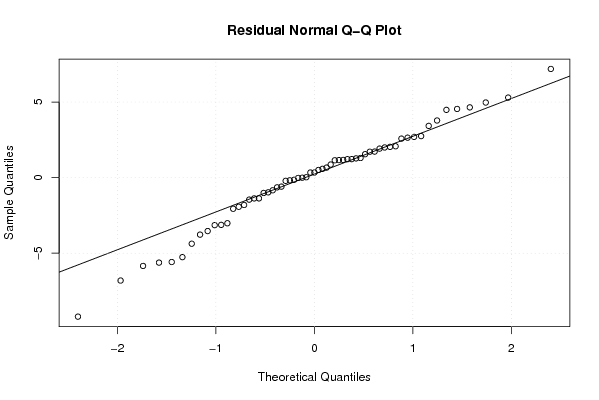
| Multiple Linear Regression - Residual Statistics | |
| Residual Standard Deviation | 3.24057281102741 |
| Sum Squared Residuals | 609.076104327064 |
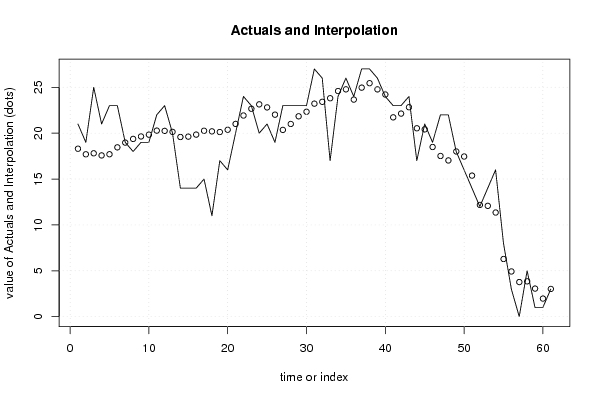
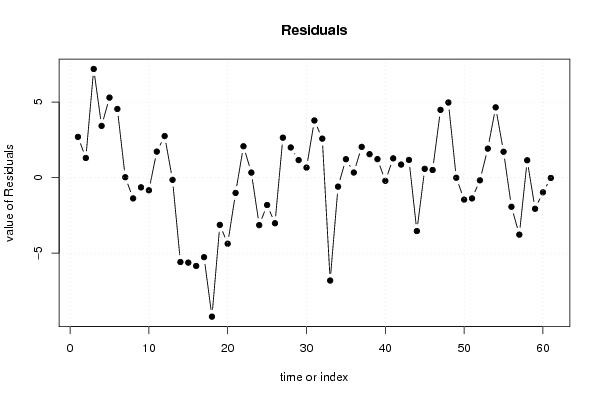
| Multiple Linear Regression - Actuals, Interpolation, and Residuals | |||
| Time or Index | Actuals | Interpolation Forecast | Residuals Prediction Error |
| 1 | 21 | 18.3031898402370 | 2.69681015976295 |
| 2 | 19 | 17.6974555219487 | 1.30254447805129 |
| 3 | 25 | 17.8070699899449 | 7.19293001005515 |
| 4 | 21 | 17.5751042970483 | 3.42489570295165 |
| 5 | 23 | 17.7023746158688 | 5.29762538413122 |
| 6 | 23 | 18.4543561041068 | 4.54564389589316 |
| 7 | 19 | 18.9725409828740 | 0.0274590171259583 |
| 8 | 18 | 19.3721065894970 | -1.37210658949695 |
| 9 | 19 | 19.6420259846521 | -0.642025984652107 |
| 10 | 19 | 19.8369876882212 | -0.836987688221185 |
| 11 | 22 | 20.2761992847816 | 1.72380071521837 |
| 12 | 23 | 20.2495386298092 | 2.75046137019078 |
| 13 | 20 | 20.1428848600915 | -0.142884860091468 |
| 14 | 14 | 19.5827880479049 | -5.58278804790488 |
| 15 | 14 | 19.6224802474742 | -5.62248024747423 |
| 16 | 14 | 19.8427465459070 | -5.84274654590697 |
| 17 | 15 | 20.2611790544937 | -5.26117905449373 |
| 18 | 11 | 20.1976132095312 | -9.19761320953123 |
| 19 | 17 | 20.1242314763849 | -3.12423147638485 |
| 20 | 16 | 20.3718420347584 | -4.37184203475844 |
| 21 | 20 | 21.0115144646847 | -1.01151446468471 |
| 22 | 24 | 21.9232272242788 | 2.07677277572118 |
| 23 | 23 | 22.6639268150588 | 0.336073184941232 |
| 24 | 20 | 23.1424657038884 | -3.14246570388844 |
| 25 | 21 | 22.8092816315373 | -1.80928163153725 |
| 26 | 19 | 22.0171729168223 | -3.01717291682233 |
| 27 | 23 | 20.3550833071598 | 2.64491669284018 |
| 28 | 23 | 21.0031056159958 | 1.99689438400423 |
| 29 | 23 | 21.8370561445227 | 1.16294385547731 |
| 30 | 23 | 22.3342707167152 | 0.665729283284787 |
| 31 | 27 | 23.2176831233636 | 3.78231687663644 |
| 32 | 26 | 23.4178714686929 | 2.58212853130711 |
| 33 | 17 | 23.8087047592042 | -6.80870475920416 |
| 34 | 24 | 24.5939582840136 | -0.59395828401359 |
| 35 | 26 | 24.7782117459275 | 1.22178825407248 |
| 36 | 24 | 23.6596928793314 | 0.340307120668616 |
| 37 | 27 | 24.9629575942089 | 2.03704240579111 |
| 38 | 27 | 25.4465319061978 | 1.55346809380217 |
| 39 | 26 | 24.7748271705697 | 1.22517282943028 |
| 40 | 24 | 24.2114796421664 | -0.211479642166392 |
| 41 | 23 | 21.7247279459897 | 1.27527205401028 |
| 42 | 23 | 22.1335995245272 | 0.866400475472777 |
| 43 | 24 | 22.8278329952678 | 1.17216700473215 |
| 44 | 17 | 20.5340208674849 | -3.53402086748493 |
| 45 | 21 | 20.417232511915 | 0.582767488085021 |
| 46 | 19 | 18.4922173258982 | 0.507782674101756 |
| 47 | 22 | 17.5148815263626 | 4.48511847363737 |
| 48 | 22 | 17.0278939592859 | 4.97210604071407 |
| 49 | 18 | 18.0056408757535 | -0.00564087575348349 |
| 50 | 16 | 17.4550412540825 | -1.45504125408248 |
| 51 | 14 | 15.3738642105948 | -1.37386421059475 |
| 52 | 12 | 12.1767354117592 | -0.176735411759213 |
| 53 | 14 | 12.0786227395521 | 1.92137726044788 |
| 54 | 16 | 11.3487238096909 | 4.65127619030905 |
| 55 | 8 | 6.2856201629112 | 1.71437983708881 |
| 56 | 3 | 4.92673951487706 | -1.92673951487706 |
| 57 | 0 | 3.7702318862186 | -3.7702318862186 |
| 58 | 5 | 3.85154600126899 | 1.14845399873101 |
| 59 | 1 | 3.05962850515506 | -2.05962850515506 |
| 60 | 1 | 1.97132217751454 | -0.97132217751454 |
| 61 | 3 | 3.02013867401481 | -0.0201386740148131 |
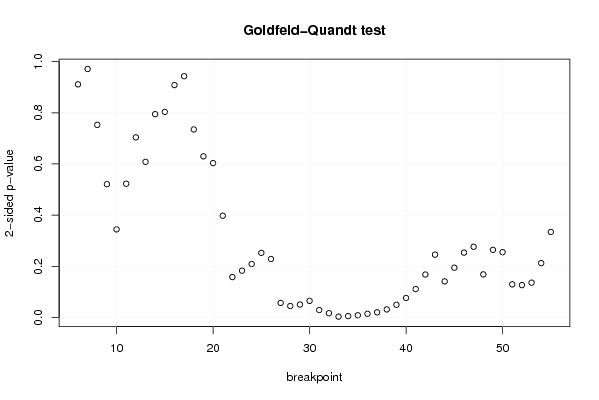
| Goldfeld-Quandt test for Heteroskedasticity | |||
| p-values | Alternative Hypothesis | ||
| breakpoint index | greater | 2-sided | less |
| 6 | 0.455478779237516 | 0.910957558475032 | 0.544521220762484 |
| 7 | 0.485626431096738 | 0.971252862193476 | 0.514373568903262 |
| 8 | 0.376440063913408 | 0.752880127826817 | 0.623559936086592 |
| 9 | 0.260417119201056 | 0.520834238402112 | 0.739582880798944 |
| 10 | 0.172178570066617 | 0.344357140133233 | 0.827821429933383 |
| 11 | 0.261369691646148 | 0.522739383292297 | 0.738630308353852 |
| 12 | 0.352007986835993 | 0.704015973671987 | 0.647992013164007 |
| 13 | 0.304159081663245 | 0.608318163326489 | 0.695840918336756 |
| 14 | 0.602717203396292 | 0.794565593207415 | 0.397282796603708 |
| 15 | 0.598289554334765 | 0.80342089133047 | 0.401710445665235 |
| 16 | 0.545967573630398 | 0.908064852739204 | 0.454032426369602 |
| 17 | 0.471408999663114 | 0.942817999326227 | 0.528591000336886 |
| 18 | 0.632602004193664 | 0.734795991612673 | 0.367397995806336 |
| 19 | 0.685136866718399 | 0.629726266563202 | 0.314863133281601 |
| 20 | 0.698301953253656 | 0.603396093492688 | 0.301698046746344 |
| 21 | 0.801192185109193 | 0.397615629781615 | 0.198807814890808 |
| 22 | 0.921052894488658 | 0.157894211022684 | 0.078947105511342 |
| 23 | 0.908503523840487 | 0.182992952319025 | 0.0914964761595126 |
| 24 | 0.895495881875126 | 0.209008236249749 | 0.104504118124874 |
| 25 | 0.873649204765375 | 0.252701590469249 | 0.126350795234625 |
| 26 | 0.885701021524903 | 0.228597956950193 | 0.114298978475097 |
| 27 | 0.971516162104481 | 0.056967675791037 | 0.0284838378955185 |
| 28 | 0.977563819397473 | 0.0448723612050531 | 0.0224361806025265 |
| 29 | 0.974638828956385 | 0.05072234208723 | 0.025361171043615 |
| 30 | 0.967582366928053 | 0.0648352661438942 | 0.0324176330719471 |
| 31 | 0.985440264451248 | 0.0291194710975044 | 0.0145597355487522 |
| 32 | 0.991591896095851 | 0.0168162078082976 | 0.00840810390414882 |
| 33 | 0.998372075927885 | 0.00325584814423085 | 0.00162792407211542 |
| 34 | 0.997272591163706 | 0.00545481767258742 | 0.00272740883629371 |
| 35 | 0.995728428550184 | 0.00854314289963143 | 0.00427157144981571 |
| 36 | 0.99277301680974 | 0.0144539663805196 | 0.00722698319025982 |
| 37 | 0.989905739239504 | 0.0201885215209911 | 0.0100942607604956 |
| 38 | 0.984250360517767 | 0.0314992789644654 | 0.0157496394822327 |
| 39 | 0.975177446943094 | 0.0496451061138111 | 0.0248225530569055 |
| 40 | 0.96192766540098 | 0.0761446691980401 | 0.0380723345990200 |
| 41 | 0.944462660513401 | 0.111074678973197 | 0.0555373394865986 |
| 42 | 0.916074101135524 | 0.167851797728953 | 0.0839258988644763 |
| 43 | 0.877241732235747 | 0.245516535528505 | 0.122758267764253 |
| 44 | 0.92941649839219 | 0.141167003215620 | 0.0705835016078101 |
| 45 | 0.902750341422409 | 0.194499317155181 | 0.0972496585775907 |
| 46 | 0.873284877907532 | 0.253430244184935 | 0.126715122092468 |
| 47 | 0.861789177484656 | 0.276421645030688 | 0.138210822515344 |
| 48 | 0.915773151041255 | 0.16845369791749 | 0.084226848958745 |
| 49 | 0.867817576579756 | 0.264364846840488 | 0.132182423420244 |
| 50 | 0.87240259624574 | 0.255194807508519 | 0.127597403754260 |
| 51 | 0.935311958043336 | 0.129376083913329 | 0.0646880419566645 |
| 52 | 0.936752597451172 | 0.126494805097656 | 0.0632474025488278 |
| 53 | 0.932016055514294 | 0.135967888971411 | 0.0679839444857057 |
| 54 | 0.89378906063738 | 0.212421878725240 | 0.106210939362620 |
| 55 | 0.832875439212906 | 0.334249121574188 | 0.167124560787094 |
| Meta Analysis of Goldfeld-Quandt test for Heteroskedasticity | |||
| Description | # significant tests | % significant tests | OK/NOK |
| 1% type I error level | 3 | 0.06 | NOK |
| 5% type I error level | 10 | 0.2 | NOK |
| 10% type I error level | 14 | 0.28 | NOK |