| Multiple Linear Regression - Estimated Regression Equation |
| Y[t] = + 20.55 -1.39000000000000X[t] + e[t] |
| Multiple Linear Regression - Ordinary Least Squares | |||||
| Variable | Parameter | S.D. | T-STAT H0: parameter = 0 | 2-tail p-value | 1-tail p-value |
| (Intercept) | 20.55 | 0.390561 | 52.6166 | 0 | 0 |
| X | -1.39000000000000 | 0.676472 | -2.0548 | 0.044414 | 0.022207 |
| Multiple Linear Regression - Regression Statistics | |
| Multiple R | 0.260491074856844 |
| R-squared | 0.0678556000800737 |
| Adjusted R-squared | 0.0517841449090405 |
| F-TEST (value) | 4.22211923923198 |
| F-TEST (DF numerator) | 1 |
| F-TEST (DF denominator) | 58 |
| p-value | 0.0444142895959601 |
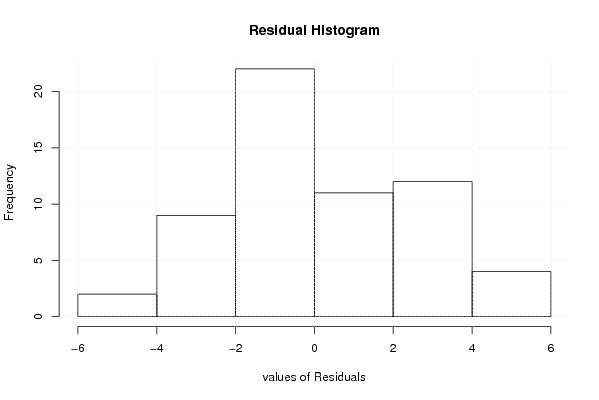
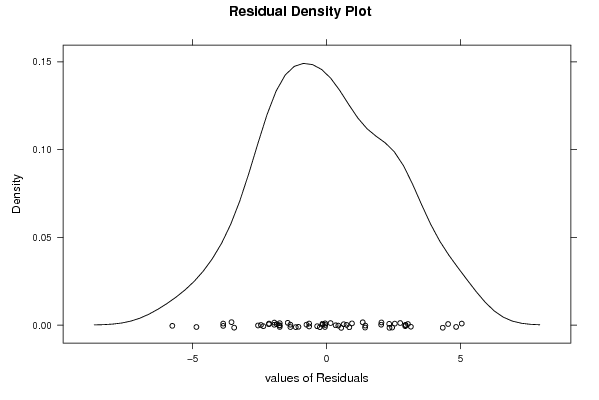
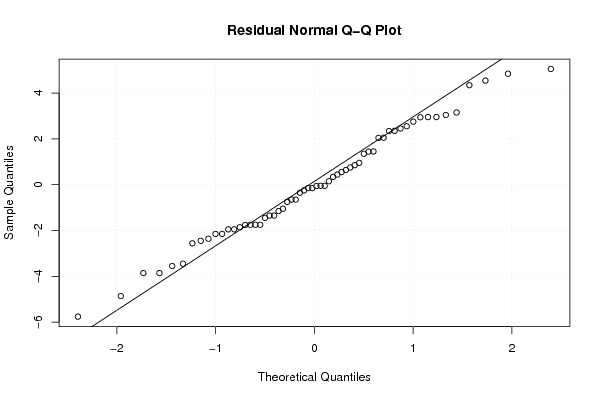
| Multiple Linear Regression - Residual Statistics | |
| Residual Standard Deviation | 2.47012494448749 |
| Sum Squared Residuals | 353.888000000001 |
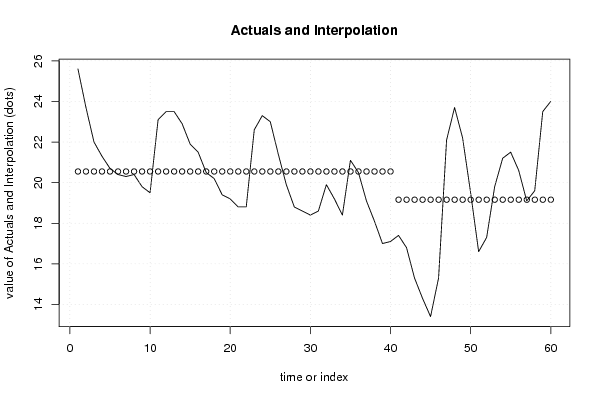
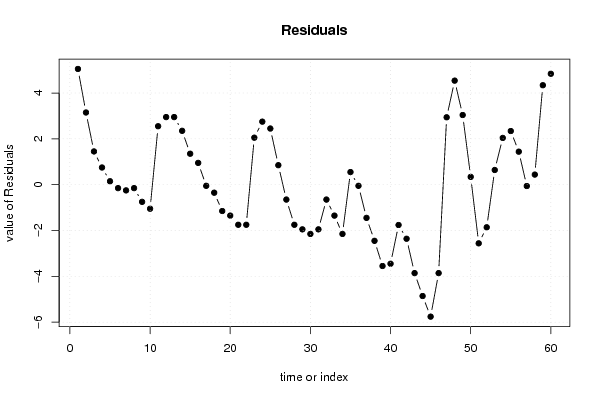
| Multiple Linear Regression - Actuals, Interpolation, and Residuals | |||
| Time or Index | Actuals | Interpolation Forecast | Residuals Prediction Error |
| 1 | 25.6 | 20.5499999999999 | 5.05000000000007 |
| 2 | 23.7 | 20.55 | 3.15000000000000 |
| 3 | 22 | 20.55 | 1.45 |
| 4 | 21.3 | 20.55 | 0.75 |
| 5 | 20.7 | 20.55 | 0.149999999999998 |
| 6 | 20.4 | 20.55 | -0.150000000000003 |
| 7 | 20.3 | 20.55 | -0.250000000000001 |
| 8 | 20.4 | 20.55 | -0.150000000000003 |
| 9 | 19.8 | 20.55 | -0.750000000000001 |
| 10 | 19.5 | 20.55 | -1.05000000000000 |
| 11 | 23.1 | 20.55 | 2.55 |
| 12 | 23.5 | 20.55 | 2.95 |
| 13 | 23.5 | 20.55 | 2.95 |
| 14 | 22.9 | 20.55 | 2.35000000000000 |
| 15 | 21.9 | 20.55 | 1.35000000000000 |
| 16 | 21.5 | 20.55 | 0.949999999999999 |
| 17 | 20.5 | 20.55 | -0.0500000000000013 |
| 18 | 20.2 | 20.55 | -0.350000000000002 |
| 19 | 19.4 | 20.55 | -1.15000000000000 |
| 20 | 19.2 | 20.55 | -1.35000000000000 |
| 21 | 18.8 | 20.55 | -1.75 |
| 22 | 18.8 | 20.55 | -1.75 |
| 23 | 22.6 | 20.55 | 2.05 |
| 24 | 23.3 | 20.55 | 2.75 |
| 25 | 23 | 20.55 | 2.45 |
| 26 | 21.4 | 20.55 | 0.849999999999997 |
| 27 | 19.9 | 20.55 | -0.650000000000003 |
| 28 | 18.8 | 20.55 | -1.75 |
| 29 | 18.6 | 20.55 | -1.95 |
| 30 | 18.4 | 20.55 | -2.15000000000000 |
| 31 | 18.6 | 20.55 | -1.95 |
| 32 | 19.9 | 20.55 | -0.650000000000003 |
| 33 | 19.2 | 20.55 | -1.35000000000000 |
| 34 | 18.4 | 20.55 | -2.15000000000000 |
| 35 | 21.1 | 20.55 | 0.55 |
| 36 | 20.5 | 20.55 | -0.0500000000000013 |
| 37 | 19.1 | 20.55 | -1.45 |
| 38 | 18.1 | 20.55 | -2.45 |
| 39 | 17 | 20.55 | -3.55 |
| 40 | 17.1 | 20.55 | -3.45 |
| 41 | 17.4 | 19.16 | -1.76 |
| 42 | 16.8 | 19.16 | -2.36 |
| 43 | 15.3 | 19.16 | -3.86 |
| 44 | 14.3 | 19.16 | -4.86 |
| 45 | 13.4 | 19.16 | -5.76 |
| 46 | 15.3 | 19.16 | -3.86 |
| 47 | 22.1 | 19.16 | 2.94 |
| 48 | 23.7 | 19.16 | 4.54 |
| 49 | 22.2 | 19.16 | 3.04 |
| 50 | 19.5 | 19.16 | 0.34 |
| 51 | 16.6 | 19.16 | -2.56 |
| 52 | 17.3 | 19.16 | -1.86 |
| 53 | 19.8 | 19.16 | 0.640000000000001 |
| 54 | 21.2 | 19.16 | 2.04 |
| 55 | 21.5 | 19.16 | 2.34 |
| 56 | 20.6 | 19.16 | 1.44 |
| 57 | 19.1 | 19.16 | -0.0599999999999986 |
| 58 | 19.6 | 19.16 | 0.440000000000001 |
| 59 | 23.5 | 19.16 | 4.34 |
| 60 | 24 | 19.16 | 4.84 |
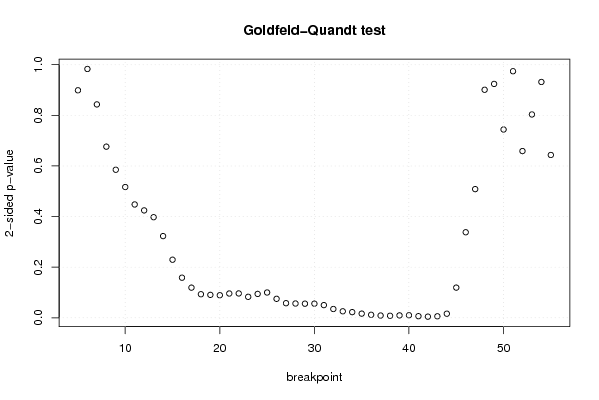
| Goldfeld-Quandt test for Heteroskedasticity | |||
| p-values | Alternative Hypothesis | ||
| breakpoint index | greater | 2-sided | less |
| 5 | 0.550550632381411 | 0.898898735237178 | 0.449449367618589 |
| 6 | 0.491620940680111 | 0.983241881360223 | 0.508379059319889 |
| 7 | 0.421563703990961 | 0.843127407981922 | 0.578436296009039 |
| 8 | 0.338095116792878 | 0.676190233585756 | 0.661904883207122 |
| 9 | 0.292452149325845 | 0.584904298651691 | 0.707547850674155 |
| 10 | 0.258312812959611 | 0.516625625919222 | 0.741687187040389 |
| 11 | 0.223896359803290 | 0.447792719606579 | 0.77610364019671 |
| 12 | 0.212176531785646 | 0.424353063571293 | 0.787823468214354 |
| 13 | 0.198704602402846 | 0.397409204805692 | 0.801295397597154 |
| 14 | 0.161409928663144 | 0.322819857326288 | 0.838590071336856 |
| 15 | 0.114728768661619 | 0.229457537323239 | 0.88527123133838 |
| 16 | 0.0791835762820856 | 0.158367152564171 | 0.920816423717914 |
| 17 | 0.0595269909251739 | 0.119053981850348 | 0.940473009074826 |
| 18 | 0.0465307419901775 | 0.093061483980355 | 0.953469258009823 |
| 19 | 0.0452655481762238 | 0.0905310963524476 | 0.954734451823776 |
| 20 | 0.0445515897626246 | 0.0891031795252492 | 0.955448410237375 |
| 21 | 0.0479450681879375 | 0.095890136375875 | 0.952054931812063 |
| 22 | 0.0481020465801534 | 0.0962040931603068 | 0.951897953419847 |
| 23 | 0.0414400864009375 | 0.082880172801875 | 0.958559913599063 |
| 24 | 0.0471646418739981 | 0.0943292837479962 | 0.952835358126002 |
| 25 | 0.049961099366754 | 0.099922198733508 | 0.950038900633246 |
| 26 | 0.0374834853387862 | 0.0749669706775724 | 0.962516514661214 |
| 27 | 0.0288370432068362 | 0.0576740864136725 | 0.971162956793164 |
| 28 | 0.0281538593374076 | 0.0563077186748152 | 0.971846140662592 |
| 29 | 0.0278412607745475 | 0.055682521549095 | 0.972158739225452 |
| 30 | 0.0278946715343626 | 0.0557893430687253 | 0.972105328465637 |
| 31 | 0.0250316803488206 | 0.0500633606976412 | 0.97496831965118 |
| 32 | 0.0173594603777824 | 0.0347189207555648 | 0.982640539622218 |
| 33 | 0.0128255145434331 | 0.0256510290868662 | 0.987174485456567 |
| 34 | 0.0111658967202548 | 0.0223317934405095 | 0.988834103279745 |
| 35 | 0.00821084239954392 | 0.0164216847990878 | 0.991789157600456 |
| 36 | 0.00591375112570793 | 0.0118275022514159 | 0.994086248874292 |
| 37 | 0.00441207589121028 | 0.00882415178242056 | 0.99558792410879 |
| 38 | 0.0039460390483017 | 0.0078920780966034 | 0.996053960951698 |
| 39 | 0.00476291986913538 | 0.00952583973827076 | 0.995237080130865 |
| 40 | 0.00499077360163284 | 0.00998154720326568 | 0.995009226398367 |
| 41 | 0.00314931753327100 | 0.00629863506654200 | 0.996850682466729 |
| 42 | 0.00223319956213706 | 0.00446639912427413 | 0.997766800437863 |
| 43 | 0.00292795963116611 | 0.00585591926233222 | 0.997072040368834 |
| 44 | 0.00804358708321273 | 0.0160871741664255 | 0.991956412916787 |
| 45 | 0.0596046389833684 | 0.119209277966737 | 0.940395361016632 |
| 46 | 0.168980876766466 | 0.337961753532932 | 0.831019123233534 |
| 47 | 0.254201242860869 | 0.508402485721739 | 0.74579875713913 |
| 48 | 0.450509480745305 | 0.90101896149061 | 0.549490519254695 |
| 49 | 0.462015214637105 | 0.92403042927421 | 0.537984785362895 |
| 50 | 0.37198205049435 | 0.7439641009887 | 0.62801794950565 |
| 51 | 0.512891016395464 | 0.974217967209071 | 0.487108983604536 |
| 52 | 0.670607159440637 | 0.658785681118727 | 0.329392840559363 |
| 53 | 0.598276887041172 | 0.803446225917656 | 0.401723112958828 |
| 54 | 0.465940098504739 | 0.931880197009479 | 0.534059901495261 |
| 55 | 0.321629164976322 | 0.643258329952645 | 0.678370835023678 |
| Meta Analysis of Goldfeld-Quandt test for Heteroskedasticity | |||
| Description | # significant tests | % significant tests | OK/NOK |
| 1% type I error level | 7 | 0.137254901960784 | NOK |
| 5% type I error level | 13 | 0.254901960784314 | NOK |
| 10% type I error level | 27 | 0.529411764705882 | NOK |