| Multiple Linear Regression - Estimated Regression Equation |
| Y[t] = + 53.7889795918367 -17.1816326530612X[t] -0.0814965986394639M1[t] + 1.06367346938775M2[t] + 0.563673469387756M3[t] + 0.0836734693877571M4[t] -0.396326530612249M5[t] -0.656326530612247M6[t] + 2.60000000000000M7[t] + 2.12M8[t] + 1.56000000000000M9[t] + 1.06000000000000M10[t] + 0.559999999999999M11[t] + e[t] |
| Multiple Linear Regression - Ordinary Least Squares | |||||
| Variable | Parameter | S.D. | T-STAT H0: parameter = 0 | 2-tail p-value | 1-tail p-value |
| (Intercept) | 53.7889795918367 | 2.875464 | 18.7062 | 0 | 0 |
| X | -17.1816326530612 | 1.582891 | -10.8546 | 0 | 0 |
| M1 | -0.0814965986394639 | 3.678306 | -0.0222 | 0.982415 | 0.491208 |
| M2 | 1.06367346938775 | 3.85134 | 0.2762 | 0.783593 | 0.391797 |
| M3 | 0.563673469387756 | 3.85134 | 0.1464 | 0.884252 | 0.442126 |
| M4 | 0.0836734693877571 | 3.85134 | 0.0217 | 0.982757 | 0.491378 |
| M5 | -0.396326530612249 | 3.85134 | -0.1029 | 0.918466 | 0.459233 |
| M6 | -0.656326530612247 | 3.85134 | -0.1704 | 0.8654 | 0.4327 |
| M7 | 2.60000000000000 | 3.838306 | 0.6774 | 0.501416 | 0.250708 |
| M8 | 2.12 | 3.838306 | 0.5523 | 0.583287 | 0.291644 |
| M9 | 1.56000000000000 | 3.838306 | 0.4064 | 0.686234 | 0.343117 |
| M10 | 1.06000000000000 | 3.838306 | 0.2762 | 0.783608 | 0.391804 |
| M11 | 0.559999999999999 | 3.838306 | 0.1459 | 0.884613 | 0.442307 |
| Multiple Linear Regression - Regression Statistics | |
| Multiple R | 0.845833695305805 |
| R-squared | 0.715434640114673 |
| Adjusted R-squared | 0.644293300143341 |
| F-TEST (value) | 10.0565246648851 |
| F-TEST (DF numerator) | 12 |
| F-TEST (DF denominator) | 48 |
| p-value | 1.91935778381946e-09 |
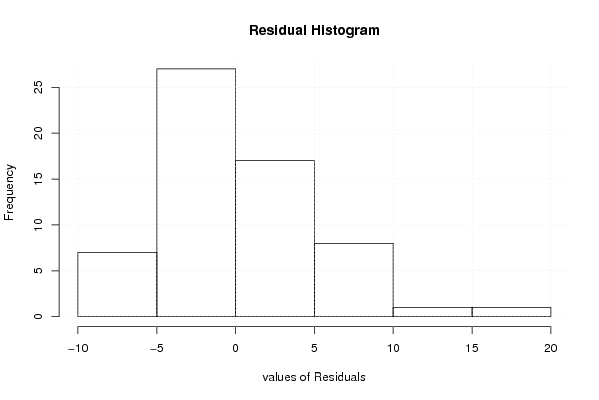
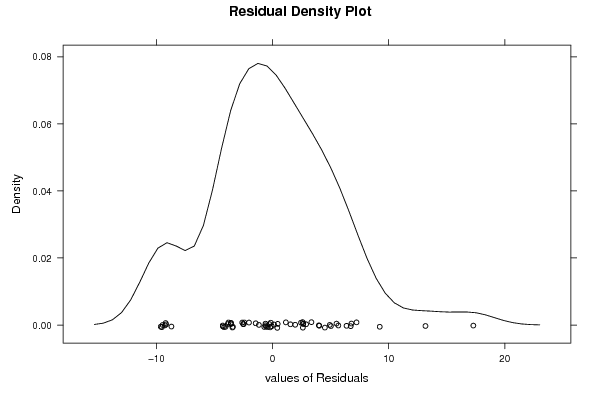
| Multiple Linear Regression - Residual Statistics | |
| Residual Standard Deviation | 6.06889503628554 |
| Sum Squared Residuals | 1767.91137414966 |
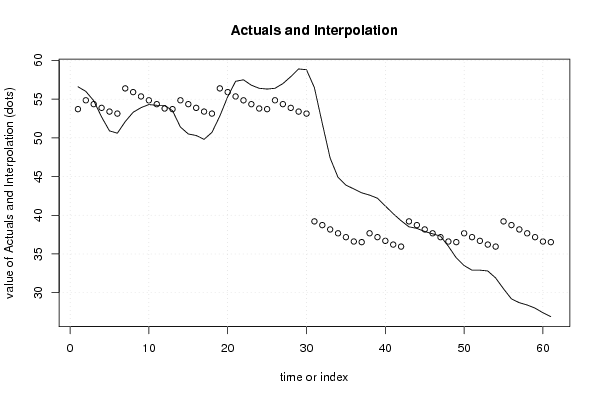
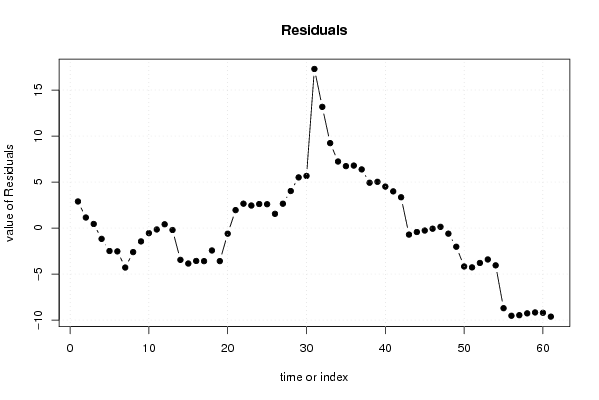
| Multiple Linear Regression - Actuals, Interpolation, and Residuals | |||
| Time or Index | Actuals | Interpolation Forecast | Residuals Prediction Error |
| 1 | 56.6 | 53.7074829931973 | 2.89251700680269 |
| 2 | 56 | 54.8526530612245 | 1.14734693877548 |
| 3 | 54.8 | 54.3526530612245 | 0.44734693877551 |
| 4 | 52.7 | 53.8726530612245 | -1.17265306122449 |
| 5 | 50.9 | 53.3926530612245 | -2.49265306122449 |
| 6 | 50.6 | 53.1326530612245 | -2.53265306122449 |
| 7 | 52.1 | 56.3889795918367 | -4.28897959183673 |
| 8 | 53.3 | 55.9089795918367 | -2.60897959183673 |
| 9 | 53.9 | 55.3489795918367 | -1.44897959183673 |
| 10 | 54.3 | 54.8489795918367 | -0.548979591836734 |
| 11 | 54.2 | 54.3489795918367 | -0.148979591836729 |
| 12 | 54.2 | 53.7889795918367 | 0.41102040816327 |
| 13 | 53.5 | 53.7074829931973 | -0.207482993197271 |
| 14 | 51.4 | 54.8526530612245 | -3.45265306122448 |
| 15 | 50.5 | 54.3526530612245 | -3.85265306122449 |
| 16 | 50.3 | 53.8726530612245 | -3.57265306122449 |
| 17 | 49.8 | 53.3926530612245 | -3.59265306122449 |
| 18 | 50.7 | 53.1326530612245 | -2.43265306122449 |
| 19 | 52.8 | 56.3889795918367 | -3.58897959183674 |
| 20 | 55.3 | 55.9089795918367 | -0.608979591836735 |
| 21 | 57.3 | 55.3489795918367 | 1.95102040816327 |
| 22 | 57.5 | 54.8489795918367 | 2.65102040816327 |
| 23 | 56.8 | 54.3489795918367 | 2.45102040816326 |
| 24 | 56.4 | 53.7889795918367 | 2.61102040816326 |
| 25 | 56.3 | 53.7074829931973 | 2.59251700680273 |
| 26 | 56.4 | 54.8526530612245 | 1.54734693877552 |
| 27 | 57 | 54.3526530612245 | 2.64734693877551 |
| 28 | 57.9 | 53.8726530612245 | 4.02734693877551 |
| 29 | 58.9 | 53.3926530612245 | 5.50734693877552 |
| 30 | 58.8 | 53.1326530612245 | 5.66734693877551 |
| 31 | 56.5 | 39.2073469387755 | 17.2926530612245 |
| 32 | 51.9 | 38.7273469387755 | 13.1726530612245 |
| 33 | 47.4 | 38.1673469387755 | 9.23265306122449 |
| 34 | 44.9 | 37.6673469387755 | 7.23265306122449 |
| 35 | 43.9 | 37.1673469387755 | 6.73265306122449 |
| 36 | 43.4 | 36.6073469387755 | 6.79265306122449 |
| 37 | 42.9 | 36.5258503401360 | 6.37414965986395 |
| 38 | 42.6 | 37.6710204081633 | 4.92897959183674 |
| 39 | 42.2 | 37.1710204081633 | 5.02897959183673 |
| 40 | 41.2 | 36.6910204081633 | 4.50897959183674 |
| 41 | 40.2 | 36.2110204081633 | 3.98897959183674 |
| 42 | 39.3 | 35.9510204081633 | 3.34897959183673 |
| 43 | 38.5 | 39.2073469387755 | -0.707346938775512 |
| 44 | 38.3 | 38.7273469387755 | -0.427346938775513 |
| 45 | 37.9 | 38.1673469387755 | -0.26734693877551 |
| 46 | 37.6 | 37.6673469387755 | -0.0673469387755091 |
| 47 | 37.3 | 37.1673469387755 | 0.132653061224487 |
| 48 | 36 | 36.6073469387755 | -0.607346938775511 |
| 49 | 34.5 | 36.5258503401360 | -2.02585034013605 |
| 50 | 33.5 | 37.6710204081633 | -4.17102040816326 |
| 51 | 32.9 | 37.1710204081633 | -4.27102040816327 |
| 52 | 32.9 | 36.6910204081633 | -3.79102040816327 |
| 53 | 32.8 | 36.2110204081633 | -3.41102040816327 |
| 54 | 31.9 | 35.9510204081633 | -4.05102040816327 |
| 55 | 30.5 | 39.2073469387755 | -8.70734693877551 |
| 56 | 29.2 | 38.7273469387755 | -9.5273469387755 |
| 57 | 28.7 | 38.1673469387755 | -9.46734693877551 |
| 58 | 28.4 | 37.6673469387755 | -9.26734693877551 |
| 59 | 28 | 37.1673469387755 | -9.16734693877551 |
| 60 | 27.4 | 36.6073469387755 | -9.20734693877552 |
| 61 | 26.9 | 36.5258503401360 | -9.62585034013605 |
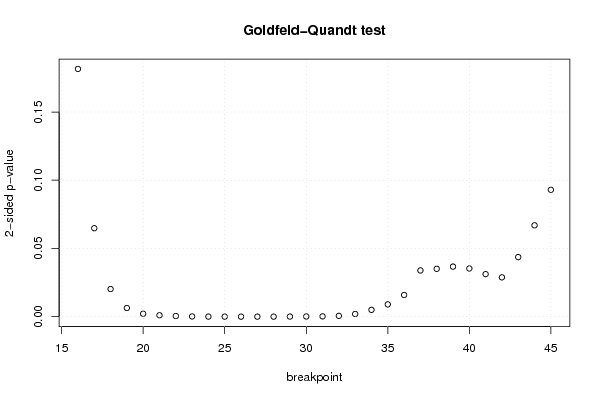
| Goldfeld-Quandt test for Heteroskedasticity | |||
| p-values | Alternative Hypothesis | ||
| breakpoint index | greater | 2-sided | less |
| 16 | 0.0907914733058338 | 0.181582946611668 | 0.909208526694166 |
| 17 | 0.0324229654828009 | 0.0648459309656018 | 0.96757703451720 |
| 18 | 0.0101204999314691 | 0.0202409998629381 | 0.98987950006853 |
| 19 | 0.00317813335186961 | 0.00635626670373922 | 0.99682186664813 |
| 20 | 0.00106843026887692 | 0.00213686053775383 | 0.998931569731123 |
| 21 | 0.000509209005742083 | 0.00101841801148417 | 0.999490790994258 |
| 22 | 0.000222614175948935 | 0.000445228351897871 | 0.99977738582405 |
| 23 | 8.04947863379647e-05 | 0.000160989572675929 | 0.999919505213662 |
| 24 | 2.57810506126255e-05 | 5.1562101225251e-05 | 0.999974218949387 |
| 25 | 6.88833087188077e-06 | 1.37766617437615e-05 | 0.999993111669128 |
| 26 | 2.82165500876413e-06 | 5.64331001752827e-06 | 0.999997178344991 |
| 27 | 2.51778939777423e-06 | 5.03557879554846e-06 | 0.999997482210602 |
| 28 | 6.18612248012076e-06 | 1.23722449602415e-05 | 0.99999381387752 |
| 29 | 2.97176721365546e-05 | 5.94353442731092e-05 | 0.999970282327863 |
| 30 | 6.04808323064724e-05 | 0.000120961664612945 | 0.999939519167694 |
| 31 | 0.000112671216721647 | 0.000225342433443294 | 0.999887328783278 |
| 32 | 0.000288804216643076 | 0.000577608433286153 | 0.999711195783357 |
| 33 | 0.000976820486026288 | 0.00195364097205258 | 0.999023179513974 |
| 34 | 0.00249830561678552 | 0.00499661123357103 | 0.997501694383214 |
| 35 | 0.00449709043797511 | 0.00899418087595022 | 0.995502909562025 |
| 36 | 0.0079416963394494 | 0.0158833926788988 | 0.99205830366055 |
| 37 | 0.0169449647852534 | 0.0338899295705067 | 0.983055035214747 |
| 38 | 0.0175388076101513 | 0.0350776152203026 | 0.982461192389849 |
| 39 | 0.018346960758706 | 0.036693921517412 | 0.981653039241294 |
| 40 | 0.0176554930598935 | 0.0353109861197869 | 0.982344506940107 |
| 41 | 0.0155925813454596 | 0.0311851626909191 | 0.98440741865454 |
| 42 | 0.0144066725763584 | 0.0288133451527168 | 0.985593327423642 |
| 43 | 0.0218292575560557 | 0.0436585151121113 | 0.978170742443944 |
| 44 | 0.0334849099877462 | 0.0669698199754923 | 0.966515090012254 |
| 45 | 0.0464960165265584 | 0.0929920330531168 | 0.953503983473442 |
| Meta Analysis of Goldfeld-Quandt test for Heteroskedasticity | |||
| Description | # significant tests | % significant tests | OK/NOK |
| 1% type I error level | 17 | 0.566666666666667 | NOK |
| 5% type I error level | 26 | 0.866666666666667 | NOK |
| 10% type I error level | 29 | 0.966666666666667 | NOK |