| Multiple Linear Regression - Estimated Regression Equation |
| Consvertr[t] = + 0.705596169285437 + 0.00366456642861570Aand[t] + 0.459254170458587Y1[t] -0.110442093795957t + e[t] |
| Multiple Linear Regression - Ordinary Least Squares | |||||
| Variable | Parameter | S.D. | T-STAT H0: parameter = 0 | 2-tail p-value | 1-tail p-value |
| (Intercept) | 0.705596169285437 | 1.739958 | 0.4055 | 0.686637 | 0.343319 |
| Aand | 0.00366456642861570 | 0.000795 | 4.6092 | 2.4e-05 | 1.2e-05 |
| Y1 | 0.459254170458587 | 0.108016 | 4.2517 | 8.1e-05 | 4.1e-05 |
| t | -0.110442093795957 | 0.027628 | -3.9975 | 0.000189 | 9.5e-05 |
| Multiple Linear Regression - Regression Statistics | |
| Multiple R | 0.915561174940805 |
| R-squared | 0.838252265058987 |
| Adjusted R-squared | 0.829587207830004 |
| F-TEST (value) | 96.7393801226384 |
| F-TEST (DF numerator) | 3 |
| F-TEST (DF denominator) | 56 |
| p-value | 0 |
| Multiple Linear Regression - Residual Statistics | |
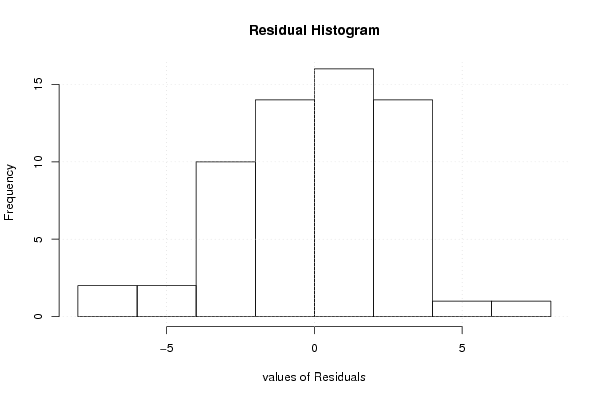
| Residual Standard Deviation | 2.84872942692069 |
| Sum Squared Residuals | 454.454523477017 |
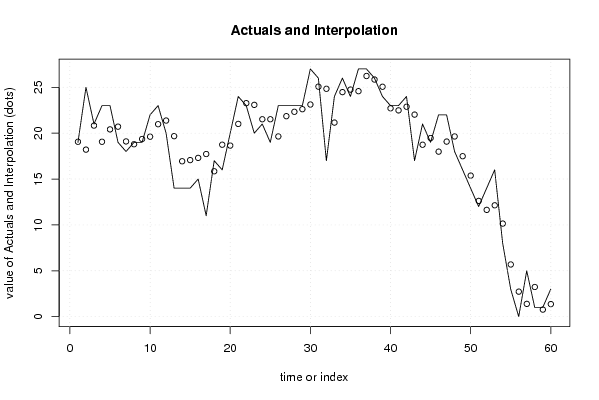
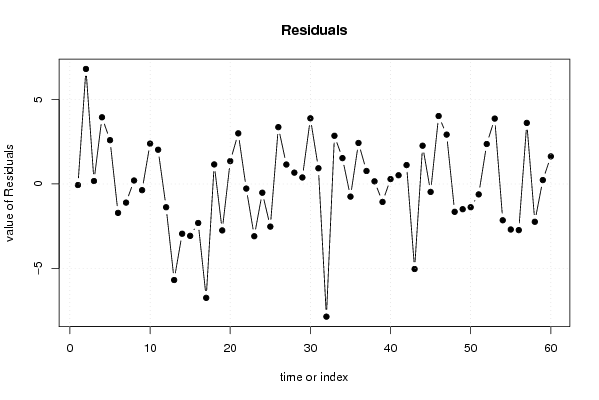
| Multiple Linear Regression - Actuals, Interpolation, and Residuals | |||
| Time or Index | Actuals | Interpolation Forecast | Residuals Prediction Error |
| 1 | 19 | 19.062301788655 | -0.0623017886549878 |
| 2 | 25 | 18.2056592674154 | 6.79434073258464 |
| 3 | 21 | 20.8266659949349 | 0.173334005065065 |
| 4 | 23 | 19.0616659817854 | 3.93833401821460 |
| 5 | 23 | 20.411355147056 | 2.58864485294399 |
| 6 | 19 | 20.7081196748078 | -1.70811967480784 |
| 7 | 18 | 19.0996699394888 | -1.09966993948877 |
| 8 | 19 | 18.7944454343874 | 0.205554565612584 |
| 9 | 19 | 19.3646339690027 | -0.364633969002720 |
| 10 | 22 | 19.615994518704 | 2.38400548129601 |
| 11 | 23 | 20.9772744195135 | 2.02272558048650 |
| 12 | 20 | 21.3740556707267 | -1.37405567072671 |
| 13 | 14 | 19.6731229843739 | -5.67312298437385 |
| 14 | 14 | 16.9392634875780 | -2.93926348757796 |
| 15 | 14 | 17.0647461804563 | -3.06474618045629 |
| 16 | 15 | 17.3041602436003 | -2.30416024360027 |
| 17 | 11 | 17.7257139638709 | -6.72571396387092 |
| 18 | 17 | 15.8453533995486 | 1.15464660045143 |
| 19 | 16 | 18.7420821051572 | -2.74208210515717 |
| 20 | 20 | 18.6494390985798 | 1.35056090142018 |
| 21 | 24 | 21.0094706394687 | 2.99052936053127 |
| 22 | 23 | 23.2711818630779 | -0.271181863077868 |
| 23 | 20 | 23.0858986171851 | -3.08589861718511 |
| 24 | 21 | 21.5154244956910 | -0.515424495690969 |
| 25 | 19 | 21.5181182731708 | -2.51811827317085 |
| 26 | 23 | 19.6428728674332 | 3.3571271325668 |
| 27 | 23 | 21.8513012951703 | 1.14869870482973 |
| 28 | 23 | 22.3296084437957 | 0.670391556204286 |
| 29 | 23 | 22.6143165479974 | 0.385683452002612 |
| 30 | 27 | 23.1210607321089 | 3.87893926789111 |
| 31 | 26 | 25.0720167225714 | 0.927983277428581 |
| 32 | 17 | 24.8363090426209 | -7.83630904262091 |
| 33 | 24 | 21.1533313696044 | 2.84666863039556 |
| 34 | 26 | 24.4728884553712 | 1.52711154462880 |
| 35 | 24 | 24.7471739565002 | -0.747173956500248 |
| 36 | 27 | 24.5767947903475 | 2.42320520965251 |
| 37 | 27 | 26.2314232337677 | 0.768576766232311 |
| 38 | 26 | 25.8440865006255 | 0.155913499374474 |
| 39 | 24 | 25.0597932263112 | -1.05979322631125 |
| 40 | 23 | 22.7104262160393 | 0.289573783960693 |
| 41 | 23 | 22.4850892590818 | 0.514910740918223 |
| 42 | 24 | 22.8830691115920 | 1.11693088840804 |
| 43 | 17 | 22.02239103849 | -5.02239103848998 |
| 44 | 21 | 18.739312265413 | 2.26068773458701 |
| 45 | 19 | 19.4684285172465 | -0.468428517246474 |
| 46 | 22 | 17.9868674829350 | 4.01313251706498 |
| 47 | 22 | 19.0834923962699 | 2.9165076037301 |
| 48 | 18 | 19.6444721635249 | -1.64447216352491 |
| 49 | 16 | 17.4897455106921 | -1.48974551069210 |
| 50 | 14 | 15.3735548622730 | -1.37355486227298 |
| 51 | 12 | 12.6157719235318 | -0.615771923531813 |
| 52 | 14 | 11.6397011823836 | 2.36029881761639 |
| 53 | 16 | 12.1374152986654 | 3.86258470133464 |
| 54 | 8 | 10.1438472197813 | -2.1438472197813 |
| 55 | 3 | 5.68740021630138 | -2.68740021630138 |
| 56 | 0 | 2.72506570830577 | -2.72506570830577 |
| 57 | 5 | 1.39289834166451 | 3.60710165833549 |
| 58 | 1 | 3.23271873797160 | -2.23271873797160 |
| 59 | 1 | 0.768849261220764 | 0.231150738779236 |
| 60 | 3 | 1.37068894415484 | 1.62931105584516 |
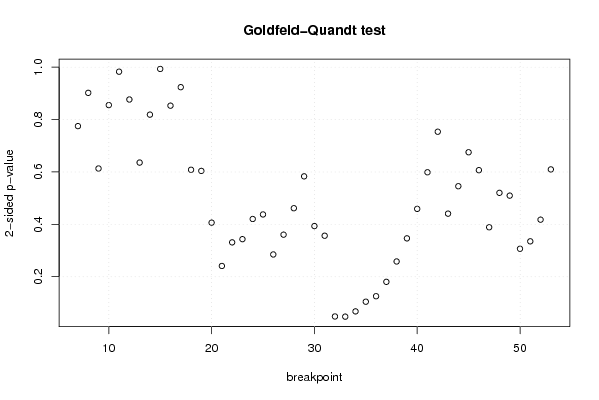
| Goldfeld-Quandt test for Heteroskedasticity | |||
| p-values | Alternative Hypothesis | ||
| breakpoint index | greater | 2-sided | less |
| 7 | 0.612506659060428 | 0.774986681879145 | 0.387493340939572 |
| 8 | 0.450964525890642 | 0.901929051781283 | 0.549035474109358 |
| 9 | 0.306553662200775 | 0.61310732440155 | 0.693446337799225 |
| 10 | 0.427599916406898 | 0.855199832813795 | 0.572400083593102 |
| 11 | 0.491352827322583 | 0.982705654645165 | 0.508647172677418 |
| 12 | 0.438273010374284 | 0.876546020748567 | 0.561726989625716 |
| 13 | 0.682109336561436 | 0.635781326877129 | 0.317890663438564 |
| 14 | 0.590613439514566 | 0.818773120970868 | 0.409386560485434 |
| 15 | 0.503405905170304 | 0.993188189659392 | 0.496594094829696 |
| 16 | 0.426500472019748 | 0.853000944039496 | 0.573499527980252 |
| 17 | 0.538207903562695 | 0.92358419287461 | 0.461792096437305 |
| 18 | 0.695906885695507 | 0.608186228608986 | 0.304093114304493 |
| 19 | 0.698026213828288 | 0.603947572343425 | 0.301973786171712 |
| 20 | 0.796828211730261 | 0.406343576539478 | 0.203171788269739 |
| 21 | 0.879494042558763 | 0.241011914882474 | 0.120505957441237 |
| 22 | 0.834445852367038 | 0.331108295265923 | 0.165554147632962 |
| 23 | 0.828309692146075 | 0.343380615707849 | 0.171690307853925 |
| 24 | 0.789819843988213 | 0.420360312023575 | 0.210180156011787 |
| 25 | 0.781146555205996 | 0.437706889588008 | 0.218853444794004 |
| 26 | 0.857522288580872 | 0.284955422838256 | 0.142477711419128 |
| 27 | 0.819752359691907 | 0.360495280616187 | 0.180247640308093 |
| 28 | 0.769248328173383 | 0.461503343653235 | 0.230751671826617 |
| 29 | 0.708423283377555 | 0.583153433244891 | 0.291576716622445 |
| 30 | 0.803349028943521 | 0.393301942112958 | 0.196650971056479 |
| 31 | 0.821760879590498 | 0.356478240819004 | 0.178239120409502 |
| 32 | 0.97589427239832 | 0.0482114552033581 | 0.0241057276016790 |
| 33 | 0.97623566528571 | 0.0475286694285801 | 0.0237643347142900 |
| 34 | 0.966164017317105 | 0.0676719653657901 | 0.0338359826828951 |
| 35 | 0.947719757904089 | 0.104560484191823 | 0.0522802420959114 |
| 36 | 0.937225224323716 | 0.125549551352568 | 0.0627747756762838 |
| 37 | 0.90976757717954 | 0.180464845640921 | 0.0902324228204607 |
| 38 | 0.870906969100387 | 0.258186061799226 | 0.129093030899613 |
| 39 | 0.826780884371045 | 0.346438231257909 | 0.173219115628955 |
| 40 | 0.770500989092046 | 0.458998021815909 | 0.229499010907954 |
| 41 | 0.700664867752641 | 0.598670264494718 | 0.299335132247359 |
| 42 | 0.623253926793331 | 0.753492146413338 | 0.376746073206669 |
| 43 | 0.779640743431866 | 0.440718513136269 | 0.220359256568134 |
| 44 | 0.727264405710641 | 0.545471188578719 | 0.272735594289359 |
| 45 | 0.662441969317413 | 0.675116061365174 | 0.337558030682587 |
| 46 | 0.696624088439654 | 0.606751823120692 | 0.303375911560346 |
| 47 | 0.80559378091816 | 0.388812438163678 | 0.194406219081839 |
| 48 | 0.739889642992553 | 0.520220714014894 | 0.260110357007447 |
| 49 | 0.745210991752318 | 0.509578016495363 | 0.254789008247682 |
| 50 | 0.84669628440806 | 0.30660743118388 | 0.15330371559194 |
| 51 | 0.832450767001289 | 0.335098465997422 | 0.167549232998711 |
| 52 | 0.791115099713658 | 0.417769800572684 | 0.208884900286342 |
| 53 | 0.695165814512106 | 0.609668370975787 | 0.304834185487894 |
| Meta Analysis of Goldfeld-Quandt test for Heteroskedasticity | |||
| Description | # significant tests | % significant tests | OK/NOK |
| 1% type I error level | 0 | 0 | OK |
| 5% type I error level | 2 | 0.0425531914893617 | OK |
| 10% type I error level | 3 | 0.0638297872340425 | OK |