Free Statistics

of Irreproducible Research!

Author's title

Author*The author of this computation has been verified*
R Software Modulerwasp_multipleregression.wasp
Title produced by softwareMultiple Regression
Date of computationThu, 19 Nov 2009 09:26:46 -0700
Cite this page as followsStatistical Computations at FreeStatistics.org, Office for Research Development and Education, URL https://freestatistics.org/blog/index.php?v=date/2009/Nov/19/t12586497742aih0ljd2ajpv0i.htm/, Retrieved Sat, 20 Apr 2024 10:20:07 +0000
Statistical Computations at FreeStatistics.org, Office for Research Development and Education, URL https://freestatistics.org/blog/index.php?pk=57823, Retrieved Sat, 20 Apr 2024 10:20:07 +0000
QR Codes:

Original text written by user:
IsPrivate?No (this computation is public)
User-defined keywords
Estimated Impact110
Family? (F = Feedback message, R = changed R code, M = changed R Module, P = changed Parameters, D = changed Data)
-     [Multiple Regression] [Q1 The Seatbeltlaw] [2007-11-14 19:27:43] [8cd6641b921d30ebe00b648d1481bba0]
- RMPD  [Multiple Regression] [Seatbelt] [2009-11-12 13:54:52] [b98453cac15ba1066b407e146608df68]
-    D      [Multiple Regression] [Multiple Regressi...] [2009-11-19 16:26:46] [b58cdc967a53abb3723a2bc8f9332128] [Current]
Feedback Forum

Post a new message
Dataseries X:
4	7.2	102.9	271244
4.1	7.4	97.4	269907
4	8.8	111.4	271296
3.8	9.3	87.4	270157
4.7	9.3	96.8	271322
4.3	8.7	114.1	267179
3.9	8.2	110.3	264101
4	8.3	103.9	265518
4.3	8.5	101.6	269419
4.8	8.6	94.6	268714
4.4	8.5	95.9	272482
4.3	8.2	104.7	268351
4.7	8.1	102.8	268175
4.7	7.9	98.1	270674
4.9	8.6	113.9	272764
5	8.7	80.9	272599
4.2	8.7	95.7	270333
4.3	8.5	113.2	270846
4.8	8.4	105.9	270491
4.8	8.5	108.8	269160
4.8	8.7	102.3	274027
4.2	8.7	99	273784
4.6	8.6	100.7	276663
4.8	8.5	115.5	274525
4.5	8.3	100.7	271344
4.4	8	109.9	271115
4.3	8.2	114.6	270798
3.9	8.1	85.4	273911
3.7	8.1	100.5	273985
4	8	114.8	271917
4.1	7.9	116.5	273338
3.7	7.9	112.9	270601
3.8	8	102	273547
3.8	8	106	275363
3.8	7.9	105.3	281229
3.3	8	118.8	277793
3.3	7.7	106.1	279913
3.3	7.2	109.3	282500
3.2	7.5	117.2	280041
3.4	7.3	92.5	282166
4.2	7	104.2	290304
4.9	7	112.5	283519
5.1	7	122.4	287816
5.5	7.2	113.3	285226
5.6	7.3	100	287595
6.4	7.1	110.7	289741
6.1	6.8	112.8	289148
7.1	6.4	109.8	288301
7.8	6.1	117.3	290155
7.9	6.5	109.1	289648
7.4	7.7	115.9	288225
7.5	7.9	96	289351
6.8	7.5	99.8	294735
5.2	6.9	116.8	305333
4.7	6.6	115.7	309030
4.1	6.9	99.4	310215
3.9	7.7	94.3	321935
2.6	8	91	325734
2.7	8	93.2	320846
1.8	7.7	103.1	323023
1	7.3	94.1	319753
0.3	7.4	91.8	321753
1.3	8.1	102.7	320757
1	8.3	82.6	324479
1.1	8.2	89.1	324641


Summary of computational transaction
Raw Inputview raw input (R code)
Raw Outputview raw output of R engine
Computing time4 seconds
R Server'Gwilym Jenkins' @ 72.249.127.135

\begin{tabular}{lllllllll}
\hline
Summary of computational transaction \tabularnewline
Raw Input & view raw input (R code)  \tabularnewline
Raw Output & view raw output of R engine  \tabularnewline
Computing time & 4 seconds \tabularnewline
R Server & 'Gwilym Jenkins' @ 72.249.127.135 \tabularnewline
\hline
\end{tabular}
%Source: https://freestatistics.org/blog/index.php?pk=57823&T=0

[TABLE]
[ROW][C]Summary of computational transaction[/C][/ROW]
[ROW][C]Raw Input[/C][C]view raw input (R code) [/C][/ROW]
[ROW][C]Raw Output[/C][C]view raw output of R engine [/C][/ROW]
[ROW][C]Computing time[/C][C]4 seconds[/C][/ROW]
[ROW][C]R Server[/C][C]'Gwilym Jenkins' @ 72.249.127.135[/C][/ROW]
[/TABLE]
Source: https://freestatistics.org/blog/index.php?pk=57823&T=0

Globally Unique Identifier (entire table): ba.freestatistics.org/blog/index.php?pk=57823&T=0

As an alternative you can also use a QR Code:  

The GUIDs for individual cells are displayed in the table below:

Summary of computational transaction
Raw Inputview raw input (R code)
Raw Outputview raw output of R engine
Computing time4 seconds
R Server'Gwilym Jenkins' @ 72.249.127.135


Multiple Linear Regression - Estimated Regression Equation
Cons.index[t] = + 25.0581301035609 -1.06842952839769Werkl.graad[t] + 0.0114153233526319Industr.prod.[t] -4.76358601503515e-05BrutoSchuld[t] + e[t]

\begin{tabular}{lllllllll}
\hline
Multiple Linear Regression - Estimated Regression Equation \tabularnewline
Cons.index[t] =  +  25.0581301035609 -1.06842952839769Werkl.graad[t] +  0.0114153233526319Industr.prod.[t] -4.76358601503515e-05BrutoSchuld[t]  + e[t] \tabularnewline
\hline
\end{tabular}
%Source: https://freestatistics.org/blog/index.php?pk=57823&T=1

[TABLE]
[ROW][C]Multiple Linear Regression - Estimated Regression Equation[/C][/ROW]
[ROW][C]Cons.index[t] =  +  25.0581301035609 -1.06842952839769Werkl.graad[t] +  0.0114153233526319Industr.prod.[t] -4.76358601503515e-05BrutoSchuld[t]  + e[t][/C][/ROW]
[/TABLE]
Source: https://freestatistics.org/blog/index.php?pk=57823&T=1

Globally Unique Identifier (entire table): ba.freestatistics.org/blog/index.php?pk=57823&T=1

As an alternative you can also use a QR Code:  

The GUIDs for individual cells are displayed in the table below:

Multiple Linear Regression - Estimated Regression Equation
Cons.index[t] = + 25.0581301035609 -1.06842952839769Werkl.graad[t] + 0.0114153233526319Industr.prod.[t] -4.76358601503515e-05BrutoSchuld[t] + e[t]


Multiple Linear Regression - Ordinary Least Squares
VariableParameterS.D.T-STATH0: parameter = 02-tail p-value1-tail p-value
(Intercept)25.05813010356095.8844394.25847.2e-053.6e-05
Werkl.graad-1.068429528397690.278026-3.84290.0002920.000146
Industr.prod.0.01141532335263190.0192790.59210.5559590.277979
BrutoSchuld-4.76358601503515e-051e-05-4.5842.3e-051.2e-05

\begin{tabular}{lllllllll}
\hline
Multiple Linear Regression - Ordinary Least Squares \tabularnewline
Variable & Parameter & S.D. & T-STATH0: parameter = 0 & 2-tail p-value & 1-tail p-value \tabularnewline
(Intercept) & 25.0581301035609 & 5.884439 & 4.2584 & 7.2e-05 & 3.6e-05 \tabularnewline
Werkl.graad & -1.06842952839769 & 0.278026 & -3.8429 & 0.000292 & 0.000146 \tabularnewline
Industr.prod. & 0.0114153233526319 & 0.019279 & 0.5921 & 0.555959 & 0.277979 \tabularnewline
BrutoSchuld & -4.76358601503515e-05 & 1e-05 & -4.584 & 2.3e-05 & 1.2e-05 \tabularnewline
\hline
\end{tabular}
%Source: https://freestatistics.org/blog/index.php?pk=57823&T=2

[TABLE]
[ROW][C]Multiple Linear Regression - Ordinary Least Squares[/C][/ROW]
[ROW][C]Variable[/C][C]Parameter[/C][C]S.D.[/C][C]T-STATH0: parameter = 0[/C][C]2-tail p-value[/C][C]1-tail p-value[/C][/ROW]
[ROW][C](Intercept)[/C][C]25.0581301035609[/C][C]5.884439[/C][C]4.2584[/C][C]7.2e-05[/C][C]3.6e-05[/C][/ROW]
[ROW][C]Werkl.graad[/C][C]-1.06842952839769[/C][C]0.278026[/C][C]-3.8429[/C][C]0.000292[/C][C]0.000146[/C][/ROW]
[ROW][C]Industr.prod.[/C][C]0.0114153233526319[/C][C]0.019279[/C][C]0.5921[/C][C]0.555959[/C][C]0.277979[/C][/ROW]
[ROW][C]BrutoSchuld[/C][C]-4.76358601503515e-05[/C][C]1e-05[/C][C]-4.584[/C][C]2.3e-05[/C][C]1.2e-05[/C][/ROW]
[/TABLE]
Source: https://freestatistics.org/blog/index.php?pk=57823&T=2

Globally Unique Identifier (entire table): ba.freestatistics.org/blog/index.php?pk=57823&T=2

As an alternative you can also use a QR Code:  

The GUIDs for individual cells are displayed in the table below:

Multiple Linear Regression - Ordinary Least Squares
VariableParameterS.D.T-STATH0: parameter = 02-tail p-value1-tail p-value
(Intercept)25.05813010356095.8844394.25847.2e-053.6e-05
Werkl.graad-1.068429528397690.278026-3.84290.0002920.000146
Industr.prod.0.01141532335263190.0192790.59210.5559590.277979
BrutoSchuld-4.76358601503515e-051e-05-4.5842.3e-051.2e-05


Multiple Linear Regression - Regression Statistics
Multiple R0.623066294095584
R-squared0.388211606838005
Adjusted R-squared0.358123653075940
F-TEST (value)12.9025592736539
F-TEST (DF numerator)3
F-TEST (DF denominator)61
p-value1.24809663959446e-06
Multiple Linear Regression - Residual Statistics
Residual Standard Deviation1.23092396372239
Sum Squared Residuals92.425602072429

\begin{tabular}{lllllllll}
\hline
Multiple Linear Regression - Regression Statistics \tabularnewline
Multiple R & 0.623066294095584 \tabularnewline
R-squared & 0.388211606838005 \tabularnewline
Adjusted R-squared & 0.358123653075940 \tabularnewline
F-TEST (value) & 12.9025592736539 \tabularnewline
F-TEST (DF numerator) & 3 \tabularnewline
F-TEST (DF denominator) & 61 \tabularnewline
p-value & 1.24809663959446e-06 \tabularnewline
Multiple Linear Regression - Residual Statistics \tabularnewline
Residual Standard Deviation & 1.23092396372239 \tabularnewline
Sum Squared Residuals & 92.425602072429 \tabularnewline
\hline
\end{tabular}
%Source: https://freestatistics.org/blog/index.php?pk=57823&T=3

[TABLE]
[ROW][C]Multiple Linear Regression - Regression Statistics[/C][/ROW]
[ROW][C]Multiple R[/C][C]0.623066294095584[/C][/ROW]
[ROW][C]R-squared[/C][C]0.388211606838005[/C][/ROW]
[ROW][C]Adjusted R-squared[/C][C]0.358123653075940[/C][/ROW]
[ROW][C]F-TEST (value)[/C][C]12.9025592736539[/C][/ROW]
[ROW][C]F-TEST (DF numerator)[/C][C]3[/C][/ROW]
[ROW][C]F-TEST (DF denominator)[/C][C]61[/C][/ROW]
[ROW][C]p-value[/C][C]1.24809663959446e-06[/C][/ROW]
[ROW][C]Multiple Linear Regression - Residual Statistics[/C][/ROW]
[ROW][C]Residual Standard Deviation[/C][C]1.23092396372239[/C][/ROW]
[ROW][C]Sum Squared Residuals[/C][C]92.425602072429[/C][/ROW]
[/TABLE]
Source: https://freestatistics.org/blog/index.php?pk=57823&T=3

Globally Unique Identifier (entire table): ba.freestatistics.org/blog/index.php?pk=57823&T=3

As an alternative you can also use a QR Code:  

The GUIDs for individual cells are displayed in the table below:

Multiple Linear Regression - Regression Statistics
Multiple R0.623066294095584
R-squared0.388211606838005
Adjusted R-squared0.358123653075940
F-TEST (value)12.9025592736539
F-TEST (DF numerator)3
F-TEST (DF denominator)61
p-value1.24809663959446e-06
Multiple Linear Regression - Residual Statistics
Residual Standard Deviation1.23092396372239
Sum Squared Residuals92.425602072429


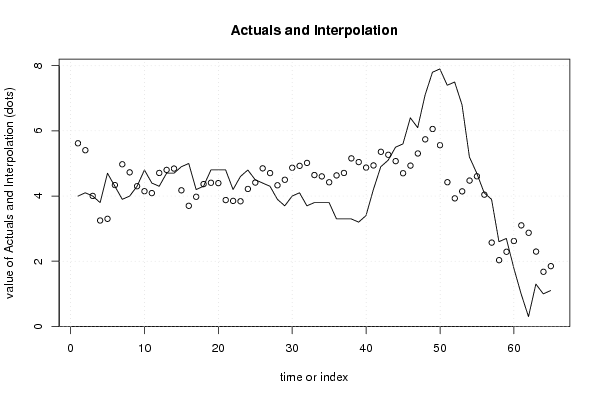
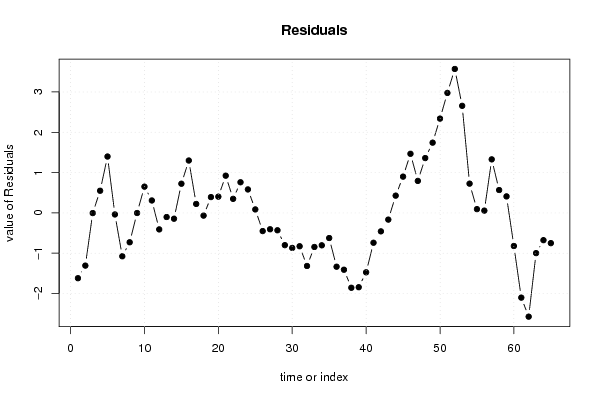
Multiple Linear Regression - Actuals, Interpolation, and Residuals
Time or IndexActualsInterpolationForecastResidualsPrediction Error
145.61913302146152-1.61913302146152
24.15.40635198236346-1.30635198236346
344.0041989597947-0.00419895979470014
43.83.250273679843940.549726320156060
54.73.302081942283521.39791805771648
64.34.33798012192557-0.0379801219255748
73.94.9754398349272-1.07543983492720
844.72803879879754-0.728038798797539
94.34.30227015896043-0.00227015896042693
104.84.149103224058230.650896775941767
114.44.09129417620990.308705823790102
124.34.70906161851347-0.409061618513469
134.74.8025993683697-0.102599368369699
144.74.84359123977614-0.143591239776138
154.94.17649373115510.723506268844896
1653.700805024603291.29919497539671
174.23.977694669322940.22230533067706
184.34.36671153741641-0.066711537416405
194.84.407133360135340.392866639864664
204.84.396798174878320.403201825121683
214.83.877068936054910.922931063945088
224.23.850973883007760.349026116992238
234.63.840079244174140.759920755825856
244.84.217714451634310.582285548365685
254.54.413983242833170.086016757166831
264.44.85044168817112-0.45044168817112
274.34.70550836991661-0.405508369916614
283.94.33073344821149-0.430733448211489
293.74.49957977718510-0.799579777185104
3044.86817281275843-0.868172812758435
314.14.92673125802403-0.826731258024029
323.75.01601544318607-1.31601544318607
333.84.64441022179967-0.844410221799674
343.84.60356479317716-0.803564793177163
353.84.42298506402813-0.622985064028128
363.34.6339257919255-1.33392579192550
373.34.70849202034763-1.40849202034763
383.35.15600184906594-1.85600184906594
393.25.04279062514214-1.84279062514214
403.44.87329184119218-1.47329184119218
414.24.93971935303372-0.739719353033716
424.95.3576758479807-0.457675847980695
435.15.26599625810569-0.165996258105691
445.55.071807787706610.428192212293388
455.64.700291681580660.899708318419343
466.44.93389499125071.46610500874930
476.15.30664409387970.793355906120305
487.15.740117508728221.35988249127178
497.86.057944407673521.74205559232648
507.95.561118325919092.33888167408091
517.44.424412919633712.97558708036629
527.53.92992410070753.57007589929250
536.84.144202669757082.65579733024292
545.24.474476037917010.725523962082986
554.74.606338265772580.0936617342274224
564.14.04329114232720.0567088576727956
573.92.572037089548511.32796291045149
582.62.032869031254330.567130968745668
592.72.290826827045040.40917317295496
601.82.62066411920809-0.820664119208088
6113.10106728308513-2.10106728308513
620.32.8726973662336-2.5726973662336
631.32.29666903760866-0.996669037608656
6411.67623446106161-0.676234461061607
651.11.84956000634913-0.749560006349129

\begin{tabular}{lllllllll}
\hline
Multiple Linear Regression - Actuals, Interpolation, and Residuals \tabularnewline
Time or Index & Actuals & InterpolationForecast & ResidualsPrediction Error \tabularnewline
1 & 4 & 5.61913302146152 & -1.61913302146152 \tabularnewline
2 & 4.1 & 5.40635198236346 & -1.30635198236346 \tabularnewline
3 & 4 & 4.0041989597947 & -0.00419895979470014 \tabularnewline
4 & 3.8 & 3.25027367984394 & 0.549726320156060 \tabularnewline
5 & 4.7 & 3.30208194228352 & 1.39791805771648 \tabularnewline
6 & 4.3 & 4.33798012192557 & -0.0379801219255748 \tabularnewline
7 & 3.9 & 4.9754398349272 & -1.07543983492720 \tabularnewline
8 & 4 & 4.72803879879754 & -0.728038798797539 \tabularnewline
9 & 4.3 & 4.30227015896043 & -0.00227015896042693 \tabularnewline
10 & 4.8 & 4.14910322405823 & 0.650896775941767 \tabularnewline
11 & 4.4 & 4.0912941762099 & 0.308705823790102 \tabularnewline
12 & 4.3 & 4.70906161851347 & -0.409061618513469 \tabularnewline
13 & 4.7 & 4.8025993683697 & -0.102599368369699 \tabularnewline
14 & 4.7 & 4.84359123977614 & -0.143591239776138 \tabularnewline
15 & 4.9 & 4.1764937311551 & 0.723506268844896 \tabularnewline
16 & 5 & 3.70080502460329 & 1.29919497539671 \tabularnewline
17 & 4.2 & 3.97769466932294 & 0.22230533067706 \tabularnewline
18 & 4.3 & 4.36671153741641 & -0.066711537416405 \tabularnewline
19 & 4.8 & 4.40713336013534 & 0.392866639864664 \tabularnewline
20 & 4.8 & 4.39679817487832 & 0.403201825121683 \tabularnewline
21 & 4.8 & 3.87706893605491 & 0.922931063945088 \tabularnewline
22 & 4.2 & 3.85097388300776 & 0.349026116992238 \tabularnewline
23 & 4.6 & 3.84007924417414 & 0.759920755825856 \tabularnewline
24 & 4.8 & 4.21771445163431 & 0.582285548365685 \tabularnewline
25 & 4.5 & 4.41398324283317 & 0.086016757166831 \tabularnewline
26 & 4.4 & 4.85044168817112 & -0.45044168817112 \tabularnewline
27 & 4.3 & 4.70550836991661 & -0.405508369916614 \tabularnewline
28 & 3.9 & 4.33073344821149 & -0.430733448211489 \tabularnewline
29 & 3.7 & 4.49957977718510 & -0.799579777185104 \tabularnewline
30 & 4 & 4.86817281275843 & -0.868172812758435 \tabularnewline
31 & 4.1 & 4.92673125802403 & -0.826731258024029 \tabularnewline
32 & 3.7 & 5.01601544318607 & -1.31601544318607 \tabularnewline
33 & 3.8 & 4.64441022179967 & -0.844410221799674 \tabularnewline
34 & 3.8 & 4.60356479317716 & -0.803564793177163 \tabularnewline
35 & 3.8 & 4.42298506402813 & -0.622985064028128 \tabularnewline
36 & 3.3 & 4.6339257919255 & -1.33392579192550 \tabularnewline
37 & 3.3 & 4.70849202034763 & -1.40849202034763 \tabularnewline
38 & 3.3 & 5.15600184906594 & -1.85600184906594 \tabularnewline
39 & 3.2 & 5.04279062514214 & -1.84279062514214 \tabularnewline
40 & 3.4 & 4.87329184119218 & -1.47329184119218 \tabularnewline
41 & 4.2 & 4.93971935303372 & -0.739719353033716 \tabularnewline
42 & 4.9 & 5.3576758479807 & -0.457675847980695 \tabularnewline
43 & 5.1 & 5.26599625810569 & -0.165996258105691 \tabularnewline
44 & 5.5 & 5.07180778770661 & 0.428192212293388 \tabularnewline
45 & 5.6 & 4.70029168158066 & 0.899708318419343 \tabularnewline
46 & 6.4 & 4.9338949912507 & 1.46610500874930 \tabularnewline
47 & 6.1 & 5.3066440938797 & 0.793355906120305 \tabularnewline
48 & 7.1 & 5.74011750872822 & 1.35988249127178 \tabularnewline
49 & 7.8 & 6.05794440767352 & 1.74205559232648 \tabularnewline
50 & 7.9 & 5.56111832591909 & 2.33888167408091 \tabularnewline
51 & 7.4 & 4.42441291963371 & 2.97558708036629 \tabularnewline
52 & 7.5 & 3.9299241007075 & 3.57007589929250 \tabularnewline
53 & 6.8 & 4.14420266975708 & 2.65579733024292 \tabularnewline
54 & 5.2 & 4.47447603791701 & 0.725523962082986 \tabularnewline
55 & 4.7 & 4.60633826577258 & 0.0936617342274224 \tabularnewline
56 & 4.1 & 4.0432911423272 & 0.0567088576727956 \tabularnewline
57 & 3.9 & 2.57203708954851 & 1.32796291045149 \tabularnewline
58 & 2.6 & 2.03286903125433 & 0.567130968745668 \tabularnewline
59 & 2.7 & 2.29082682704504 & 0.40917317295496 \tabularnewline
60 & 1.8 & 2.62066411920809 & -0.820664119208088 \tabularnewline
61 & 1 & 3.10106728308513 & -2.10106728308513 \tabularnewline
62 & 0.3 & 2.8726973662336 & -2.5726973662336 \tabularnewline
63 & 1.3 & 2.29666903760866 & -0.996669037608656 \tabularnewline
64 & 1 & 1.67623446106161 & -0.676234461061607 \tabularnewline
65 & 1.1 & 1.84956000634913 & -0.749560006349129 \tabularnewline
\hline
\end{tabular}
%Source: https://freestatistics.org/blog/index.php?pk=57823&T=4

[TABLE]
[ROW][C]Multiple Linear Regression - Actuals, Interpolation, and Residuals[/C][/ROW]
[ROW][C]Time or Index[/C][C]Actuals[/C][C]InterpolationForecast[/C][C]ResidualsPrediction Error[/C][/ROW]
[ROW][C]1[/C][C]4[/C][C]5.61913302146152[/C][C]-1.61913302146152[/C][/ROW]
[ROW][C]2[/C][C]4.1[/C][C]5.40635198236346[/C][C]-1.30635198236346[/C][/ROW]
[ROW][C]3[/C][C]4[/C][C]4.0041989597947[/C][C]-0.00419895979470014[/C][/ROW]
[ROW][C]4[/C][C]3.8[/C][C]3.25027367984394[/C][C]0.549726320156060[/C][/ROW]
[ROW][C]5[/C][C]4.7[/C][C]3.30208194228352[/C][C]1.39791805771648[/C][/ROW]
[ROW][C]6[/C][C]4.3[/C][C]4.33798012192557[/C][C]-0.0379801219255748[/C][/ROW]
[ROW][C]7[/C][C]3.9[/C][C]4.9754398349272[/C][C]-1.07543983492720[/C][/ROW]
[ROW][C]8[/C][C]4[/C][C]4.72803879879754[/C][C]-0.728038798797539[/C][/ROW]
[ROW][C]9[/C][C]4.3[/C][C]4.30227015896043[/C][C]-0.00227015896042693[/C][/ROW]
[ROW][C]10[/C][C]4.8[/C][C]4.14910322405823[/C][C]0.650896775941767[/C][/ROW]
[ROW][C]11[/C][C]4.4[/C][C]4.0912941762099[/C][C]0.308705823790102[/C][/ROW]
[ROW][C]12[/C][C]4.3[/C][C]4.70906161851347[/C][C]-0.409061618513469[/C][/ROW]
[ROW][C]13[/C][C]4.7[/C][C]4.8025993683697[/C][C]-0.102599368369699[/C][/ROW]
[ROW][C]14[/C][C]4.7[/C][C]4.84359123977614[/C][C]-0.143591239776138[/C][/ROW]
[ROW][C]15[/C][C]4.9[/C][C]4.1764937311551[/C][C]0.723506268844896[/C][/ROW]
[ROW][C]16[/C][C]5[/C][C]3.70080502460329[/C][C]1.29919497539671[/C][/ROW]
[ROW][C]17[/C][C]4.2[/C][C]3.97769466932294[/C][C]0.22230533067706[/C][/ROW]
[ROW][C]18[/C][C]4.3[/C][C]4.36671153741641[/C][C]-0.066711537416405[/C][/ROW]
[ROW][C]19[/C][C]4.8[/C][C]4.40713336013534[/C][C]0.392866639864664[/C][/ROW]
[ROW][C]20[/C][C]4.8[/C][C]4.39679817487832[/C][C]0.403201825121683[/C][/ROW]
[ROW][C]21[/C][C]4.8[/C][C]3.87706893605491[/C][C]0.922931063945088[/C][/ROW]
[ROW][C]22[/C][C]4.2[/C][C]3.85097388300776[/C][C]0.349026116992238[/C][/ROW]
[ROW][C]23[/C][C]4.6[/C][C]3.84007924417414[/C][C]0.759920755825856[/C][/ROW]
[ROW][C]24[/C][C]4.8[/C][C]4.21771445163431[/C][C]0.582285548365685[/C][/ROW]
[ROW][C]25[/C][C]4.5[/C][C]4.41398324283317[/C][C]0.086016757166831[/C][/ROW]
[ROW][C]26[/C][C]4.4[/C][C]4.85044168817112[/C][C]-0.45044168817112[/C][/ROW]
[ROW][C]27[/C][C]4.3[/C][C]4.70550836991661[/C][C]-0.405508369916614[/C][/ROW]
[ROW][C]28[/C][C]3.9[/C][C]4.33073344821149[/C][C]-0.430733448211489[/C][/ROW]
[ROW][C]29[/C][C]3.7[/C][C]4.49957977718510[/C][C]-0.799579777185104[/C][/ROW]
[ROW][C]30[/C][C]4[/C][C]4.86817281275843[/C][C]-0.868172812758435[/C][/ROW]
[ROW][C]31[/C][C]4.1[/C][C]4.92673125802403[/C][C]-0.826731258024029[/C][/ROW]
[ROW][C]32[/C][C]3.7[/C][C]5.01601544318607[/C][C]-1.31601544318607[/C][/ROW]
[ROW][C]33[/C][C]3.8[/C][C]4.64441022179967[/C][C]-0.844410221799674[/C][/ROW]
[ROW][C]34[/C][C]3.8[/C][C]4.60356479317716[/C][C]-0.803564793177163[/C][/ROW]
[ROW][C]35[/C][C]3.8[/C][C]4.42298506402813[/C][C]-0.622985064028128[/C][/ROW]
[ROW][C]36[/C][C]3.3[/C][C]4.6339257919255[/C][C]-1.33392579192550[/C][/ROW]
[ROW][C]37[/C][C]3.3[/C][C]4.70849202034763[/C][C]-1.40849202034763[/C][/ROW]
[ROW][C]38[/C][C]3.3[/C][C]5.15600184906594[/C][C]-1.85600184906594[/C][/ROW]
[ROW][C]39[/C][C]3.2[/C][C]5.04279062514214[/C][C]-1.84279062514214[/C][/ROW]
[ROW][C]40[/C][C]3.4[/C][C]4.87329184119218[/C][C]-1.47329184119218[/C][/ROW]
[ROW][C]41[/C][C]4.2[/C][C]4.93971935303372[/C][C]-0.739719353033716[/C][/ROW]
[ROW][C]42[/C][C]4.9[/C][C]5.3576758479807[/C][C]-0.457675847980695[/C][/ROW]
[ROW][C]43[/C][C]5.1[/C][C]5.26599625810569[/C][C]-0.165996258105691[/C][/ROW]
[ROW][C]44[/C][C]5.5[/C][C]5.07180778770661[/C][C]0.428192212293388[/C][/ROW]
[ROW][C]45[/C][C]5.6[/C][C]4.70029168158066[/C][C]0.899708318419343[/C][/ROW]
[ROW][C]46[/C][C]6.4[/C][C]4.9338949912507[/C][C]1.46610500874930[/C][/ROW]
[ROW][C]47[/C][C]6.1[/C][C]5.3066440938797[/C][C]0.793355906120305[/C][/ROW]
[ROW][C]48[/C][C]7.1[/C][C]5.74011750872822[/C][C]1.35988249127178[/C][/ROW]
[ROW][C]49[/C][C]7.8[/C][C]6.05794440767352[/C][C]1.74205559232648[/C][/ROW]
[ROW][C]50[/C][C]7.9[/C][C]5.56111832591909[/C][C]2.33888167408091[/C][/ROW]
[ROW][C]51[/C][C]7.4[/C][C]4.42441291963371[/C][C]2.97558708036629[/C][/ROW]
[ROW][C]52[/C][C]7.5[/C][C]3.9299241007075[/C][C]3.57007589929250[/C][/ROW]
[ROW][C]53[/C][C]6.8[/C][C]4.14420266975708[/C][C]2.65579733024292[/C][/ROW]
[ROW][C]54[/C][C]5.2[/C][C]4.47447603791701[/C][C]0.725523962082986[/C][/ROW]
[ROW][C]55[/C][C]4.7[/C][C]4.60633826577258[/C][C]0.0936617342274224[/C][/ROW]
[ROW][C]56[/C][C]4.1[/C][C]4.0432911423272[/C][C]0.0567088576727956[/C][/ROW]
[ROW][C]57[/C][C]3.9[/C][C]2.57203708954851[/C][C]1.32796291045149[/C][/ROW]
[ROW][C]58[/C][C]2.6[/C][C]2.03286903125433[/C][C]0.567130968745668[/C][/ROW]
[ROW][C]59[/C][C]2.7[/C][C]2.29082682704504[/C][C]0.40917317295496[/C][/ROW]
[ROW][C]60[/C][C]1.8[/C][C]2.62066411920809[/C][C]-0.820664119208088[/C][/ROW]
[ROW][C]61[/C][C]1[/C][C]3.10106728308513[/C][C]-2.10106728308513[/C][/ROW]
[ROW][C]62[/C][C]0.3[/C][C]2.8726973662336[/C][C]-2.5726973662336[/C][/ROW]
[ROW][C]63[/C][C]1.3[/C][C]2.29666903760866[/C][C]-0.996669037608656[/C][/ROW]
[ROW][C]64[/C][C]1[/C][C]1.67623446106161[/C][C]-0.676234461061607[/C][/ROW]
[ROW][C]65[/C][C]1.1[/C][C]1.84956000634913[/C][C]-0.749560006349129[/C][/ROW]
[/TABLE]
Source: https://freestatistics.org/blog/index.php?pk=57823&T=4

Globally Unique Identifier (entire table): ba.freestatistics.org/blog/index.php?pk=57823&T=4

As an alternative you can also use a QR Code:  

The GUIDs for individual cells are displayed in the table below:

Multiple Linear Regression - Actuals, Interpolation, and Residuals
Time or IndexActualsInterpolationForecastResidualsPrediction Error
145.61913302146152-1.61913302146152
24.15.40635198236346-1.30635198236346
344.0041989597947-0.00419895979470014
43.83.250273679843940.549726320156060
54.73.302081942283521.39791805771648
64.34.33798012192557-0.0379801219255748
73.94.9754398349272-1.07543983492720
844.72803879879754-0.728038798797539
94.34.30227015896043-0.00227015896042693
104.84.149103224058230.650896775941767
114.44.09129417620990.308705823790102
124.34.70906161851347-0.409061618513469
134.74.8025993683697-0.102599368369699
144.74.84359123977614-0.143591239776138
154.94.17649373115510.723506268844896
1653.700805024603291.29919497539671
174.23.977694669322940.22230533067706
184.34.36671153741641-0.066711537416405
194.84.407133360135340.392866639864664
204.84.396798174878320.403201825121683
214.83.877068936054910.922931063945088
224.23.850973883007760.349026116992238
234.63.840079244174140.759920755825856
244.84.217714451634310.582285548365685
254.54.413983242833170.086016757166831
264.44.85044168817112-0.45044168817112
274.34.70550836991661-0.405508369916614
283.94.33073344821149-0.430733448211489
293.74.49957977718510-0.799579777185104
3044.86817281275843-0.868172812758435
314.14.92673125802403-0.826731258024029
323.75.01601544318607-1.31601544318607
333.84.64441022179967-0.844410221799674
343.84.60356479317716-0.803564793177163
353.84.42298506402813-0.622985064028128
363.34.6339257919255-1.33392579192550
373.34.70849202034763-1.40849202034763
383.35.15600184906594-1.85600184906594
393.25.04279062514214-1.84279062514214
403.44.87329184119218-1.47329184119218
414.24.93971935303372-0.739719353033716
424.95.3576758479807-0.457675847980695
435.15.26599625810569-0.165996258105691
445.55.071807787706610.428192212293388
455.64.700291681580660.899708318419343
466.44.93389499125071.46610500874930
476.15.30664409387970.793355906120305
487.15.740117508728221.35988249127178
497.86.057944407673521.74205559232648
507.95.561118325919092.33888167408091
517.44.424412919633712.97558708036629
527.53.92992410070753.57007589929250
536.84.144202669757082.65579733024292
545.24.474476037917010.725523962082986
554.74.606338265772580.0936617342274224
564.14.04329114232720.0567088576727956
573.92.572037089548511.32796291045149
582.62.032869031254330.567130968745668
592.72.290826827045040.40917317295496
601.82.62066411920809-0.820664119208088
6113.10106728308513-2.10106728308513
620.32.8726973662336-2.5726973662336
631.32.29666903760866-0.996669037608656
6411.67623446106161-0.676234461061607
651.11.84956000634913-0.749560006349129


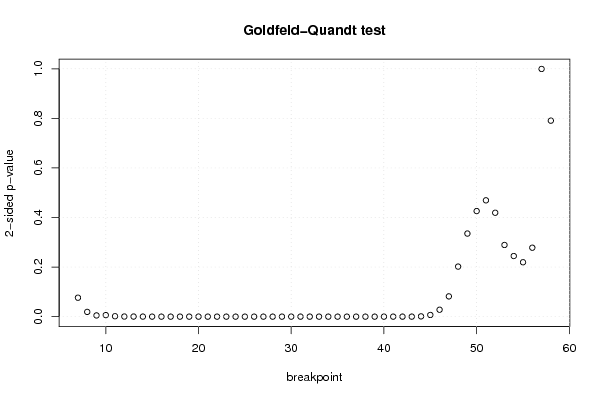
Goldfeld-Quandt test for Heteroskedasticity
p-valuesAlternative Hypothesis
breakpoint indexgreater2-sidedless
70.03820035585478240.07640071170956470.961799644145218
80.00958451169435730.01916902338871460.990415488305643
90.002474112010677490.004948224021354980.997525887989323
100.003139326978837880.006278653957675760.996860673021162
110.0008634088965515530.001726817793103110.999136591103448
120.0002352979099251550.000470595819850310.999764702090075
130.0001620151468960330.0003240302937920660.999837984853104
147.55745005460131e-050.0001511490010920260.999924425499454
153.8222556100105e-057.644511220021e-050.9999617774439
162.3013328374405e-054.602665674881e-050.999976986671626
177.52489073767691e-061.50497814753538e-050.999992475109262
182.00464060762242e-064.00928121524483e-060.999997995359392
199.11897908905251e-071.82379581781050e-060.99999908810209
204.78122044541163e-079.56244089082326e-070.999999521877955
211.49013558943613e-072.98027117887225e-070.99999985098644
228.39931658719764e-081.67986331743953e-070.999999916006834
232.79434886731486e-085.58869773462973e-080.999999972056511
249.28636646067736e-091.85727329213547e-080.999999990713634
252.38237530749269e-094.76475061498538e-090.999999997617625
265.49099651576913e-101.09819930315383e-090.9999999994509
271.33109219573940e-102.66218439147880e-100.99999999986689
281.18342499234472e-102.36684998468943e-100.999999999881658
292.14242090669190e-104.28484181338380e-100.999999999785758
308.49613240463002e-111.69922648092600e-100.999999999915039
312.53846456762846e-115.07692913525693e-110.999999999974615
321.8894917483247e-113.7789834966494e-110.999999999981105
339.90924436742731e-121.98184887348546e-110.99999999999009
344.8595531073117e-129.7191062146234e-120.99999999999514
351.77723058884518e-123.55446117769036e-120.999999999998223
363.65950236524589e-127.31900473049179e-120.99999999999634
374.49461507795451e-128.98923015590901e-120.999999999995505
387.09215643447724e-121.41843128689545e-110.999999999992908
398.62038375709623e-111.72407675141925e-100.999999999913796
405.14980829705661e-101.02996165941132e-090.99999999948502
419.02213103533153e-091.80442620706631e-080.99999999097787
429.40121662064602e-071.88024332412920e-060.999999059878338
432.14330688363471e-054.28661376726942e-050.999978566931164
440.000572330259334610.001144660518669220.999427669740665
450.00340573640041670.00681147280083340.996594263599583
460.01395721319723800.02791442639447590.986042786802762
470.04088630664338010.08177261328676010.95911369335662
480.1009892996002460.2019785992004910.899010700399754
490.1676136661905830.3352273323811660.832386333809417
500.2129940493499280.4259880986998570.787005950650072
510.2346636780682250.469327356136450.765336321931775
520.2095706572070260.4191413144140510.790429342792974
530.1446089494348580.2892178988697170.855391050565142
540.1222897996530850.244579599306170.877710200346915
550.1097410664960700.2194821329921400.89025893350393
560.1390661310241080.2781322620482160.860933868975892
570.499671175424070.999342350848140.50032882457593
580.6046651805251550.790669638949690.395334819474845

\begin{tabular}{lllllllll}
\hline
Goldfeld-Quandt test for Heteroskedasticity \tabularnewline
p-values & Alternative Hypothesis \tabularnewline
breakpoint index & greater & 2-sided & less \tabularnewline
7 & 0.0382003558547824 & 0.0764007117095647 & 0.961799644145218 \tabularnewline
8 & 0.0095845116943573 & 0.0191690233887146 & 0.990415488305643 \tabularnewline
9 & 0.00247411201067749 & 0.00494822402135498 & 0.997525887989323 \tabularnewline
10 & 0.00313932697883788 & 0.00627865395767576 & 0.996860673021162 \tabularnewline
11 & 0.000863408896551553 & 0.00172681779310311 & 0.999136591103448 \tabularnewline
12 & 0.000235297909925155 & 0.00047059581985031 & 0.999764702090075 \tabularnewline
13 & 0.000162015146896033 & 0.000324030293792066 & 0.999837984853104 \tabularnewline
14 & 7.55745005460131e-05 & 0.000151149001092026 & 0.999924425499454 \tabularnewline
15 & 3.8222556100105e-05 & 7.644511220021e-05 & 0.9999617774439 \tabularnewline
16 & 2.3013328374405e-05 & 4.602665674881e-05 & 0.999976986671626 \tabularnewline
17 & 7.52489073767691e-06 & 1.50497814753538e-05 & 0.999992475109262 \tabularnewline
18 & 2.00464060762242e-06 & 4.00928121524483e-06 & 0.999997995359392 \tabularnewline
19 & 9.11897908905251e-07 & 1.82379581781050e-06 & 0.99999908810209 \tabularnewline
20 & 4.78122044541163e-07 & 9.56244089082326e-07 & 0.999999521877955 \tabularnewline
21 & 1.49013558943613e-07 & 2.98027117887225e-07 & 0.99999985098644 \tabularnewline
22 & 8.39931658719764e-08 & 1.67986331743953e-07 & 0.999999916006834 \tabularnewline
23 & 2.79434886731486e-08 & 5.58869773462973e-08 & 0.999999972056511 \tabularnewline
24 & 9.28636646067736e-09 & 1.85727329213547e-08 & 0.999999990713634 \tabularnewline
25 & 2.38237530749269e-09 & 4.76475061498538e-09 & 0.999999997617625 \tabularnewline
26 & 5.49099651576913e-10 & 1.09819930315383e-09 & 0.9999999994509 \tabularnewline
27 & 1.33109219573940e-10 & 2.66218439147880e-10 & 0.99999999986689 \tabularnewline
28 & 1.18342499234472e-10 & 2.36684998468943e-10 & 0.999999999881658 \tabularnewline
29 & 2.14242090669190e-10 & 4.28484181338380e-10 & 0.999999999785758 \tabularnewline
30 & 8.49613240463002e-11 & 1.69922648092600e-10 & 0.999999999915039 \tabularnewline
31 & 2.53846456762846e-11 & 5.07692913525693e-11 & 0.999999999974615 \tabularnewline
32 & 1.8894917483247e-11 & 3.7789834966494e-11 & 0.999999999981105 \tabularnewline
33 & 9.90924436742731e-12 & 1.98184887348546e-11 & 0.99999999999009 \tabularnewline
34 & 4.8595531073117e-12 & 9.7191062146234e-12 & 0.99999999999514 \tabularnewline
35 & 1.77723058884518e-12 & 3.55446117769036e-12 & 0.999999999998223 \tabularnewline
36 & 3.65950236524589e-12 & 7.31900473049179e-12 & 0.99999999999634 \tabularnewline
37 & 4.49461507795451e-12 & 8.98923015590901e-12 & 0.999999999995505 \tabularnewline
38 & 7.09215643447724e-12 & 1.41843128689545e-11 & 0.999999999992908 \tabularnewline
39 & 8.62038375709623e-11 & 1.72407675141925e-10 & 0.999999999913796 \tabularnewline
40 & 5.14980829705661e-10 & 1.02996165941132e-09 & 0.99999999948502 \tabularnewline
41 & 9.02213103533153e-09 & 1.80442620706631e-08 & 0.99999999097787 \tabularnewline
42 & 9.40121662064602e-07 & 1.88024332412920e-06 & 0.999999059878338 \tabularnewline
43 & 2.14330688363471e-05 & 4.28661376726942e-05 & 0.999978566931164 \tabularnewline
44 & 0.00057233025933461 & 0.00114466051866922 & 0.999427669740665 \tabularnewline
45 & 0.0034057364004167 & 0.0068114728008334 & 0.996594263599583 \tabularnewline
46 & 0.0139572131972380 & 0.0279144263944759 & 0.986042786802762 \tabularnewline
47 & 0.0408863066433801 & 0.0817726132867601 & 0.95911369335662 \tabularnewline
48 & 0.100989299600246 & 0.201978599200491 & 0.899010700399754 \tabularnewline
49 & 0.167613666190583 & 0.335227332381166 & 0.832386333809417 \tabularnewline
50 & 0.212994049349928 & 0.425988098699857 & 0.787005950650072 \tabularnewline
51 & 0.234663678068225 & 0.46932735613645 & 0.765336321931775 \tabularnewline
52 & 0.209570657207026 & 0.419141314414051 & 0.790429342792974 \tabularnewline
53 & 0.144608949434858 & 0.289217898869717 & 0.855391050565142 \tabularnewline
54 & 0.122289799653085 & 0.24457959930617 & 0.877710200346915 \tabularnewline
55 & 0.109741066496070 & 0.219482132992140 & 0.89025893350393 \tabularnewline
56 & 0.139066131024108 & 0.278132262048216 & 0.860933868975892 \tabularnewline
57 & 0.49967117542407 & 0.99934235084814 & 0.50032882457593 \tabularnewline
58 & 0.604665180525155 & 0.79066963894969 & 0.395334819474845 \tabularnewline
\hline
\end{tabular}
%Source: https://freestatistics.org/blog/index.php?pk=57823&T=5

[TABLE]
[ROW][C]Goldfeld-Quandt test for Heteroskedasticity[/C][/ROW]
[ROW][C]p-values[/C][C]Alternative Hypothesis[/C][/ROW]
[ROW][C]breakpoint index[/C][C]greater[/C][C]2-sided[/C][C]less[/C][/ROW]
[ROW][C]7[/C][C]0.0382003558547824[/C][C]0.0764007117095647[/C][C]0.961799644145218[/C][/ROW]
[ROW][C]8[/C][C]0.0095845116943573[/C][C]0.0191690233887146[/C][C]0.990415488305643[/C][/ROW]
[ROW][C]9[/C][C]0.00247411201067749[/C][C]0.00494822402135498[/C][C]0.997525887989323[/C][/ROW]
[ROW][C]10[/C][C]0.00313932697883788[/C][C]0.00627865395767576[/C][C]0.996860673021162[/C][/ROW]
[ROW][C]11[/C][C]0.000863408896551553[/C][C]0.00172681779310311[/C][C]0.999136591103448[/C][/ROW]
[ROW][C]12[/C][C]0.000235297909925155[/C][C]0.00047059581985031[/C][C]0.999764702090075[/C][/ROW]
[ROW][C]13[/C][C]0.000162015146896033[/C][C]0.000324030293792066[/C][C]0.999837984853104[/C][/ROW]
[ROW][C]14[/C][C]7.55745005460131e-05[/C][C]0.000151149001092026[/C][C]0.999924425499454[/C][/ROW]
[ROW][C]15[/C][C]3.8222556100105e-05[/C][C]7.644511220021e-05[/C][C]0.9999617774439[/C][/ROW]
[ROW][C]16[/C][C]2.3013328374405e-05[/C][C]4.602665674881e-05[/C][C]0.999976986671626[/C][/ROW]
[ROW][C]17[/C][C]7.52489073767691e-06[/C][C]1.50497814753538e-05[/C][C]0.999992475109262[/C][/ROW]
[ROW][C]18[/C][C]2.00464060762242e-06[/C][C]4.00928121524483e-06[/C][C]0.999997995359392[/C][/ROW]
[ROW][C]19[/C][C]9.11897908905251e-07[/C][C]1.82379581781050e-06[/C][C]0.99999908810209[/C][/ROW]
[ROW][C]20[/C][C]4.78122044541163e-07[/C][C]9.56244089082326e-07[/C][C]0.999999521877955[/C][/ROW]
[ROW][C]21[/C][C]1.49013558943613e-07[/C][C]2.98027117887225e-07[/C][C]0.99999985098644[/C][/ROW]
[ROW][C]22[/C][C]8.39931658719764e-08[/C][C]1.67986331743953e-07[/C][C]0.999999916006834[/C][/ROW]
[ROW][C]23[/C][C]2.79434886731486e-08[/C][C]5.58869773462973e-08[/C][C]0.999999972056511[/C][/ROW]
[ROW][C]24[/C][C]9.28636646067736e-09[/C][C]1.85727329213547e-08[/C][C]0.999999990713634[/C][/ROW]
[ROW][C]25[/C][C]2.38237530749269e-09[/C][C]4.76475061498538e-09[/C][C]0.999999997617625[/C][/ROW]
[ROW][C]26[/C][C]5.49099651576913e-10[/C][C]1.09819930315383e-09[/C][C]0.9999999994509[/C][/ROW]
[ROW][C]27[/C][C]1.33109219573940e-10[/C][C]2.66218439147880e-10[/C][C]0.99999999986689[/C][/ROW]
[ROW][C]28[/C][C]1.18342499234472e-10[/C][C]2.36684998468943e-10[/C][C]0.999999999881658[/C][/ROW]
[ROW][C]29[/C][C]2.14242090669190e-10[/C][C]4.28484181338380e-10[/C][C]0.999999999785758[/C][/ROW]
[ROW][C]30[/C][C]8.49613240463002e-11[/C][C]1.69922648092600e-10[/C][C]0.999999999915039[/C][/ROW]
[ROW][C]31[/C][C]2.53846456762846e-11[/C][C]5.07692913525693e-11[/C][C]0.999999999974615[/C][/ROW]
[ROW][C]32[/C][C]1.8894917483247e-11[/C][C]3.7789834966494e-11[/C][C]0.999999999981105[/C][/ROW]
[ROW][C]33[/C][C]9.90924436742731e-12[/C][C]1.98184887348546e-11[/C][C]0.99999999999009[/C][/ROW]
[ROW][C]34[/C][C]4.8595531073117e-12[/C][C]9.7191062146234e-12[/C][C]0.99999999999514[/C][/ROW]
[ROW][C]35[/C][C]1.77723058884518e-12[/C][C]3.55446117769036e-12[/C][C]0.999999999998223[/C][/ROW]
[ROW][C]36[/C][C]3.65950236524589e-12[/C][C]7.31900473049179e-12[/C][C]0.99999999999634[/C][/ROW]
[ROW][C]37[/C][C]4.49461507795451e-12[/C][C]8.98923015590901e-12[/C][C]0.999999999995505[/C][/ROW]
[ROW][C]38[/C][C]7.09215643447724e-12[/C][C]1.41843128689545e-11[/C][C]0.999999999992908[/C][/ROW]
[ROW][C]39[/C][C]8.62038375709623e-11[/C][C]1.72407675141925e-10[/C][C]0.999999999913796[/C][/ROW]
[ROW][C]40[/C][C]5.14980829705661e-10[/C][C]1.02996165941132e-09[/C][C]0.99999999948502[/C][/ROW]
[ROW][C]41[/C][C]9.02213103533153e-09[/C][C]1.80442620706631e-08[/C][C]0.99999999097787[/C][/ROW]
[ROW][C]42[/C][C]9.40121662064602e-07[/C][C]1.88024332412920e-06[/C][C]0.999999059878338[/C][/ROW]
[ROW][C]43[/C][C]2.14330688363471e-05[/C][C]4.28661376726942e-05[/C][C]0.999978566931164[/C][/ROW]
[ROW][C]44[/C][C]0.00057233025933461[/C][C]0.00114466051866922[/C][C]0.999427669740665[/C][/ROW]
[ROW][C]45[/C][C]0.0034057364004167[/C][C]0.0068114728008334[/C][C]0.996594263599583[/C][/ROW]
[ROW][C]46[/C][C]0.0139572131972380[/C][C]0.0279144263944759[/C][C]0.986042786802762[/C][/ROW]
[ROW][C]47[/C][C]0.0408863066433801[/C][C]0.0817726132867601[/C][C]0.95911369335662[/C][/ROW]
[ROW][C]48[/C][C]0.100989299600246[/C][C]0.201978599200491[/C][C]0.899010700399754[/C][/ROW]
[ROW][C]49[/C][C]0.167613666190583[/C][C]0.335227332381166[/C][C]0.832386333809417[/C][/ROW]
[ROW][C]50[/C][C]0.212994049349928[/C][C]0.425988098699857[/C][C]0.787005950650072[/C][/ROW]
[ROW][C]51[/C][C]0.234663678068225[/C][C]0.46932735613645[/C][C]0.765336321931775[/C][/ROW]
[ROW][C]52[/C][C]0.209570657207026[/C][C]0.419141314414051[/C][C]0.790429342792974[/C][/ROW]
[ROW][C]53[/C][C]0.144608949434858[/C][C]0.289217898869717[/C][C]0.855391050565142[/C][/ROW]
[ROW][C]54[/C][C]0.122289799653085[/C][C]0.24457959930617[/C][C]0.877710200346915[/C][/ROW]
[ROW][C]55[/C][C]0.109741066496070[/C][C]0.219482132992140[/C][C]0.89025893350393[/C][/ROW]
[ROW][C]56[/C][C]0.139066131024108[/C][C]0.278132262048216[/C][C]0.860933868975892[/C][/ROW]
[ROW][C]57[/C][C]0.49967117542407[/C][C]0.99934235084814[/C][C]0.50032882457593[/C][/ROW]
[ROW][C]58[/C][C]0.604665180525155[/C][C]0.79066963894969[/C][C]0.395334819474845[/C][/ROW]
[/TABLE]
Source: https://freestatistics.org/blog/index.php?pk=57823&T=5

Globally Unique Identifier (entire table): ba.freestatistics.org/blog/index.php?pk=57823&T=5

As an alternative you can also use a QR Code:  

The GUIDs for individual cells are displayed in the table below:

Goldfeld-Quandt test for Heteroskedasticity
p-valuesAlternative Hypothesis
breakpoint indexgreater2-sidedless
70.03820035585478240.07640071170956470.961799644145218
80.00958451169435730.01916902338871460.990415488305643
90.002474112010677490.004948224021354980.997525887989323
100.003139326978837880.006278653957675760.996860673021162
110.0008634088965515530.001726817793103110.999136591103448
120.0002352979099251550.000470595819850310.999764702090075
130.0001620151468960330.0003240302937920660.999837984853104
147.55745005460131e-050.0001511490010920260.999924425499454
153.8222556100105e-057.644511220021e-050.9999617774439
162.3013328374405e-054.602665674881e-050.999976986671626
177.52489073767691e-061.50497814753538e-050.999992475109262
182.00464060762242e-064.00928121524483e-060.999997995359392
199.11897908905251e-071.82379581781050e-060.99999908810209
204.78122044541163e-079.56244089082326e-070.999999521877955
211.49013558943613e-072.98027117887225e-070.99999985098644
228.39931658719764e-081.67986331743953e-070.999999916006834
232.79434886731486e-085.58869773462973e-080.999999972056511
249.28636646067736e-091.85727329213547e-080.999999990713634
252.38237530749269e-094.76475061498538e-090.999999997617625
265.49099651576913e-101.09819930315383e-090.9999999994509
271.33109219573940e-102.66218439147880e-100.99999999986689
281.18342499234472e-102.36684998468943e-100.999999999881658
292.14242090669190e-104.28484181338380e-100.999999999785758
308.49613240463002e-111.69922648092600e-100.999999999915039
312.53846456762846e-115.07692913525693e-110.999999999974615
321.8894917483247e-113.7789834966494e-110.999999999981105
339.90924436742731e-121.98184887348546e-110.99999999999009
344.8595531073117e-129.7191062146234e-120.99999999999514
351.77723058884518e-123.55446117769036e-120.999999999998223
363.65950236524589e-127.31900473049179e-120.99999999999634
374.49461507795451e-128.98923015590901e-120.999999999995505
387.09215643447724e-121.41843128689545e-110.999999999992908
398.62038375709623e-111.72407675141925e-100.999999999913796
405.14980829705661e-101.02996165941132e-090.99999999948502
419.02213103533153e-091.80442620706631e-080.99999999097787
429.40121662064602e-071.88024332412920e-060.999999059878338
432.14330688363471e-054.28661376726942e-050.999978566931164
440.000572330259334610.001144660518669220.999427669740665
450.00340573640041670.00681147280083340.996594263599583
460.01395721319723800.02791442639447590.986042786802762
470.04088630664338010.08177261328676010.95911369335662
480.1009892996002460.2019785992004910.899010700399754
490.1676136661905830.3352273323811660.832386333809417
500.2129940493499280.4259880986998570.787005950650072
510.2346636780682250.469327356136450.765336321931775
520.2095706572070260.4191413144140510.790429342792974
530.1446089494348580.2892178988697170.855391050565142
540.1222897996530850.244579599306170.877710200346915
550.1097410664960700.2194821329921400.89025893350393
560.1390661310241080.2781322620482160.860933868975892
570.499671175424070.999342350848140.50032882457593
580.6046651805251550.790669638949690.395334819474845


Meta Analysis of Goldfeld-Quandt test for Heteroskedasticity
Description# significant tests% significant testsOK/NOK
1% type I error level370.711538461538462NOK
5% type I error level390.75NOK
10% type I error level410.788461538461538NOK

\begin{tabular}{lllllllll}
\hline
Meta Analysis of Goldfeld-Quandt test for Heteroskedasticity \tabularnewline
Description & # significant tests & % significant tests & OK/NOK \tabularnewline
1% type I error level & 37 & 0.711538461538462 & NOK \tabularnewline
5% type I error level & 39 & 0.75 & NOK \tabularnewline
10% type I error level & 41 & 0.788461538461538 & NOK \tabularnewline
\hline
\end{tabular}
%Source: https://freestatistics.org/blog/index.php?pk=57823&T=6

[TABLE]
[ROW][C]Meta Analysis of Goldfeld-Quandt test for Heteroskedasticity[/C][/ROW]
[ROW][C]Description[/C][C]# significant tests[/C][C]% significant tests[/C][C]OK/NOK[/C][/ROW]
[ROW][C]1% type I error level[/C][C]37[/C][C]0.711538461538462[/C][C]NOK[/C][/ROW]
[ROW][C]5% type I error level[/C][C]39[/C][C]0.75[/C][C]NOK[/C][/ROW]
[ROW][C]10% type I error level[/C][C]41[/C][C]0.788461538461538[/C][C]NOK[/C][/ROW]
[/TABLE]
Source: https://freestatistics.org/blog/index.php?pk=57823&T=6

Globally Unique Identifier (entire table): ba.freestatistics.org/blog/index.php?pk=57823&T=6

As an alternative you can also use a QR Code:  

The GUIDs for individual cells are displayed in the table below:

Meta Analysis of Goldfeld-Quandt test for Heteroskedasticity
Description# significant tests% significant testsOK/NOK
1% type I error level370.711538461538462NOK
5% type I error level390.75NOK
10% type I error level410.788461538461538NOK


Parameters (Session):
par1 = 1 ; par2 = Do not include Seasonal Dummies ; par3 = No Linear Trend ;
Parameters (R input):
par1 = 1 ; par2 = Do not include Seasonal Dummies ; par3 = No Linear Trend ;
R code (references can be found in the software module):
library(lattice)
library(lmtest)
n25 <- 25 #minimum number of obs. for Goldfeld-Quandt test
par1 <- as.numeric(par1)
x <- t(y)
k <- length(x[1,])
n <- length(x[,1])
x1 <- cbind(x[,par1], x[,1:k!=par1])
mycolnames <- c(colnames(x)[par1], colnames(x)[1:k!=par1])
colnames(x1) <- mycolnames #colnames(x)[par1]
x <- x1
if (par3 == 'First Differences'){
x2 <- array(0, dim=c(n-1,k), dimnames=list(1:(n-1), paste('(1-B)',colnames(x),sep='')))
for (i in 1:n-1) {
for (j in 1:k) {
x2[i,j] <- x[i+1,j] - x[i,j]
}
}
x <- x2
}
if (par2 == 'Include Monthly Dummies'){
x2 <- array(0, dim=c(n,11), dimnames=list(1:n, paste('M', seq(1:11), sep ='')))
for (i in 1:11){
x2[seq(i,n,12),i] <- 1
}
x <- cbind(x, x2)
}
if (par2 == 'Include Quarterly Dummies'){
x2 <- array(0, dim=c(n,3), dimnames=list(1:n, paste('Q', seq(1:3), sep ='')))
for (i in 1:3){
x2[seq(i,n,4),i] <- 1
}
x <- cbind(x, x2)
}
k <- length(x[1,])
if (par3 == 'Linear Trend'){
x <- cbind(x, c(1:n))
colnames(x)[k+1] <- 't'
}
x
k <- length(x[1,])
df <- as.data.frame(x)
(mylm <- lm(df))
(mysum <- summary(mylm))
if (n > n25) {
kp3 <- k + 3
nmkm3 <- n - k - 3
gqarr <- array(NA, dim=c(nmkm3-kp3+1,3))
numgqtests <- 0
numsignificant1 <- 0
numsignificant5 <- 0
numsignificant10 <- 0
for (mypoint in kp3:nmkm3) {
j <- 0
numgqtests <- numgqtests + 1
for (myalt in c('greater', 'two.sided', 'less')) {
j <- j + 1
gqarr[mypoint-kp3+1,j] <- gqtest(mylm, point=mypoint, alternative=myalt)$p.value
}
if (gqarr[mypoint-kp3+1,2] < 0.01) numsignificant1 <- numsignificant1 + 1
if (gqarr[mypoint-kp3+1,2] < 0.05) numsignificant5 <- numsignificant5 + 1
if (gqarr[mypoint-kp3+1,2] < 0.10) numsignificant10 <- numsignificant10 + 1
}
gqarr
}
bitmap(file='test0.png')
plot(x[,1], type='l', main='Actuals and Interpolation', ylab='value of Actuals and Interpolation (dots)', xlab='time or index')
points(x[,1]-mysum$resid)
grid()
dev.off()
bitmap(file='test1.png')
plot(mysum$resid, type='b', pch=19, main='Residuals', ylab='value of Residuals', xlab='time or index')
grid()
dev.off()
bitmap(file='test2.png')
hist(mysum$resid, main='Residual Histogram', xlab='values of Residuals')
grid()
dev.off()
bitmap(file='test3.png')
densityplot(~mysum$resid,col='black',main='Residual Density Plot', xlab='values of Residuals')
dev.off()
bitmap(file='test4.png')
qqnorm(mysum$resid, main='Residual Normal Q-Q Plot')
qqline(mysum$resid)
grid()
dev.off()
(myerror <- as.ts(mysum$resid))
bitmap(file='test5.png')
dum <- cbind(lag(myerror,k=1),myerror)
dum
dum1 <- dum[2:length(myerror),]
dum1
z <- as.data.frame(dum1)
z
plot(z,main=paste('Residual Lag plot, lowess, and regression line'), ylab='values of Residuals', xlab='lagged values of Residuals')
lines(lowess(z))
abline(lm(z))
grid()
dev.off()
bitmap(file='test6.png')
acf(mysum$resid, lag.max=length(mysum$resid)/2, main='Residual Autocorrelation Function')
grid()
dev.off()
bitmap(file='test7.png')
pacf(mysum$resid, lag.max=length(mysum$resid)/2, main='Residual Partial Autocorrelation Function')
grid()
dev.off()
bitmap(file='test8.png')
opar <- par(mfrow = c(2,2), oma = c(0, 0, 1.1, 0))
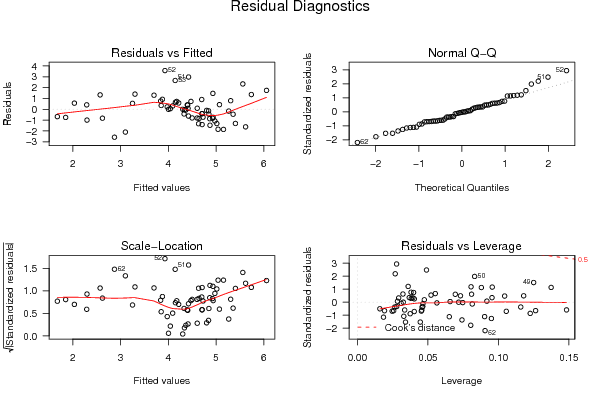
plot(mylm, las = 1, sub='Residual Diagnostics')
par(opar)
dev.off()
if (n > n25) {
bitmap(file='test9.png')
plot(kp3:nmkm3,gqarr[,2], main='Goldfeld-Quandt test',ylab='2-sided p-value',xlab='breakpoint')
grid()
dev.off()
}
load(file='createtable')
a<-table.start()
a<-table.row.start(a)
a<-table.element(a, 'Multiple Linear Regression - Estimated Regression Equation', 1, TRUE)
a<-table.row.end(a)
myeq <- colnames(x)[1]
myeq <- paste(myeq, '[t] = ', sep='')
for (i in 1:k){
if (mysum$coefficients[i,1] > 0) myeq <- paste(myeq, '+', '')
myeq <- paste(myeq, mysum$coefficients[i,1], sep=' ')
if (rownames(mysum$coefficients)[i] != '(Intercept)') {
myeq <- paste(myeq, rownames(mysum$coefficients)[i], sep='')
if (rownames(mysum$coefficients)[i] != 't') myeq <- paste(myeq, '[t]', sep='')
}
}
myeq <- paste(myeq, ' + e[t]')
a<-table.row.start(a)
a<-table.element(a, myeq)
a<-table.row.end(a)
a<-table.end(a)
table.save(a,file='mytable1.tab')
a<-table.start()
a<-table.row.start(a)
a<-table.element(a,hyperlink('ols1.htm','Multiple Linear Regression - Ordinary Least Squares',''), 6, TRUE)
a<-table.row.end(a)
a<-table.row.start(a)
a<-table.element(a,'Variable',header=TRUE)
a<-table.element(a,'Parameter',header=TRUE)
a<-table.element(a,'S.D.',header=TRUE)
a<-table.element(a,'T-STAT
H0: parameter = 0',header=TRUE)
a<-table.element(a,'2-tail p-value',header=TRUE)
a<-table.element(a,'1-tail p-value',header=TRUE)
a<-table.row.end(a)
for (i in 1:k){
a<-table.row.start(a)
a<-table.element(a,rownames(mysum$coefficients)[i],header=TRUE)
a<-table.element(a,mysum$coefficients[i,1])
a<-table.element(a, round(mysum$coefficients[i,2],6))
a<-table.element(a, round(mysum$coefficients[i,3],4))
a<-table.element(a, round(mysum$coefficients[i,4],6))
a<-table.element(a, round(mysum$coefficients[i,4]/2,6))
a<-table.row.end(a)
}
a<-table.end(a)
table.save(a,file='mytable2.tab')
a<-table.start()
a<-table.row.start(a)
a<-table.element(a, 'Multiple Linear Regression - Regression Statistics', 2, TRUE)
a<-table.row.end(a)
a<-table.row.start(a)
a<-table.element(a, 'Multiple R',1,TRUE)
a<-table.element(a, sqrt(mysum$r.squared))
a<-table.row.end(a)
a<-table.row.start(a)
a<-table.element(a, 'R-squared',1,TRUE)
a<-table.element(a, mysum$r.squared)
a<-table.row.end(a)
a<-table.row.start(a)
a<-table.element(a, 'Adjusted R-squared',1,TRUE)
a<-table.element(a, mysum$adj.r.squared)
a<-table.row.end(a)
a<-table.row.start(a)
a<-table.element(a, 'F-TEST (value)',1,TRUE)
a<-table.element(a, mysum$fstatistic[1])
a<-table.row.end(a)
a<-table.row.start(a)
a<-table.element(a, 'F-TEST (DF numerator)',1,TRUE)
a<-table.element(a, mysum$fstatistic[2])
a<-table.row.end(a)
a<-table.row.start(a)
a<-table.element(a, 'F-TEST (DF denominator)',1,TRUE)
a<-table.element(a, mysum$fstatistic[3])
a<-table.row.end(a)
a<-table.row.start(a)
a<-table.element(a, 'p-value',1,TRUE)
a<-table.element(a, 1-pf(mysum$fstatistic[1],mysum$fstatistic[2],mysum$fstatistic[3]))
a<-table.row.end(a)
a<-table.row.start(a)
a<-table.element(a, 'Multiple Linear Regression - Residual Statistics', 2, TRUE)
a<-table.row.end(a)
a<-table.row.start(a)
a<-table.element(a, 'Residual Standard Deviation',1,TRUE)
a<-table.element(a, mysum$sigma)
a<-table.row.end(a)
a<-table.row.start(a)
a<-table.element(a, 'Sum Squared Residuals',1,TRUE)
a<-table.element(a, sum(myerror*myerror))
a<-table.row.end(a)
a<-table.end(a)
table.save(a,file='mytable3.tab')
a<-table.start()
a<-table.row.start(a)
a<-table.element(a, 'Multiple Linear Regression - Actuals, Interpolation, and Residuals', 4, TRUE)
a<-table.row.end(a)
a<-table.row.start(a)
a<-table.element(a, 'Time or Index', 1, TRUE)
a<-table.element(a, 'Actuals', 1, TRUE)
a<-table.element(a, 'Interpolation
Forecast', 1, TRUE)
a<-table.element(a, 'Residuals
Prediction Error', 1, TRUE)
a<-table.row.end(a)
for (i in 1:n) {
a<-table.row.start(a)
a<-table.element(a,i, 1, TRUE)
a<-table.element(a,x[i])
a<-table.element(a,x[i]-mysum$resid[i])
a<-table.element(a,mysum$resid[i])
a<-table.row.end(a)
}
a<-table.end(a)
table.save(a,file='mytable4.tab')
if (n > n25) {
a<-table.start()
a<-table.row.start(a)
a<-table.element(a,'Goldfeld-Quandt test for Heteroskedasticity',4,TRUE)
a<-table.row.end(a)
a<-table.row.start(a)
a<-table.element(a,'p-values',header=TRUE)
a<-table.element(a,'Alternative Hypothesis',3,header=TRUE)
a<-table.row.end(a)
a<-table.row.start(a)
a<-table.element(a,'breakpoint index',header=TRUE)
a<-table.element(a,'greater',header=TRUE)
a<-table.element(a,'2-sided',header=TRUE)
a<-table.element(a,'less',header=TRUE)
a<-table.row.end(a)
for (mypoint in kp3:nmkm3) {
a<-table.row.start(a)
a<-table.element(a,mypoint,header=TRUE)
a<-table.element(a,gqarr[mypoint-kp3+1,1])
a<-table.element(a,gqarr[mypoint-kp3+1,2])
a<-table.element(a,gqarr[mypoint-kp3+1,3])
a<-table.row.end(a)
}
a<-table.end(a)
table.save(a,file='mytable5.tab')
a<-table.start()
a<-table.row.start(a)
a<-table.element(a,'Meta Analysis of Goldfeld-Quandt test for Heteroskedasticity',4,TRUE)
a<-table.row.end(a)
a<-table.row.start(a)
a<-table.element(a,'Description',header=TRUE)
a<-table.element(a,'# significant tests',header=TRUE)
a<-table.element(a,'% significant tests',header=TRUE)
a<-table.element(a,'OK/NOK',header=TRUE)
a<-table.row.end(a)
a<-table.row.start(a)
a<-table.element(a,'1% type I error level',header=TRUE)
a<-table.element(a,numsignificant1)
a<-table.element(a,numsignificant1/numgqtests)
if (numsignificant1/numgqtests < 0.01) dum <- 'OK' else dum <- 'NOK'
a<-table.element(a,dum)
a<-table.row.end(a)
a<-table.row.start(a)
a<-table.element(a,'5% type I error level',header=TRUE)
a<-table.element(a,numsignificant5)
a<-table.element(a,numsignificant5/numgqtests)
if (numsignificant5/numgqtests < 0.05) dum <- 'OK' else dum <- 'NOK'
a<-table.element(a,dum)
a<-table.row.end(a)
a<-table.row.start(a)
a<-table.element(a,'10% type I error level',header=TRUE)
a<-table.element(a,numsignificant10)
a<-table.element(a,numsignificant10/numgqtests)
if (numsignificant10/numgqtests < 0.1) dum <- 'OK' else dum <- 'NOK'
a<-table.element(a,dum)
a<-table.row.end(a)
a<-table.end(a)
table.save(a,file='mytable6.tab')
}