| Multiple Linear Regression - Estimated Regression Equation |
| Y[t] = + 2.16415698290064 -1.27984653729293X[t] + 2.05394600247998Y1[t] -1.72849331883367Y2[t] + 0.670044338186338Y3[t] -0.0341379716604865Y4[t] + 0.00238579303693468t + e[t] |
| Multiple Linear Regression - Ordinary Least Squares | |||||
| Variable | Parameter | S.D. | T-STAT H0: parameter = 0 | 2-tail p-value | 1-tail p-value |
| (Intercept) | 2.16415698290064 | 0.954132 | 2.2682 | 0.027669 | 0.013835 |
| X | -1.27984653729293 | 0.360586 | -3.5493 | 0.000851 | 0.000426 |
| Y1 | 2.05394600247998 | 0.136137 | 15.0874 | 0 | 0 |
| Y2 | -1.72849331883367 | 0.302339 | -5.7171 | 1e-06 | 0 |
| Y3 | 0.670044338186338 | 0.294646 | 2.2741 | 0.027288 | 0.013644 |
| Y4 | -0.0341379716604865 | 0.126848 | -0.2691 | 0.78894 | 0.39447 |
| t | 0.00238579303693468 | 0.012017 | 0.1985 | 0.843435 | 0.421718 |
| Multiple Linear Regression - Regression Statistics | |
| Multiple R | 0.99880042950019 |
| R-squared | 0.997602297969763 |
| Adjusted R-squared | 0.997314573726135 |
| F-TEST (value) | 3467.216684243 |
| F-TEST (DF numerator) | 6 |
| F-TEST (DF denominator) | 50 |
| p-value | 0 |
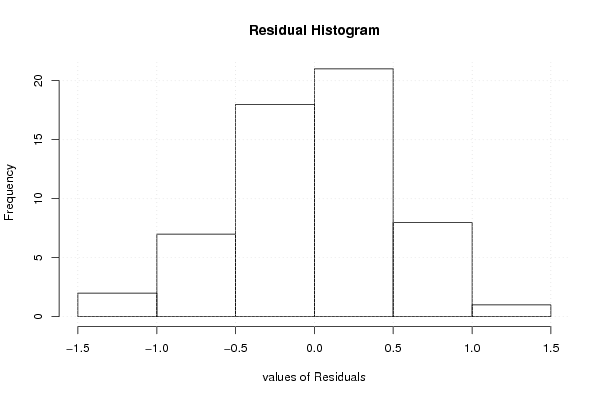
| Multiple Linear Regression - Residual Statistics | |
| Residual Standard Deviation | 0.52899962131653 |
| Sum Squared Residuals | 13.9920299676516 |
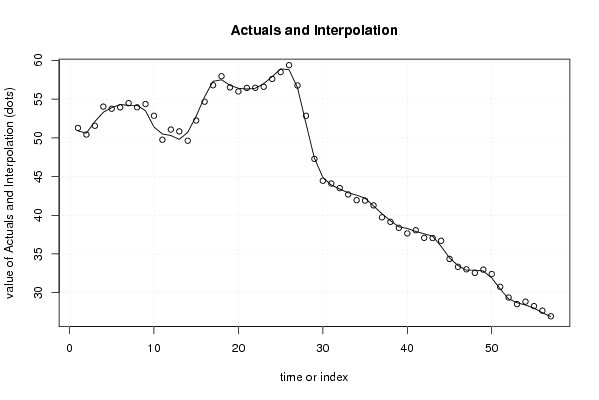
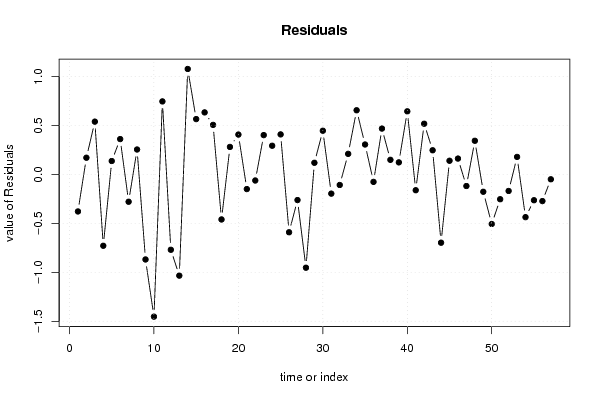
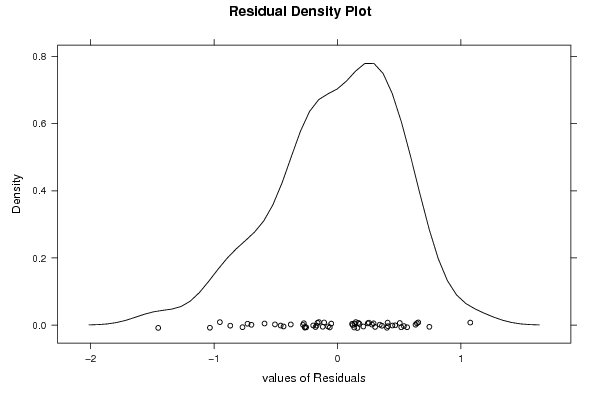
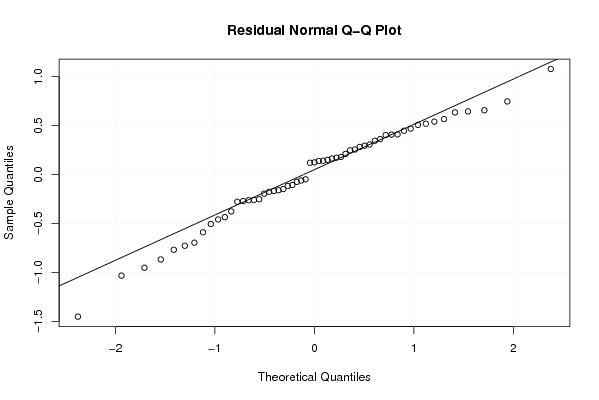
| Multiple Linear Regression - Actuals, Interpolation, and Residuals | |||
| Time or Index | Actuals | Interpolation Forecast | Residuals Prediction Error |
| 1 | 50.9 | 51.278336976999 | -0.378336976999010 |
| 2 | 50.6 | 50.4298855122953 | 0.170114487704693 |
| 3 | 52.1 | 51.5612479342902 | 0.538752065709812 |
| 4 | 53.3 | 54.0287106584488 | -0.728710658448789 |
| 5 | 53.9 | 53.7635267237442 | 0.136473276255827 |
| 6 | 54.3 | 53.9393960344464 | 0.360603965553641 |
| 7 | 54.2 | 54.479110485508 | -0.279110485507947 |
| 8 | 54.2 | 53.9457653876827 | 0.254234612317348 |
| 9 | 53.5 | 54.3685354648812 | -0.868535464881188 |
| 10 | 51.4 | 52.8524994336993 | -1.45249943369931 |
| 11 | 50.5 | 49.7549577418779 | 0.745042258122101 |
| 12 | 50.3 | 51.0695970655031 | -0.76959706550312 |
| 13 | 49.8 | 50.8336411149654 | -1.03364111496538 |
| 14 | 50.7 | 49.6234024066484 | 1.07659759335162 |
| 15 | 52.8 | 52.2353015681913 | 0.564698431808687 |
| 16 | 55.3 | 54.6671354047248 | 0.632864595275185 |
| 17 | 57.3 | 56.794659124609 | 0.505340875391039 |
| 18 | 57.5 | 57.9600725612186 | -0.460072561218556 |
| 19 | 56.8 | 56.519682022063 | 0.280317977937017 |
| 20 | 56.4 | 55.9933506968186 | 0.406649303181353 |
| 21 | 56.3 | 56.4498363363635 | -0.149836336363460 |
| 22 | 56.4 | 56.4623662256233 | -0.0623662256233217 |
| 23 | 57 | 56.5988747956794 | 0.401125204320569 |
| 24 | 57.9 | 57.6074296131665 | 0.292570386833451 |
| 25 | 58.9 | 58.4916890481199 | 0.408310951880054 |
| 26 | 58.8 | 59.3909896624323 | -0.590989662432319 |
| 27 | 56.5 | 56.7621981204661 | -0.262198120466067 |
| 28 | 51.9 | 52.8526776033743 | -0.952677603374322 |
| 29 | 47.4 | 47.2813040128417 | 0.118695987158349 |
| 30 | 44.9 | 44.454313880691 | 0.445686119308982 |
| 31 | 43.9 | 44.0963679814415 | -0.196367981441466 |
| 32 | 43.4 | 43.5078762168823 | -0.107876216882307 |
| 33 | 42.9 | 42.6902923545193 | 0.209707645480736 |
| 34 | 42.6 | 41.9452523966979 | 0.654747603302083 |
| 35 | 42.2 | 41.894816850975 | 0.305183149024988 |
| 36 | 41.2 | 41.2762190554071 | -0.076219055407127 |
| 37 | 40.2 | 39.7321118578719 | 0.467888142128111 |
| 38 | 39.3 | 39.1512686234861 | 0.148731376513872 |
| 39 | 38.5 | 38.3772071836026 | 0.122792816397411 |
| 40 | 38.3 | 37.65617379508 | 0.643826204919994 |
| 41 | 37.9 | 38.0616631099806 | -0.161663109980644 |
| 42 | 37.6 | 37.0828578697377 | 0.517142130262305 |
| 43 | 37.3 | 37.0537586992552 | 0.246241300744770 |
| 44 | 36 | 36.6973185462558 | -0.697318546255817 |
| 45 | 34.5 | 34.3607644189272 | 0.139235581072815 |
| 46 | 33.5 | 33.3385006127702 | 0.161499387229848 |
| 47 | 32.9 | 33.0188641334335 | -0.118864133433515 |
| 48 | 32.9 | 32.5566884996953 | 0.343311500304746 |
| 49 | 32.8 | 32.9773329033368 | -0.177332903336784 |
| 50 | 31.9 | 32.4064354648744 | -0.506435464874398 |
| 51 | 30.5 | 30.753601970559 | -0.253601970559012 |
| 52 | 29.2 | 29.3691029132556 | -0.169102913255641 |
| 53 | 28.7 | 28.5216234422341 | 0.178376557765923 |
| 54 | 28.4 | 28.8367396495484 | -0.436739649548355 |
| 55 | 28 | 28.2639238219406 | -0.263923821940568 |
| 56 | 27.4 | 27.6726364037011 | -0.272636403701079 |
| 57 | 26.9 | 26.9501076071578 | -0.0501076071578286 |
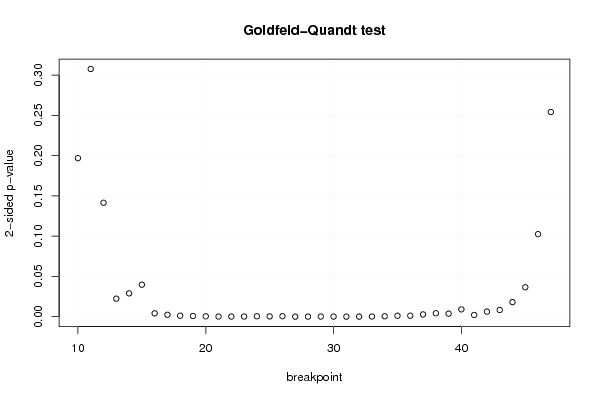
| Goldfeld-Quandt test for Heteroskedasticity | |||
| p-values | Alternative Hypothesis | ||
| breakpoint index | greater | 2-sided | less |
| 10 | 0.901524698811363 | 0.196950602377274 | 0.0984753011886369 |
| 11 | 0.846112551154415 | 0.307774897691171 | 0.153887448845586 |
| 12 | 0.929202531630804 | 0.141594936738392 | 0.0707974683691961 |
| 13 | 0.98880877692813 | 0.0223824461437410 | 0.0111912230718705 |
| 14 | 0.985506083442567 | 0.0289878331148663 | 0.0144939165574331 |
| 15 | 0.980119150203583 | 0.0397616995928338 | 0.0198808497964169 |
| 16 | 0.997933721884726 | 0.00413255623054755 | 0.00206627811527377 |
| 17 | 0.998807487761217 | 0.00238502447756627 | 0.00119251223878314 |
| 18 | 0.999391387210264 | 0.00121722557947249 | 0.000608612789736243 |
| 19 | 0.999599216558343 | 0.00080156688331478 | 0.00040078344165739 |
| 20 | 0.999762252523554 | 0.000475494952891421 | 0.000237747476445710 |
| 21 | 0.99988997488039 | 0.000220050239222344 | 0.000110025119611172 |
| 22 | 0.999925485517358 | 0.000149028965282945 | 7.45144826414727e-05 |
| 23 | 0.999884211915945 | 0.00023157616811034 | 0.00011578808405517 |
| 24 | 0.999764934806881 | 0.00047013038623754 | 0.00023506519311877 |
| 25 | 0.999831366825912 | 0.000337266348176278 | 0.000168633174088139 |
| 26 | 0.999715880851508 | 0.000568238296984148 | 0.000284119148492074 |
| 27 | 0.99998106787976 | 3.78642404808122e-05 | 1.89321202404061e-05 |
| 28 | 0.99996980223743 | 6.03955251384981e-05 | 3.01977625692491e-05 |
| 29 | 0.999931962309783 | 0.000136075380433637 | 6.80376902168184e-05 |
| 30 | 0.999961384564023 | 7.72308719550925e-05 | 3.86154359775462e-05 |
| 31 | 0.999971529128322 | 5.69417433561704e-05 | 2.84708716780852e-05 |
| 32 | 0.99996035455622 | 7.92908875581408e-05 | 3.96454437790704e-05 |
| 33 | 0.99990222558633 | 0.000195548827339156 | 9.77744136695782e-05 |
| 34 | 0.999740695366481 | 0.00051860926703744 | 0.00025930463351872 |
| 35 | 0.999407282337377 | 0.00118543532524525 | 0.000592717662622624 |
| 36 | 0.999407194163458 | 0.00118561167308359 | 0.000592805836541794 |
| 37 | 0.998595856140662 | 0.00280828771867669 | 0.00140414385933835 |
| 38 | 0.997868095257654 | 0.00426380948469167 | 0.00213190474234584 |
| 39 | 0.998101787063814 | 0.00379642587237155 | 0.00189821293618577 |
| 40 | 0.995439925897525 | 0.00912014820495052 | 0.00456007410247526 |
| 41 | 0.998928439991366 | 0.00214312001726708 | 0.00107156000863354 |
| 42 | 0.996841320264963 | 0.0063173594700732 | 0.0031586797350366 |
| 43 | 0.995846258380053 | 0.00830748323989334 | 0.00415374161994667 |
| 44 | 0.990941646905787 | 0.0181167061884256 | 0.0090583530942128 |
| 45 | 0.981732795388951 | 0.0365344092220974 | 0.0182672046110487 |
| 46 | 0.948732000743258 | 0.102535998513485 | 0.0512679992567423 |
| 47 | 0.872858860382225 | 0.25428227923555 | 0.127141139617775 |
| Meta Analysis of Goldfeld-Quandt test for Heteroskedasticity | |||
| Description | # significant tests | % significant tests | OK/NOK |
| 1% type I error level | 28 | 0.736842105263158 | NOK |
| 5% type I error level | 33 | 0.868421052631579 | NOK |
| 10% type I error level | 33 | 0.868421052631579 | NOK |