| Multiple Linear Regression - Estimated Regression Equation |
| Y[t] = + 3.46094894308918 -1.35890812535706X[t] + 1.57594470852792Y1[t] -0.641364831745757Y2[t] + 0.301634497468656M1[t] + 0.112538207357399M2[t] + 0.0715051759643893M3[t] + 0.263299441206298M4[t] + 0.460167495643472M5[t] + 0.100278611311066M6[t] + 0.184482326076706M7[t] + 0.262352168000846M8[t] + 0.194356140873652M9[t] + 0.104842003651204M10[t] + 0.00988454894042862M11[t] -0.0031959243864679t + e[t] |
| Multiple Linear Regression - Ordinary Least Squares | |||||
| Variable | Parameter | S.D. | T-STAT H0: parameter = 0 | 2-tail p-value | 1-tail p-value |
| (Intercept) | 3.46094894308918 | 1.393426 | 2.4838 | 0.016975 | 0.008488 |
| X | -1.35890812535706 | 0.527899 | -2.5742 | 0.013576 | 0.006788 |
| Y1 | 1.57594470852792 | 0.106811 | 14.7545 | 0 | 0 |
| Y2 | -0.641364831745757 | 0.104974 | -6.1098 | 0 | 0 |
| M1 | 0.301634497468656 | 0.539082 | 0.5595 | 0.578701 | 0.28935 |
| M2 | 0.112538207357399 | 0.538915 | 0.2088 | 0.835572 | 0.417786 |
| M3 | 0.0715051759643893 | 0.538747 | 0.1327 | 0.89503 | 0.447515 |
| M4 | 0.263299441206298 | 0.538875 | 0.4886 | 0.627601 | 0.3138 |
| M5 | 0.460167495643472 | 0.546463 | 0.8421 | 0.404401 | 0.2022 |
| M6 | 0.100278611311066 | 0.545736 | 0.1837 | 0.855074 | 0.427537 |
| M7 | 0.184482326076706 | 0.540479 | 0.3413 | 0.734517 | 0.367258 |
| M8 | 0.262352168000846 | 0.539049 | 0.4867 | 0.628947 | 0.314473 |
| M9 | 0.194356140873652 | 0.538981 | 0.3606 | 0.720165 | 0.360082 |
| M10 | 0.104842003651204 | 0.538855 | 0.1946 | 0.84665 | 0.423325 |
| M11 | 0.00988454894042862 | 0.538931 | 0.0183 | 0.985452 | 0.492726 |
| t | -0.0031959243864679 | 0.016433 | -0.1945 | 0.846713 | 0.423356 |
| Multiple Linear Regression - Regression Statistics | |
| Multiple R | 0.997691270248974 |
| R-squared | 0.995387870731012 |
| Adjusted R-squared | 0.993778988427876 |
| F-TEST (value) | 618.682838882126 |
| F-TEST (DF numerator) | 15 |
| F-TEST (DF denominator) | 43 |
| p-value | 0 |
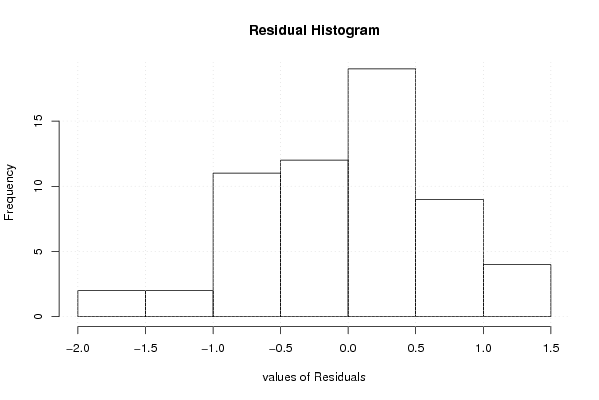
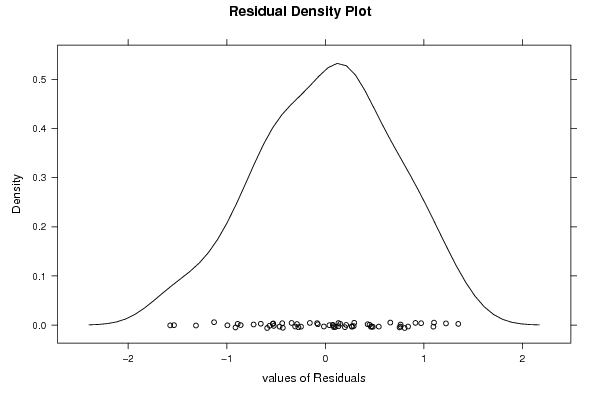
| Multiple Linear Regression - Residual Statistics | |
| Residual Standard Deviation | 0.801038532138557 |
| Sum Squared Residuals | 27.5914973887398 |
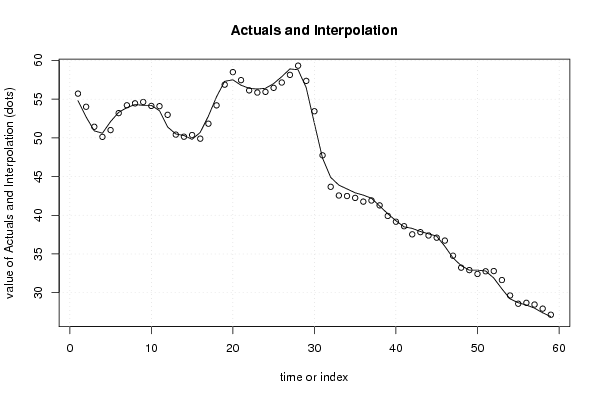
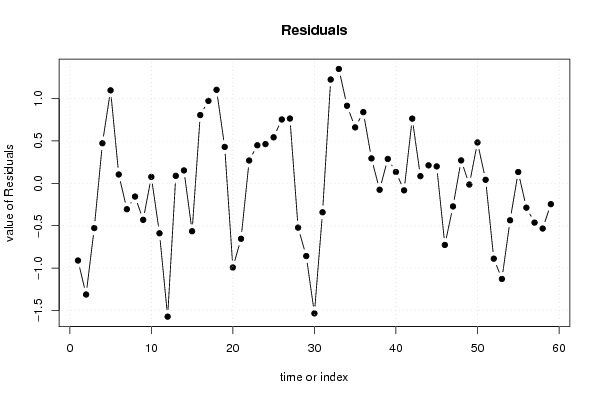
| Multiple Linear Regression - Actuals, Interpolation, and Residuals | |||
| Time or Index | Actuals | Interpolation Forecast | Residuals Prediction Error |
| 1 | 54.8 | 55.7110417169253 | -0.911041716925267 |
| 2 | 52.7 | 54.0124347512415 | -1.31243475124146 |
| 3 | 50.9 | 51.4283597056483 | -0.528359705648272 |
| 4 | 50.6 | 50.1271237178195 | 0.472876282180463 |
| 5 | 52.1 | 51.0024691324542 | 1.09753086754576 |
| 6 | 53.3 | 53.195710836051 | 0.104289163949020 |
| 7 | 53.9 | 54.205805029045 | -0.305805029045017 |
| 8 | 54.3 | 54.4564079736045 | -0.156407973604542 |
| 9 | 54.2 | 54.6307750064546 | -0.430775006454585 |
| 10 | 54.2 | 54.1239245412946 | 0.076075458705416 |
| 11 | 53.5 | 54.0899076453719 | -0.589907645371917 |
| 12 | 51.4 | 52.9736658760755 | -1.57366587607547 |
| 13 | 50.5 | 50.411575943471 | 0.0884240565289558 |
| 14 | 50.3 | 50.1477996379643 | 0.152200362035715 |
| 15 | 49.8 | 50.3656100890504 | -0.565610089050398 |
| 16 | 50.7 | 49.894509041991 | 0.805490958008976 |
| 17 | 52.8 | 51.8272138255898 | 0.972786174410244 |
| 18 | 55.3 | 54.1963845562083 | 1.10361544379167 |
| 19 | 57.3 | 56.8703879712412 | 0.429612028758775 |
| 20 | 57.5 | 58.4935392264703 | -0.99353922647035 |
| 21 | 56.8 | 57.4548065531708 | -0.654806553170764 |
| 22 | 56.4 | 56.1306622292431 | 0.269337770756858 |
| 23 | 56.3 | 55.8510863489568 | 0.448913651043235 |
| 24 | 56.4 | 55.9369573374754 | 0.463042662524625 |
| 25 | 57 | 56.4571268645849 | 0.542873135415067 |
| 26 | 57.9 | 57.1462649920294 | 0.75373500797061 |
| 27 | 58.9 | 58.1355673748776 | 0.764432625122414 |
| 28 | 58.8 | 59.3228820756898 | -0.522882075689771 |
| 29 | 56.5 | 57.3586867777849 | -0.858686777784864 |
| 30 | 51.9 | 53.4350656226264 | -1.53506562262635 |
| 31 | 47.4 | 47.7418668667923 | -0.341866866792309 |
| 32 | 44.9 | 43.6750678219848 | 1.22493217801519 |
| 33 | 43.9 | 42.5501558420072 | 1.34984415799276 |
| 34 | 43.4 | 42.4849131512348 | 0.915086848765203 |
| 35 | 42.9 | 42.2401522496193 | 0.65984775038065 |
| 36 | 42.6 | 41.7597818379014 | 0.840218162098634 |
| 37 | 42.2 | 41.9061194142981 | 0.293880585701941 |
| 38 | 41.2 | 41.2758587659129 | -0.0758587659128922 |
| 39 | 40.2 | 39.9122310343038 | 0.287768965696208 |
| 40 | 39.3 | 39.1662494983771 | 0.133750501622929 |
| 41 | 38.5 | 38.5829362224984 | -0.0829362224983919 |
| 42 | 38.3 | 37.5363239955284 | 0.763676004471629 |
| 43 | 37.9 | 37.8152347095986 | 0.0847652904014438 |
| 44 | 37.6 | 37.3878037100742 | 0.212196289925788 |
| 45 | 37.3 | 37.1003742787005 | 0.199625721299517 |
| 46 | 36 | 36.7272902540569 | -0.727290254056906 |
| 47 | 34.5 | 34.7728182033971 | -0.272818203397096 |
| 48 | 33.5 | 33.2295949485478 | 0.270405051452204 |
| 49 | 32.9 | 32.9141360607207 | -0.0141360607206959 |
| 50 | 32.9 | 32.4176418528520 | 0.482358147148027 |
| 51 | 32.8 | 32.7582317961200 | 0.0417682038800483 |
| 52 | 31.9 | 32.7892356661226 | -0.889235666122597 |
| 53 | 30.5 | 31.6286940416727 | -1.12869404167275 |
| 54 | 29.2 | 29.636514989586 | -0.436514989585965 |
| 55 | 28.7 | 28.5667054233229 | 0.133294576677107 |
| 56 | 28.4 | 28.6871812678661 | -0.287181267866087 |
| 57 | 28 | 28.4638883196669 | -0.463888319666924 |
| 58 | 27.4 | 27.9332098241706 | -0.533209824170572 |
| 59 | 26.9 | 27.1460355526549 | -0.246035552654873 |
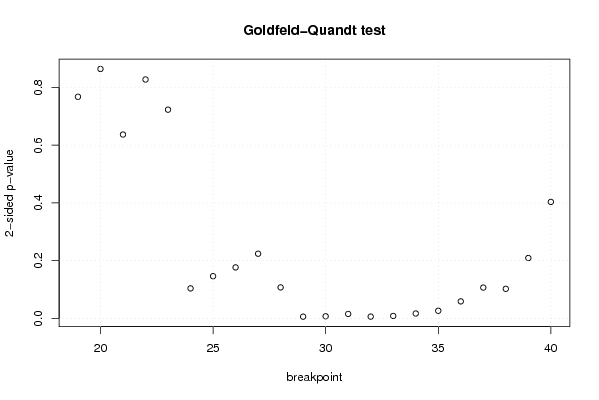
| Goldfeld-Quandt test for Heteroskedasticity | |||
| p-values | Alternative Hypothesis | ||
| breakpoint index | greater | 2-sided | less |
| 19 | 0.383797704894620 | 0.767595409789241 | 0.61620229510538 |
| 20 | 0.568013989745888 | 0.863972020508224 | 0.431986010254112 |
| 21 | 0.6815781411301 | 0.6368437177398 | 0.3184218588699 |
| 22 | 0.586269251241131 | 0.827461497517738 | 0.413730748758869 |
| 23 | 0.63852569768549 | 0.722948604629019 | 0.361474302314510 |
| 24 | 0.94794680983037 | 0.104106380339259 | 0.0520531901696295 |
| 25 | 0.92680831872781 | 0.14638336254438 | 0.07319168127219 |
| 26 | 0.911565973819178 | 0.176868052361644 | 0.0884340261808222 |
| 27 | 0.887915898499298 | 0.224168203001403 | 0.112084101500702 |
| 28 | 0.946247825801261 | 0.107504348397477 | 0.0537521741987387 |
| 29 | 0.996880616804502 | 0.00623876639099515 | 0.00311938319549758 |
| 30 | 0.996250261413407 | 0.00749947717318505 | 0.00374973858659253 |
| 31 | 0.992202923661093 | 0.0155941526778141 | 0.00779707633890706 |
| 32 | 0.996809611615654 | 0.00638077676869291 | 0.00319038838434646 |
| 33 | 0.995674568773917 | 0.00865086245216501 | 0.00432543122608251 |
| 34 | 0.99144085436057 | 0.0171182912788613 | 0.00855914563943065 |
| 35 | 0.986701273914209 | 0.0265974521715826 | 0.0132987260857913 |
| 36 | 0.97041615209434 | 0.0591676958113213 | 0.0295838479056607 |
| 37 | 0.94654085466774 | 0.106918290664519 | 0.0534591453322594 |
| 38 | 0.948693143622374 | 0.102613712755252 | 0.0513068563776259 |
| 39 | 0.8953786598597 | 0.209242680280600 | 0.104621340140300 |
| 40 | 0.798217131403275 | 0.403565737193449 | 0.201782868596725 |
| Meta Analysis of Goldfeld-Quandt test for Heteroskedasticity | |||
| Description | # significant tests | % significant tests | OK/NOK |
| 1% type I error level | 4 | 0.181818181818182 | NOK |
| 5% type I error level | 7 | 0.318181818181818 | NOK |
| 10% type I error level | 8 | 0.363636363636364 | NOK |