Free Statistics

of Irreproducible Research!

Author's title

Author*The author of this computation has been verified*
R Software Modulerwasp_multipleregression.wasp
Title produced by softwareMultiple Regression
Date of computationThu, 19 Nov 2009 10:01:55 -0700
Cite this page as followsStatistical Computations at FreeStatistics.org, Office for Research Development and Education, URL https://freestatistics.org/blog/index.php?v=date/2009/Nov/19/t1258650302jheuf7ly064jxul.htm/, Retrieved Sat, 20 Apr 2024 13:58:29 +0000
Statistical Computations at FreeStatistics.org, Office for Research Development and Education, URL https://freestatistics.org/blog/index.php?pk=57832, Retrieved Sat, 20 Apr 2024 13:58:29 +0000
QR Codes:

Original text written by user:Uitleg in Word document
IsPrivate?No (this computation is public)
User-defined keywords
Estimated Impact168
Family? (F = Feedback message, R = changed R code, M = changed R Module, P = changed Parameters, D = changed Data)
-     [Multiple Regression] [Q1 The Seatbeltlaw] [2007-11-14 19:27:43] [8cd6641b921d30ebe00b648d1481bba0]
- RMPD  [Multiple Regression] [Seatbelt] [2009-11-12 14:03:14] [b98453cac15ba1066b407e146608df68]
- R  D      [Multiple Regression] [Regressiemodel - ...] [2009-11-19 17:01:55] [8eb8270f5a1cfdf0409dcfcbf10be18b] [Current]
-    D        [Multiple Regression] [Multiple Regression] [2010-12-26 20:57:10] [fd57ceeb2f72ef497e1390930b11fced]
- R  D        [Multiple Regression] [] [2010-12-29 14:23:28] [adca540665f1dd1a5a4406fd7f55bdf4]
Feedback Forum

Post a new message
Dataseries X:
96.96	89.1
93.11	83.3
95.62	97.7
98.30	100.9
96.38	108.3
100.82	113.2
99.06	105
94.03	104
102.07	109.8
99.31	98.6
98.64	93.5
101.82	98.2
99.14	88
97.63	85.3
100.06	96.8
101.32	98.8
101.49	110.3
105.43	111.6
105.09	111.2
99.48	106.9
108.53	117.6
104.34	97
106.10	97.3
107.35	98.4
103.00	87.6
104.50	87.4
105.17	94.7
104.84	101.5
106.18	110.4
108.86	108.4
107.77	109.7
102.74	105.2
112.63	111.1
106.26	96.2
108.86	97.3
111.38	98.9
106.85	91.7
107.86	90.9
107.94	98.8
111.38	111.5
111.29	119
113.72	115.3
111.88	116.3
109.87	113.6
113.72	115.1
111.71	109.7
114.81	97.6
112.05	100.8
111.54	94
110.87	87.2
110.87	102.9
115.48	111.3
111.63	106.6
116.24	108.9
113.56	108.3
106.01	100.5
110.45	104
107.77	89.9
108.61	86.8
108.19	91.2


Summary of computational transaction
Raw Inputview raw input (R code)
Raw Outputview raw output of R engine
Computing time5 seconds
R Server'Gwilym Jenkins' @ 72.249.127.135

\begin{tabular}{lllllllll}
\hline
Summary of computational transaction \tabularnewline
Raw Input & view raw input (R code)  \tabularnewline
Raw Output & view raw output of R engine  \tabularnewline
Computing time & 5 seconds \tabularnewline
R Server & 'Gwilym Jenkins' @ 72.249.127.135 \tabularnewline
\hline
\end{tabular}
%Source: https://freestatistics.org/blog/index.php?pk=57832&T=0

[TABLE]
[ROW][C]Summary of computational transaction[/C][/ROW]
[ROW][C]Raw Input[/C][C]view raw input (R code) [/C][/ROW]
[ROW][C]Raw Output[/C][C]view raw output of R engine [/C][/ROW]
[ROW][C]Computing time[/C][C]5 seconds[/C][/ROW]
[ROW][C]R Server[/C][C]'Gwilym Jenkins' @ 72.249.127.135[/C][/ROW]
[/TABLE]
Source: https://freestatistics.org/blog/index.php?pk=57832&T=0

Globally Unique Identifier (entire table): ba.freestatistics.org/blog/index.php?pk=57832&T=0

As an alternative you can also use a QR Code:  

The GUIDs for individual cells are displayed in the table below:

Summary of computational transaction
Raw Inputview raw input (R code)
Raw Outputview raw output of R engine
Computing time5 seconds
R Server'Gwilym Jenkins' @ 72.249.127.135


Multiple Linear Regression - Estimated Regression Equation
BESTC[t] = + 53.3118683218126 + 0.562524427468587INDUSTR[t] -0.486068748183151M1[t] + 0.643760885364526M2[t] -4.60851661067863M3[t] -6.00042832052068M4[t] -10.3130778166284M5[t] -7.00809149601084M6[t] -7.7738077861042M7[t] -10.5359586105817M8[t] -6.56459247310959M9[t] -2.71876905342549M10[t] + 0.933573282405774M11[t] + e[t]

\begin{tabular}{lllllllll}
\hline
Multiple Linear Regression - Estimated Regression Equation \tabularnewline
BESTC[t] =  +  53.3118683218126 +  0.562524427468587INDUSTR[t] -0.486068748183151M1[t] +  0.643760885364526M2[t] -4.60851661067863M3[t] -6.00042832052068M4[t] -10.3130778166284M5[t] -7.00809149601084M6[t] -7.7738077861042M7[t] -10.5359586105817M8[t] -6.56459247310959M9[t] -2.71876905342549M10[t] +  0.933573282405774M11[t]  + e[t] \tabularnewline
\hline
\end{tabular}
%Source: https://freestatistics.org/blog/index.php?pk=57832&T=1

[TABLE]
[ROW][C]Multiple Linear Regression - Estimated Regression Equation[/C][/ROW]
[ROW][C]BESTC[t] =  +  53.3118683218126 +  0.562524427468587INDUSTR[t] -0.486068748183151M1[t] +  0.643760885364526M2[t] -4.60851661067863M3[t] -6.00042832052068M4[t] -10.3130778166284M5[t] -7.00809149601084M6[t] -7.7738077861042M7[t] -10.5359586105817M8[t] -6.56459247310959M9[t] -2.71876905342549M10[t] +  0.933573282405774M11[t]  + e[t][/C][/ROW]
[/TABLE]
Source: https://freestatistics.org/blog/index.php?pk=57832&T=1

Globally Unique Identifier (entire table): ba.freestatistics.org/blog/index.php?pk=57832&T=1

As an alternative you can also use a QR Code:  

The GUIDs for individual cells are displayed in the table below:

Multiple Linear Regression - Estimated Regression Equation
BESTC[t] = + 53.3118683218126 + 0.562524427468587INDUSTR[t] -0.486068748183151M1[t] + 0.643760885364526M2[t] -4.60851661067863M3[t] -6.00042832052068M4[t] -10.3130778166284M5[t] -7.00809149601084M6[t] -7.7738077861042M7[t] -10.5359586105817M8[t] -6.56459247310959M9[t] -2.71876905342549M10[t] + 0.933573282405774M11[t] + e[t]


Multiple Linear Regression - Ordinary Least Squares
VariableParameterS.D.T-STATH0: parameter = 02-tail p-value1-tail p-value
(Intercept)53.311868321812616.875023.15920.0027650.001383
INDUSTR0.5625244274685870.1713013.28380.0019380.000969
M1-0.4860687481831513.639218-0.13360.8943180.447159
M20.6437608853645263.8698040.16640.8685910.434296
M3-4.608516610678633.412023-1.35070.1832690.091634
M4-6.000428320520683.63209-1.65210.1051890.052594
M5-10.31307781662844.112553-2.50770.0156640.007832
M6-7.008091496010844.166935-1.68180.0992350.049617
M7-7.77380778610424.035715-1.92630.0601330.030066
M8-10.53595861058173.710585-2.83940.0066570.003328
M9-6.564592473109594.170877-1.57390.1222160.061108
M10-2.718769053425493.41265-0.79670.4296470.214823
M110.9335732824057743.448540.27070.7877950.393898

\begin{tabular}{lllllllll}
\hline
Multiple Linear Regression - Ordinary Least Squares \tabularnewline
Variable & Parameter & S.D. & T-STATH0: parameter = 0 & 2-tail p-value & 1-tail p-value \tabularnewline
(Intercept) & 53.3118683218126 & 16.87502 & 3.1592 & 0.002765 & 0.001383 \tabularnewline
INDUSTR & 0.562524427468587 & 0.171301 & 3.2838 & 0.001938 & 0.000969 \tabularnewline
M1 & -0.486068748183151 & 3.639218 & -0.1336 & 0.894318 & 0.447159 \tabularnewline
M2 & 0.643760885364526 & 3.869804 & 0.1664 & 0.868591 & 0.434296 \tabularnewline
M3 & -4.60851661067863 & 3.412023 & -1.3507 & 0.183269 & 0.091634 \tabularnewline
M4 & -6.00042832052068 & 3.63209 & -1.6521 & 0.105189 & 0.052594 \tabularnewline
M5 & -10.3130778166284 & 4.112553 & -2.5077 & 0.015664 & 0.007832 \tabularnewline
M6 & -7.00809149601084 & 4.166935 & -1.6818 & 0.099235 & 0.049617 \tabularnewline
M7 & -7.7738077861042 & 4.035715 & -1.9263 & 0.060133 & 0.030066 \tabularnewline
M8 & -10.5359586105817 & 3.710585 & -2.8394 & 0.006657 & 0.003328 \tabularnewline
M9 & -6.56459247310959 & 4.170877 & -1.5739 & 0.122216 & 0.061108 \tabularnewline
M10 & -2.71876905342549 & 3.41265 & -0.7967 & 0.429647 & 0.214823 \tabularnewline
M11 & 0.933573282405774 & 3.44854 & 0.2707 & 0.787795 & 0.393898 \tabularnewline
\hline
\end{tabular}
%Source: https://freestatistics.org/blog/index.php?pk=57832&T=2

[TABLE]
[ROW][C]Multiple Linear Regression - Ordinary Least Squares[/C][/ROW]
[ROW][C]Variable[/C][C]Parameter[/C][C]S.D.[/C][C]T-STATH0: parameter = 0[/C][C]2-tail p-value[/C][C]1-tail p-value[/C][/ROW]
[ROW][C](Intercept)[/C][C]53.3118683218126[/C][C]16.87502[/C][C]3.1592[/C][C]0.002765[/C][C]0.001383[/C][/ROW]
[ROW][C]INDUSTR[/C][C]0.562524427468587[/C][C]0.171301[/C][C]3.2838[/C][C]0.001938[/C][C]0.000969[/C][/ROW]
[ROW][C]M1[/C][C]-0.486068748183151[/C][C]3.639218[/C][C]-0.1336[/C][C]0.894318[/C][C]0.447159[/C][/ROW]
[ROW][C]M2[/C][C]0.643760885364526[/C][C]3.869804[/C][C]0.1664[/C][C]0.868591[/C][C]0.434296[/C][/ROW]
[ROW][C]M3[/C][C]-4.60851661067863[/C][C]3.412023[/C][C]-1.3507[/C][C]0.183269[/C][C]0.091634[/C][/ROW]
[ROW][C]M4[/C][C]-6.00042832052068[/C][C]3.63209[/C][C]-1.6521[/C][C]0.105189[/C][C]0.052594[/C][/ROW]
[ROW][C]M5[/C][C]-10.3130778166284[/C][C]4.112553[/C][C]-2.5077[/C][C]0.015664[/C][C]0.007832[/C][/ROW]
[ROW][C]M6[/C][C]-7.00809149601084[/C][C]4.166935[/C][C]-1.6818[/C][C]0.099235[/C][C]0.049617[/C][/ROW]
[ROW][C]M7[/C][C]-7.7738077861042[/C][C]4.035715[/C][C]-1.9263[/C][C]0.060133[/C][C]0.030066[/C][/ROW]
[ROW][C]M8[/C][C]-10.5359586105817[/C][C]3.710585[/C][C]-2.8394[/C][C]0.006657[/C][C]0.003328[/C][/ROW]
[ROW][C]M9[/C][C]-6.56459247310959[/C][C]4.170877[/C][C]-1.5739[/C][C]0.122216[/C][C]0.061108[/C][/ROW]
[ROW][C]M10[/C][C]-2.71876905342549[/C][C]3.41265[/C][C]-0.7967[/C][C]0.429647[/C][C]0.214823[/C][/ROW]
[ROW][C]M11[/C][C]0.933573282405774[/C][C]3.44854[/C][C]0.2707[/C][C]0.787795[/C][C]0.393898[/C][/ROW]
[/TABLE]
Source: https://freestatistics.org/blog/index.php?pk=57832&T=2

Globally Unique Identifier (entire table): ba.freestatistics.org/blog/index.php?pk=57832&T=2

As an alternative you can also use a QR Code:  

The GUIDs for individual cells are displayed in the table below:

Multiple Linear Regression - Ordinary Least Squares
VariableParameterS.D.T-STATH0: parameter = 02-tail p-value1-tail p-value
(Intercept)53.311868321812616.875023.15920.0027650.001383
INDUSTR0.5625244274685870.1713013.28380.0019380.000969
M1-0.4860687481831513.639218-0.13360.8943180.447159
M20.6437608853645263.8698040.16640.8685910.434296
M3-4.608516610678633.412023-1.35070.1832690.091634
M4-6.000428320520683.63209-1.65210.1051890.052594
M5-10.31307781662844.112553-2.50770.0156640.007832
M6-7.008091496010844.166935-1.68180.0992350.049617
M7-7.77380778610424.035715-1.92630.0601330.030066
M8-10.53595861058173.710585-2.83940.0066570.003328
M9-6.564592473109594.170877-1.57390.1222160.061108
M10-2.718769053425493.41265-0.79670.4296470.214823
M110.9335732824057743.448540.27070.7877950.393898


Multiple Linear Regression - Regression Statistics
Multiple R0.56286069610102
R-squared0.316812163215325
Adjusted R-squared0.142381226163919
F-TEST (value)1.81626131562865
F-TEST (DF numerator)12
F-TEST (DF denominator)47
p-value0.0728147785907012
Multiple Linear Regression - Residual Statistics
Residual Standard Deviation5.39173682080917
Sum Squared Residuals1366.32881940886

\begin{tabular}{lllllllll}
\hline
Multiple Linear Regression - Regression Statistics \tabularnewline
Multiple R & 0.56286069610102 \tabularnewline
R-squared & 0.316812163215325 \tabularnewline
Adjusted R-squared & 0.142381226163919 \tabularnewline
F-TEST (value) & 1.81626131562865 \tabularnewline
F-TEST (DF numerator) & 12 \tabularnewline
F-TEST (DF denominator) & 47 \tabularnewline
p-value & 0.0728147785907012 \tabularnewline
Multiple Linear Regression - Residual Statistics \tabularnewline
Residual Standard Deviation & 5.39173682080917 \tabularnewline
Sum Squared Residuals & 1366.32881940886 \tabularnewline
\hline
\end{tabular}
%Source: https://freestatistics.org/blog/index.php?pk=57832&T=3

[TABLE]
[ROW][C]Multiple Linear Regression - Regression Statistics[/C][/ROW]
[ROW][C]Multiple R[/C][C]0.56286069610102[/C][/ROW]
[ROW][C]R-squared[/C][C]0.316812163215325[/C][/ROW]
[ROW][C]Adjusted R-squared[/C][C]0.142381226163919[/C][/ROW]
[ROW][C]F-TEST (value)[/C][C]1.81626131562865[/C][/ROW]
[ROW][C]F-TEST (DF numerator)[/C][C]12[/C][/ROW]
[ROW][C]F-TEST (DF denominator)[/C][C]47[/C][/ROW]
[ROW][C]p-value[/C][C]0.0728147785907012[/C][/ROW]
[ROW][C]Multiple Linear Regression - Residual Statistics[/C][/ROW]
[ROW][C]Residual Standard Deviation[/C][C]5.39173682080917[/C][/ROW]
[ROW][C]Sum Squared Residuals[/C][C]1366.32881940886[/C][/ROW]
[/TABLE]
Source: https://freestatistics.org/blog/index.php?pk=57832&T=3

Globally Unique Identifier (entire table): ba.freestatistics.org/blog/index.php?pk=57832&T=3

As an alternative you can also use a QR Code:  

The GUIDs for individual cells are displayed in the table below:

Multiple Linear Regression - Regression Statistics
Multiple R0.56286069610102
R-squared0.316812163215325
Adjusted R-squared0.142381226163919
F-TEST (value)1.81626131562865
F-TEST (DF numerator)12
F-TEST (DF denominator)47
p-value0.0728147785907012
Multiple Linear Regression - Residual Statistics
Residual Standard Deviation5.39173682080917
Sum Squared Residuals1366.32881940886


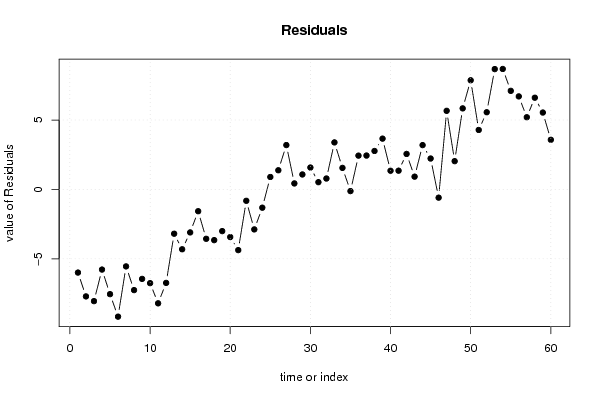
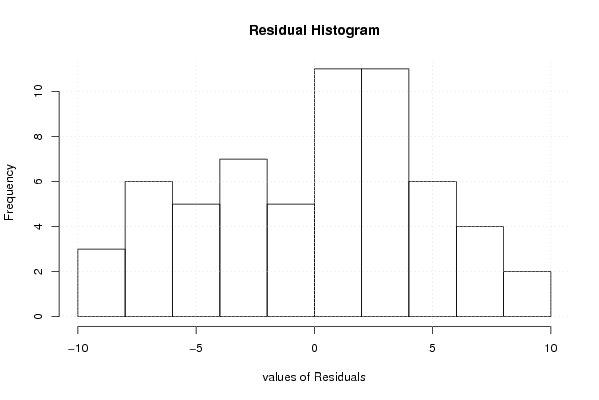
Multiple Linear Regression - Actuals, Interpolation, and Residuals
Time or IndexActualsInterpolationForecastResidualsPrediction Error
196.96102.946726061081-5.9867260610811
293.11100.813914015311-7.70391401531056
395.62103.661988274815-8.04198827481507
498.3104.070154732873-5.77015473287252
596.38103.920186000032-7.5401860000323
6100.82109.981542015246-9.16154201524597
799.06104.603125419910-5.5431254199102
894.03101.278450167964-7.24845016796409
9102.07108.512457984754-6.44245798475403
1099.31106.05800781679-6.74800781678995
1198.64106.841475572531-8.20147557253142
12101.82108.551767099228-6.73176709922801
1399.14102.327949190865-3.18794919086526
1497.63101.938962870248-4.30896287024775
15100.06103.155716290093-3.09571629009335
16101.32102.888853435188-1.56885343518848
17101.49105.045234854969-3.55523485496948
18105.43109.081502931296-3.65150293129622
19105.09108.090776870215-3.00077687021545
2099.48102.909771007623-3.42977100762299
21108.53112.900148519009-4.37014851900901
22104.34105.157968732840-0.817968732840203
23106.1108.979068396912-2.87906839691205
24107.35108.664271984722-1.31427198472173
25103102.1029394198780.897060580122177
26104.5103.1202641679321.37973583206821
27105.17101.9744149924093.19558500759068
28104.84104.4076693893540.432330610646340
29106.18105.1014872977161.07851270228367
30108.86107.2814247633971.57857523660325
31107.77107.2469902290130.523009770987429
32102.74101.9534794809260.786520519073607
33112.63109.2437397404633.38626025953680
34106.26104.7079491908651.55205080913467
35108.86108.979068396912-0.119068396912045
36111.38108.9455341984562.43446580154398
37106.85104.4092895724992.44071042750096
38107.86105.0890996640722.77090033592816
39107.94104.2807651450313.65923485496947
40111.38110.0329136640401.34708633596046
41111.29109.9391973739461.35080262605382
42113.72111.162843312932.55715668707
43111.88110.9596514503050.920348549694754
44109.87106.6786846716633.19131532833748
45113.72111.4938374503382.22616254966246
46111.71112.302028961691-0.592028961691276
47114.81109.1478257251535.66217427484738
48112.05110.0143306106462.03566938935367
49111.54105.7030957556775.83690424432322
50110.87103.0077592824387.86224071756194
51110.87106.5871152976524.28288470234826
52115.48109.9204087785465.55959122145418
53111.63102.9638944733368.6661055266643
54116.24107.5626869771318.67731302286895
55113.56106.4594560305577.10054396944346
56106.0199.3096146718246.70038532817598
57110.45105.2498163054365.20018369456378
58107.77101.1640452978136.60595470218676
59108.61103.0725619084925.53743809150813
60108.19104.6140961069483.57590389305211

\begin{tabular}{lllllllll}
\hline
Multiple Linear Regression - Actuals, Interpolation, and Residuals \tabularnewline
Time or Index & Actuals & InterpolationForecast & ResidualsPrediction Error \tabularnewline
1 & 96.96 & 102.946726061081 & -5.9867260610811 \tabularnewline
2 & 93.11 & 100.813914015311 & -7.70391401531056 \tabularnewline
3 & 95.62 & 103.661988274815 & -8.04198827481507 \tabularnewline
4 & 98.3 & 104.070154732873 & -5.77015473287252 \tabularnewline
5 & 96.38 & 103.920186000032 & -7.5401860000323 \tabularnewline
6 & 100.82 & 109.981542015246 & -9.16154201524597 \tabularnewline
7 & 99.06 & 104.603125419910 & -5.5431254199102 \tabularnewline
8 & 94.03 & 101.278450167964 & -7.24845016796409 \tabularnewline
9 & 102.07 & 108.512457984754 & -6.44245798475403 \tabularnewline
10 & 99.31 & 106.05800781679 & -6.74800781678995 \tabularnewline
11 & 98.64 & 106.841475572531 & -8.20147557253142 \tabularnewline
12 & 101.82 & 108.551767099228 & -6.73176709922801 \tabularnewline
13 & 99.14 & 102.327949190865 & -3.18794919086526 \tabularnewline
14 & 97.63 & 101.938962870248 & -4.30896287024775 \tabularnewline
15 & 100.06 & 103.155716290093 & -3.09571629009335 \tabularnewline
16 & 101.32 & 102.888853435188 & -1.56885343518848 \tabularnewline
17 & 101.49 & 105.045234854969 & -3.55523485496948 \tabularnewline
18 & 105.43 & 109.081502931296 & -3.65150293129622 \tabularnewline
19 & 105.09 & 108.090776870215 & -3.00077687021545 \tabularnewline
20 & 99.48 & 102.909771007623 & -3.42977100762299 \tabularnewline
21 & 108.53 & 112.900148519009 & -4.37014851900901 \tabularnewline
22 & 104.34 & 105.157968732840 & -0.817968732840203 \tabularnewline
23 & 106.1 & 108.979068396912 & -2.87906839691205 \tabularnewline
24 & 107.35 & 108.664271984722 & -1.31427198472173 \tabularnewline
25 & 103 & 102.102939419878 & 0.897060580122177 \tabularnewline
26 & 104.5 & 103.120264167932 & 1.37973583206821 \tabularnewline
27 & 105.17 & 101.974414992409 & 3.19558500759068 \tabularnewline
28 & 104.84 & 104.407669389354 & 0.432330610646340 \tabularnewline
29 & 106.18 & 105.101487297716 & 1.07851270228367 \tabularnewline
30 & 108.86 & 107.281424763397 & 1.57857523660325 \tabularnewline
31 & 107.77 & 107.246990229013 & 0.523009770987429 \tabularnewline
32 & 102.74 & 101.953479480926 & 0.786520519073607 \tabularnewline
33 & 112.63 & 109.243739740463 & 3.38626025953680 \tabularnewline
34 & 106.26 & 104.707949190865 & 1.55205080913467 \tabularnewline
35 & 108.86 & 108.979068396912 & -0.119068396912045 \tabularnewline
36 & 111.38 & 108.945534198456 & 2.43446580154398 \tabularnewline
37 & 106.85 & 104.409289572499 & 2.44071042750096 \tabularnewline
38 & 107.86 & 105.089099664072 & 2.77090033592816 \tabularnewline
39 & 107.94 & 104.280765145031 & 3.65923485496947 \tabularnewline
40 & 111.38 & 110.032913664040 & 1.34708633596046 \tabularnewline
41 & 111.29 & 109.939197373946 & 1.35080262605382 \tabularnewline
42 & 113.72 & 111.16284331293 & 2.55715668707 \tabularnewline
43 & 111.88 & 110.959651450305 & 0.920348549694754 \tabularnewline
44 & 109.87 & 106.678684671663 & 3.19131532833748 \tabularnewline
45 & 113.72 & 111.493837450338 & 2.22616254966246 \tabularnewline
46 & 111.71 & 112.302028961691 & -0.592028961691276 \tabularnewline
47 & 114.81 & 109.147825725153 & 5.66217427484738 \tabularnewline
48 & 112.05 & 110.014330610646 & 2.03566938935367 \tabularnewline
49 & 111.54 & 105.703095755677 & 5.83690424432322 \tabularnewline
50 & 110.87 & 103.007759282438 & 7.86224071756194 \tabularnewline
51 & 110.87 & 106.587115297652 & 4.28288470234826 \tabularnewline
52 & 115.48 & 109.920408778546 & 5.55959122145418 \tabularnewline
53 & 111.63 & 102.963894473336 & 8.6661055266643 \tabularnewline
54 & 116.24 & 107.562686977131 & 8.67731302286895 \tabularnewline
55 & 113.56 & 106.459456030557 & 7.10054396944346 \tabularnewline
56 & 106.01 & 99.309614671824 & 6.70038532817598 \tabularnewline
57 & 110.45 & 105.249816305436 & 5.20018369456378 \tabularnewline
58 & 107.77 & 101.164045297813 & 6.60595470218676 \tabularnewline
59 & 108.61 & 103.072561908492 & 5.53743809150813 \tabularnewline
60 & 108.19 & 104.614096106948 & 3.57590389305211 \tabularnewline
\hline
\end{tabular}
%Source: https://freestatistics.org/blog/index.php?pk=57832&T=4

[TABLE]
[ROW][C]Multiple Linear Regression - Actuals, Interpolation, and Residuals[/C][/ROW]
[ROW][C]Time or Index[/C][C]Actuals[/C][C]InterpolationForecast[/C][C]ResidualsPrediction Error[/C][/ROW]
[ROW][C]1[/C][C]96.96[/C][C]102.946726061081[/C][C]-5.9867260610811[/C][/ROW]
[ROW][C]2[/C][C]93.11[/C][C]100.813914015311[/C][C]-7.70391401531056[/C][/ROW]
[ROW][C]3[/C][C]95.62[/C][C]103.661988274815[/C][C]-8.04198827481507[/C][/ROW]
[ROW][C]4[/C][C]98.3[/C][C]104.070154732873[/C][C]-5.77015473287252[/C][/ROW]
[ROW][C]5[/C][C]96.38[/C][C]103.920186000032[/C][C]-7.5401860000323[/C][/ROW]
[ROW][C]6[/C][C]100.82[/C][C]109.981542015246[/C][C]-9.16154201524597[/C][/ROW]
[ROW][C]7[/C][C]99.06[/C][C]104.603125419910[/C][C]-5.5431254199102[/C][/ROW]
[ROW][C]8[/C][C]94.03[/C][C]101.278450167964[/C][C]-7.24845016796409[/C][/ROW]
[ROW][C]9[/C][C]102.07[/C][C]108.512457984754[/C][C]-6.44245798475403[/C][/ROW]
[ROW][C]10[/C][C]99.31[/C][C]106.05800781679[/C][C]-6.74800781678995[/C][/ROW]
[ROW][C]11[/C][C]98.64[/C][C]106.841475572531[/C][C]-8.20147557253142[/C][/ROW]
[ROW][C]12[/C][C]101.82[/C][C]108.551767099228[/C][C]-6.73176709922801[/C][/ROW]
[ROW][C]13[/C][C]99.14[/C][C]102.327949190865[/C][C]-3.18794919086526[/C][/ROW]
[ROW][C]14[/C][C]97.63[/C][C]101.938962870248[/C][C]-4.30896287024775[/C][/ROW]
[ROW][C]15[/C][C]100.06[/C][C]103.155716290093[/C][C]-3.09571629009335[/C][/ROW]
[ROW][C]16[/C][C]101.32[/C][C]102.888853435188[/C][C]-1.56885343518848[/C][/ROW]
[ROW][C]17[/C][C]101.49[/C][C]105.045234854969[/C][C]-3.55523485496948[/C][/ROW]
[ROW][C]18[/C][C]105.43[/C][C]109.081502931296[/C][C]-3.65150293129622[/C][/ROW]
[ROW][C]19[/C][C]105.09[/C][C]108.090776870215[/C][C]-3.00077687021545[/C][/ROW]
[ROW][C]20[/C][C]99.48[/C][C]102.909771007623[/C][C]-3.42977100762299[/C][/ROW]
[ROW][C]21[/C][C]108.53[/C][C]112.900148519009[/C][C]-4.37014851900901[/C][/ROW]
[ROW][C]22[/C][C]104.34[/C][C]105.157968732840[/C][C]-0.817968732840203[/C][/ROW]
[ROW][C]23[/C][C]106.1[/C][C]108.979068396912[/C][C]-2.87906839691205[/C][/ROW]
[ROW][C]24[/C][C]107.35[/C][C]108.664271984722[/C][C]-1.31427198472173[/C][/ROW]
[ROW][C]25[/C][C]103[/C][C]102.102939419878[/C][C]0.897060580122177[/C][/ROW]
[ROW][C]26[/C][C]104.5[/C][C]103.120264167932[/C][C]1.37973583206821[/C][/ROW]
[ROW][C]27[/C][C]105.17[/C][C]101.974414992409[/C][C]3.19558500759068[/C][/ROW]
[ROW][C]28[/C][C]104.84[/C][C]104.407669389354[/C][C]0.432330610646340[/C][/ROW]
[ROW][C]29[/C][C]106.18[/C][C]105.101487297716[/C][C]1.07851270228367[/C][/ROW]
[ROW][C]30[/C][C]108.86[/C][C]107.281424763397[/C][C]1.57857523660325[/C][/ROW]
[ROW][C]31[/C][C]107.77[/C][C]107.246990229013[/C][C]0.523009770987429[/C][/ROW]
[ROW][C]32[/C][C]102.74[/C][C]101.953479480926[/C][C]0.786520519073607[/C][/ROW]
[ROW][C]33[/C][C]112.63[/C][C]109.243739740463[/C][C]3.38626025953680[/C][/ROW]
[ROW][C]34[/C][C]106.26[/C][C]104.707949190865[/C][C]1.55205080913467[/C][/ROW]
[ROW][C]35[/C][C]108.86[/C][C]108.979068396912[/C][C]-0.119068396912045[/C][/ROW]
[ROW][C]36[/C][C]111.38[/C][C]108.945534198456[/C][C]2.43446580154398[/C][/ROW]
[ROW][C]37[/C][C]106.85[/C][C]104.409289572499[/C][C]2.44071042750096[/C][/ROW]
[ROW][C]38[/C][C]107.86[/C][C]105.089099664072[/C][C]2.77090033592816[/C][/ROW]
[ROW][C]39[/C][C]107.94[/C][C]104.280765145031[/C][C]3.65923485496947[/C][/ROW]
[ROW][C]40[/C][C]111.38[/C][C]110.032913664040[/C][C]1.34708633596046[/C][/ROW]
[ROW][C]41[/C][C]111.29[/C][C]109.939197373946[/C][C]1.35080262605382[/C][/ROW]
[ROW][C]42[/C][C]113.72[/C][C]111.16284331293[/C][C]2.55715668707[/C][/ROW]
[ROW][C]43[/C][C]111.88[/C][C]110.959651450305[/C][C]0.920348549694754[/C][/ROW]
[ROW][C]44[/C][C]109.87[/C][C]106.678684671663[/C][C]3.19131532833748[/C][/ROW]
[ROW][C]45[/C][C]113.72[/C][C]111.493837450338[/C][C]2.22616254966246[/C][/ROW]
[ROW][C]46[/C][C]111.71[/C][C]112.302028961691[/C][C]-0.592028961691276[/C][/ROW]
[ROW][C]47[/C][C]114.81[/C][C]109.147825725153[/C][C]5.66217427484738[/C][/ROW]
[ROW][C]48[/C][C]112.05[/C][C]110.014330610646[/C][C]2.03566938935367[/C][/ROW]
[ROW][C]49[/C][C]111.54[/C][C]105.703095755677[/C][C]5.83690424432322[/C][/ROW]
[ROW][C]50[/C][C]110.87[/C][C]103.007759282438[/C][C]7.86224071756194[/C][/ROW]
[ROW][C]51[/C][C]110.87[/C][C]106.587115297652[/C][C]4.28288470234826[/C][/ROW]
[ROW][C]52[/C][C]115.48[/C][C]109.920408778546[/C][C]5.55959122145418[/C][/ROW]
[ROW][C]53[/C][C]111.63[/C][C]102.963894473336[/C][C]8.6661055266643[/C][/ROW]
[ROW][C]54[/C][C]116.24[/C][C]107.562686977131[/C][C]8.67731302286895[/C][/ROW]
[ROW][C]55[/C][C]113.56[/C][C]106.459456030557[/C][C]7.10054396944346[/C][/ROW]
[ROW][C]56[/C][C]106.01[/C][C]99.309614671824[/C][C]6.70038532817598[/C][/ROW]
[ROW][C]57[/C][C]110.45[/C][C]105.249816305436[/C][C]5.20018369456378[/C][/ROW]
[ROW][C]58[/C][C]107.77[/C][C]101.164045297813[/C][C]6.60595470218676[/C][/ROW]
[ROW][C]59[/C][C]108.61[/C][C]103.072561908492[/C][C]5.53743809150813[/C][/ROW]
[ROW][C]60[/C][C]108.19[/C][C]104.614096106948[/C][C]3.57590389305211[/C][/ROW]
[/TABLE]
Source: https://freestatistics.org/blog/index.php?pk=57832&T=4

Globally Unique Identifier (entire table): ba.freestatistics.org/blog/index.php?pk=57832&T=4

As an alternative you can also use a QR Code:  

The GUIDs for individual cells are displayed in the table below:

Multiple Linear Regression - Actuals, Interpolation, and Residuals
Time or IndexActualsInterpolationForecastResidualsPrediction Error
196.96102.946726061081-5.9867260610811
293.11100.813914015311-7.70391401531056
395.62103.661988274815-8.04198827481507
498.3104.070154732873-5.77015473287252
596.38103.920186000032-7.5401860000323
6100.82109.981542015246-9.16154201524597
799.06104.603125419910-5.5431254199102
894.03101.278450167964-7.24845016796409
9102.07108.512457984754-6.44245798475403
1099.31106.05800781679-6.74800781678995
1198.64106.841475572531-8.20147557253142
12101.82108.551767099228-6.73176709922801
1399.14102.327949190865-3.18794919086526
1497.63101.938962870248-4.30896287024775
15100.06103.155716290093-3.09571629009335
16101.32102.888853435188-1.56885343518848
17101.49105.045234854969-3.55523485496948
18105.43109.081502931296-3.65150293129622
19105.09108.090776870215-3.00077687021545
2099.48102.909771007623-3.42977100762299
21108.53112.900148519009-4.37014851900901
22104.34105.157968732840-0.817968732840203
23106.1108.979068396912-2.87906839691205
24107.35108.664271984722-1.31427198472173
25103102.1029394198780.897060580122177
26104.5103.1202641679321.37973583206821
27105.17101.9744149924093.19558500759068
28104.84104.4076693893540.432330610646340
29106.18105.1014872977161.07851270228367
30108.86107.2814247633971.57857523660325
31107.77107.2469902290130.523009770987429
32102.74101.9534794809260.786520519073607
33112.63109.2437397404633.38626025953680
34106.26104.7079491908651.55205080913467
35108.86108.979068396912-0.119068396912045
36111.38108.9455341984562.43446580154398
37106.85104.4092895724992.44071042750096
38107.86105.0890996640722.77090033592816
39107.94104.2807651450313.65923485496947
40111.38110.0329136640401.34708633596046
41111.29109.9391973739461.35080262605382
42113.72111.162843312932.55715668707
43111.88110.9596514503050.920348549694754
44109.87106.6786846716633.19131532833748
45113.72111.4938374503382.22616254966246
46111.71112.302028961691-0.592028961691276
47114.81109.1478257251535.66217427484738
48112.05110.0143306106462.03566938935367
49111.54105.7030957556775.83690424432322
50110.87103.0077592824387.86224071756194
51110.87106.5871152976524.28288470234826
52115.48109.9204087785465.55959122145418
53111.63102.9638944733368.6661055266643
54116.24107.5626869771318.67731302286895
55113.56106.4594560305577.10054396944346
56106.0199.3096146718246.70038532817598
57110.45105.2498163054365.20018369456378
58107.77101.1640452978136.60595470218676
59108.61103.0725619084925.53743809150813
60108.19104.6140961069483.57590389305211


Goldfeld-Quandt test for Heteroskedasticity
p-valuesAlternative Hypothesis
breakpoint indexgreater2-sidedless
160.4221664373414220.8443328746828440.577833562658578
170.4640813725159830.9281627450319670.535918627484017
180.5204879446487590.9590241107024810.479512055351241
190.4972876144078880.9945752288157770.502712385592112
200.504837425407420.990325149185160.49516257459258
210.4569837596216680.9139675192433370.543016240378332
220.5640244197973970.8719511604052050.435975580202603
230.6230257397437270.7539485205125450.376974260256273
240.6651208668666750.669758266266650.334879133133325
250.752816457516480.4943670849670390.247183542483519
260.83105769347530.33788461304940.1689423065247
270.9239745380825340.1520509238349320.076025461917466
280.9432787797215420.1134424405569170.0567212202784585
290.963075509066290.07384898186741790.0369244909337089
300.987045776754930.02590844649014130.0129542232450706
310.9897690460343560.0204619079312880.010230953965644
320.9946305556971680.01073888860566390.00536944430283193
330.9942889425428870.01142211491422530.00571105745711265
340.993002006579040.01399598684192010.00699799342096005
350.9940606041806650.01187879163867010.00593939581933504
360.9900095301581030.01998093968379440.00999046984189722
370.9904142360086130.01917152798277330.00958576399138664
380.9895960540031160.02080789199376760.0104039459968838
390.9825815757718460.03483684845630710.0174184242281536
400.9812858348544850.03742833029103020.0187141651455151
410.9719348507413050.05613029851739090.0280651492586955
420.9761334389308520.04773312213829520.0238665610691476
430.983218122287690.03356375542461960.0167818777123098
440.9416744823858230.1166510352283530.0583255176141767

\begin{tabular}{lllllllll}
\hline
Goldfeld-Quandt test for Heteroskedasticity \tabularnewline
p-values & Alternative Hypothesis \tabularnewline
breakpoint index & greater & 2-sided & less \tabularnewline
16 & 0.422166437341422 & 0.844332874682844 & 0.577833562658578 \tabularnewline
17 & 0.464081372515983 & 0.928162745031967 & 0.535918627484017 \tabularnewline
18 & 0.520487944648759 & 0.959024110702481 & 0.479512055351241 \tabularnewline
19 & 0.497287614407888 & 0.994575228815777 & 0.502712385592112 \tabularnewline
20 & 0.50483742540742 & 0.99032514918516 & 0.49516257459258 \tabularnewline
21 & 0.456983759621668 & 0.913967519243337 & 0.543016240378332 \tabularnewline
22 & 0.564024419797397 & 0.871951160405205 & 0.435975580202603 \tabularnewline
23 & 0.623025739743727 & 0.753948520512545 & 0.376974260256273 \tabularnewline
24 & 0.665120866866675 & 0.66975826626665 & 0.334879133133325 \tabularnewline
25 & 0.75281645751648 & 0.494367084967039 & 0.247183542483519 \tabularnewline
26 & 0.8310576934753 & 0.3378846130494 & 0.1689423065247 \tabularnewline
27 & 0.923974538082534 & 0.152050923834932 & 0.076025461917466 \tabularnewline
28 & 0.943278779721542 & 0.113442440556917 & 0.0567212202784585 \tabularnewline
29 & 0.96307550906629 & 0.0738489818674179 & 0.0369244909337089 \tabularnewline
30 & 0.98704577675493 & 0.0259084464901413 & 0.0129542232450706 \tabularnewline
31 & 0.989769046034356 & 0.020461907931288 & 0.010230953965644 \tabularnewline
32 & 0.994630555697168 & 0.0107388886056639 & 0.00536944430283193 \tabularnewline
33 & 0.994288942542887 & 0.0114221149142253 & 0.00571105745711265 \tabularnewline
34 & 0.99300200657904 & 0.0139959868419201 & 0.00699799342096005 \tabularnewline
35 & 0.994060604180665 & 0.0118787916386701 & 0.00593939581933504 \tabularnewline
36 & 0.990009530158103 & 0.0199809396837944 & 0.00999046984189722 \tabularnewline
37 & 0.990414236008613 & 0.0191715279827733 & 0.00958576399138664 \tabularnewline
38 & 0.989596054003116 & 0.0208078919937676 & 0.0104039459968838 \tabularnewline
39 & 0.982581575771846 & 0.0348368484563071 & 0.0174184242281536 \tabularnewline
40 & 0.981285834854485 & 0.0374283302910302 & 0.0187141651455151 \tabularnewline
41 & 0.971934850741305 & 0.0561302985173909 & 0.0280651492586955 \tabularnewline
42 & 0.976133438930852 & 0.0477331221382952 & 0.0238665610691476 \tabularnewline
43 & 0.98321812228769 & 0.0335637554246196 & 0.0167818777123098 \tabularnewline
44 & 0.941674482385823 & 0.116651035228353 & 0.0583255176141767 \tabularnewline
\hline
\end{tabular}
%Source: https://freestatistics.org/blog/index.php?pk=57832&T=5

[TABLE]
[ROW][C]Goldfeld-Quandt test for Heteroskedasticity[/C][/ROW]
[ROW][C]p-values[/C][C]Alternative Hypothesis[/C][/ROW]
[ROW][C]breakpoint index[/C][C]greater[/C][C]2-sided[/C][C]less[/C][/ROW]
[ROW][C]16[/C][C]0.422166437341422[/C][C]0.844332874682844[/C][C]0.577833562658578[/C][/ROW]
[ROW][C]17[/C][C]0.464081372515983[/C][C]0.928162745031967[/C][C]0.535918627484017[/C][/ROW]
[ROW][C]18[/C][C]0.520487944648759[/C][C]0.959024110702481[/C][C]0.479512055351241[/C][/ROW]
[ROW][C]19[/C][C]0.497287614407888[/C][C]0.994575228815777[/C][C]0.502712385592112[/C][/ROW]
[ROW][C]20[/C][C]0.50483742540742[/C][C]0.99032514918516[/C][C]0.49516257459258[/C][/ROW]
[ROW][C]21[/C][C]0.456983759621668[/C][C]0.913967519243337[/C][C]0.543016240378332[/C][/ROW]
[ROW][C]22[/C][C]0.564024419797397[/C][C]0.871951160405205[/C][C]0.435975580202603[/C][/ROW]
[ROW][C]23[/C][C]0.623025739743727[/C][C]0.753948520512545[/C][C]0.376974260256273[/C][/ROW]
[ROW][C]24[/C][C]0.665120866866675[/C][C]0.66975826626665[/C][C]0.334879133133325[/C][/ROW]
[ROW][C]25[/C][C]0.75281645751648[/C][C]0.494367084967039[/C][C]0.247183542483519[/C][/ROW]
[ROW][C]26[/C][C]0.8310576934753[/C][C]0.3378846130494[/C][C]0.1689423065247[/C][/ROW]
[ROW][C]27[/C][C]0.923974538082534[/C][C]0.152050923834932[/C][C]0.076025461917466[/C][/ROW]
[ROW][C]28[/C][C]0.943278779721542[/C][C]0.113442440556917[/C][C]0.0567212202784585[/C][/ROW]
[ROW][C]29[/C][C]0.96307550906629[/C][C]0.0738489818674179[/C][C]0.0369244909337089[/C][/ROW]
[ROW][C]30[/C][C]0.98704577675493[/C][C]0.0259084464901413[/C][C]0.0129542232450706[/C][/ROW]
[ROW][C]31[/C][C]0.989769046034356[/C][C]0.020461907931288[/C][C]0.010230953965644[/C][/ROW]
[ROW][C]32[/C][C]0.994630555697168[/C][C]0.0107388886056639[/C][C]0.00536944430283193[/C][/ROW]
[ROW][C]33[/C][C]0.994288942542887[/C][C]0.0114221149142253[/C][C]0.00571105745711265[/C][/ROW]
[ROW][C]34[/C][C]0.99300200657904[/C][C]0.0139959868419201[/C][C]0.00699799342096005[/C][/ROW]
[ROW][C]35[/C][C]0.994060604180665[/C][C]0.0118787916386701[/C][C]0.00593939581933504[/C][/ROW]
[ROW][C]36[/C][C]0.990009530158103[/C][C]0.0199809396837944[/C][C]0.00999046984189722[/C][/ROW]
[ROW][C]37[/C][C]0.990414236008613[/C][C]0.0191715279827733[/C][C]0.00958576399138664[/C][/ROW]
[ROW][C]38[/C][C]0.989596054003116[/C][C]0.0208078919937676[/C][C]0.0104039459968838[/C][/ROW]
[ROW][C]39[/C][C]0.982581575771846[/C][C]0.0348368484563071[/C][C]0.0174184242281536[/C][/ROW]
[ROW][C]40[/C][C]0.981285834854485[/C][C]0.0374283302910302[/C][C]0.0187141651455151[/C][/ROW]
[ROW][C]41[/C][C]0.971934850741305[/C][C]0.0561302985173909[/C][C]0.0280651492586955[/C][/ROW]
[ROW][C]42[/C][C]0.976133438930852[/C][C]0.0477331221382952[/C][C]0.0238665610691476[/C][/ROW]
[ROW][C]43[/C][C]0.98321812228769[/C][C]0.0335637554246196[/C][C]0.0167818777123098[/C][/ROW]
[ROW][C]44[/C][C]0.941674482385823[/C][C]0.116651035228353[/C][C]0.0583255176141767[/C][/ROW]
[/TABLE]
Source: https://freestatistics.org/blog/index.php?pk=57832&T=5

Globally Unique Identifier (entire table): ba.freestatistics.org/blog/index.php?pk=57832&T=5

As an alternative you can also use a QR Code:  

The GUIDs for individual cells are displayed in the table below:

Goldfeld-Quandt test for Heteroskedasticity
p-valuesAlternative Hypothesis
breakpoint indexgreater2-sidedless
160.4221664373414220.8443328746828440.577833562658578
170.4640813725159830.9281627450319670.535918627484017
180.5204879446487590.9590241107024810.479512055351241
190.4972876144078880.9945752288157770.502712385592112
200.504837425407420.990325149185160.49516257459258
210.4569837596216680.9139675192433370.543016240378332
220.5640244197973970.8719511604052050.435975580202603
230.6230257397437270.7539485205125450.376974260256273
240.6651208668666750.669758266266650.334879133133325
250.752816457516480.4943670849670390.247183542483519
260.83105769347530.33788461304940.1689423065247
270.9239745380825340.1520509238349320.076025461917466
280.9432787797215420.1134424405569170.0567212202784585
290.963075509066290.07384898186741790.0369244909337089
300.987045776754930.02590844649014130.0129542232450706
310.9897690460343560.0204619079312880.010230953965644
320.9946305556971680.01073888860566390.00536944430283193
330.9942889425428870.01142211491422530.00571105745711265
340.993002006579040.01399598684192010.00699799342096005
350.9940606041806650.01187879163867010.00593939581933504
360.9900095301581030.01998093968379440.00999046984189722
370.9904142360086130.01917152798277330.00958576399138664
380.9895960540031160.02080789199376760.0104039459968838
390.9825815757718460.03483684845630710.0174184242281536
400.9812858348544850.03742833029103020.0187141651455151
410.9719348507413050.05613029851739090.0280651492586955
420.9761334389308520.04773312213829520.0238665610691476
430.983218122287690.03356375542461960.0167818777123098
440.9416744823858230.1166510352283530.0583255176141767


Meta Analysis of Goldfeld-Quandt test for Heteroskedasticity
Description# significant tests% significant testsOK/NOK
1% type I error level00OK
5% type I error level130.448275862068966NOK
10% type I error level150.517241379310345NOK

\begin{tabular}{lllllllll}
\hline
Meta Analysis of Goldfeld-Quandt test for Heteroskedasticity \tabularnewline
Description & # significant tests & % significant tests & OK/NOK \tabularnewline
1% type I error level & 0 & 0 & OK \tabularnewline
5% type I error level & 13 & 0.448275862068966 & NOK \tabularnewline
10% type I error level & 15 & 0.517241379310345 & NOK \tabularnewline
\hline
\end{tabular}
%Source: https://freestatistics.org/blog/index.php?pk=57832&T=6

[TABLE]
[ROW][C]Meta Analysis of Goldfeld-Quandt test for Heteroskedasticity[/C][/ROW]
[ROW][C]Description[/C][C]# significant tests[/C][C]% significant tests[/C][C]OK/NOK[/C][/ROW]
[ROW][C]1% type I error level[/C][C]0[/C][C]0[/C][C]OK[/C][/ROW]
[ROW][C]5% type I error level[/C][C]13[/C][C]0.448275862068966[/C][C]NOK[/C][/ROW]
[ROW][C]10% type I error level[/C][C]15[/C][C]0.517241379310345[/C][C]NOK[/C][/ROW]
[/TABLE]
Source: https://freestatistics.org/blog/index.php?pk=57832&T=6

Globally Unique Identifier (entire table): ba.freestatistics.org/blog/index.php?pk=57832&T=6

As an alternative you can also use a QR Code:  

The GUIDs for individual cells are displayed in the table below:

Meta Analysis of Goldfeld-Quandt test for Heteroskedasticity
Description# significant tests% significant testsOK/NOK
1% type I error level00OK
5% type I error level130.448275862068966NOK
10% type I error level150.517241379310345NOK


Parameters (Session):
par1 = 1 ; par2 = Include Monthly Dummies ; par3 = No Linear Trend ;
Parameters (R input):
par1 = 1 ; par2 = Include Monthly Dummies ; par3 = No Linear Trend ;
R code (references can be found in the software module):
library(lattice)
library(lmtest)
n25 <- 25 #minimum number of obs. for Goldfeld-Quandt test
par1 <- as.numeric(par1)
x <- t(y)
k <- length(x[1,])
n <- length(x[,1])
x1 <- cbind(x[,par1], x[,1:k!=par1])
mycolnames <- c(colnames(x)[par1], colnames(x)[1:k!=par1])
colnames(x1) <- mycolnames #colnames(x)[par1]
x <- x1
if (par3 == 'First Differences'){
x2 <- array(0, dim=c(n-1,k), dimnames=list(1:(n-1), paste('(1-B)',colnames(x),sep='')))
for (i in 1:n-1) {
for (j in 1:k) {
x2[i,j] <- x[i+1,j] - x[i,j]
}
}
x <- x2
}
if (par2 == 'Include Monthly Dummies'){
x2 <- array(0, dim=c(n,11), dimnames=list(1:n, paste('M', seq(1:11), sep ='')))
for (i in 1:11){
x2[seq(i,n,12),i] <- 1
}
x <- cbind(x, x2)
}
if (par2 == 'Include Quarterly Dummies'){
x2 <- array(0, dim=c(n,3), dimnames=list(1:n, paste('Q', seq(1:3), sep ='')))
for (i in 1:3){
x2[seq(i,n,4),i] <- 1
}
x <- cbind(x, x2)
}
k <- length(x[1,])
if (par3 == 'Linear Trend'){
x <- cbind(x, c(1:n))
colnames(x)[k+1] <- 't'
}
x
k <- length(x[1,])
df <- as.data.frame(x)
(mylm <- lm(df))
(mysum <- summary(mylm))
if (n > n25) {
kp3 <- k + 3
nmkm3 <- n - k - 3
gqarr <- array(NA, dim=c(nmkm3-kp3+1,3))
numgqtests <- 0
numsignificant1 <- 0
numsignificant5 <- 0
numsignificant10 <- 0
for (mypoint in kp3:nmkm3) {
j <- 0
numgqtests <- numgqtests + 1
for (myalt in c('greater', 'two.sided', 'less')) {
j <- j + 1
gqarr[mypoint-kp3+1,j] <- gqtest(mylm, point=mypoint, alternative=myalt)$p.value
}
if (gqarr[mypoint-kp3+1,2] < 0.01) numsignificant1 <- numsignificant1 + 1
if (gqarr[mypoint-kp3+1,2] < 0.05) numsignificant5 <- numsignificant5 + 1
if (gqarr[mypoint-kp3+1,2] < 0.10) numsignificant10 <- numsignificant10 + 1
}
gqarr
}
bitmap(file='test0.png')
plot(x[,1], type='l', main='Actuals and Interpolation', ylab='value of Actuals and Interpolation (dots)', xlab='time or index')
points(x[,1]-mysum$resid)
grid()
dev.off()
bitmap(file='test1.png')
plot(mysum$resid, type='b', pch=19, main='Residuals', ylab='value of Residuals', xlab='time or index')
grid()
dev.off()
bitmap(file='test2.png')
hist(mysum$resid, main='Residual Histogram', xlab='values of Residuals')
grid()
dev.off()
bitmap(file='test3.png')
densityplot(~mysum$resid,col='black',main='Residual Density Plot', xlab='values of Residuals')
dev.off()
bitmap(file='test4.png')
qqnorm(mysum$resid, main='Residual Normal Q-Q Plot')
qqline(mysum$resid)
grid()
dev.off()
(myerror <- as.ts(mysum$resid))
bitmap(file='test5.png')
dum <- cbind(lag(myerror,k=1),myerror)
dum
dum1 <- dum[2:length(myerror),]
dum1
z <- as.data.frame(dum1)
z
plot(z,main=paste('Residual Lag plot, lowess, and regression line'), ylab='values of Residuals', xlab='lagged values of Residuals')
lines(lowess(z))
abline(lm(z))
grid()
dev.off()
bitmap(file='test6.png')
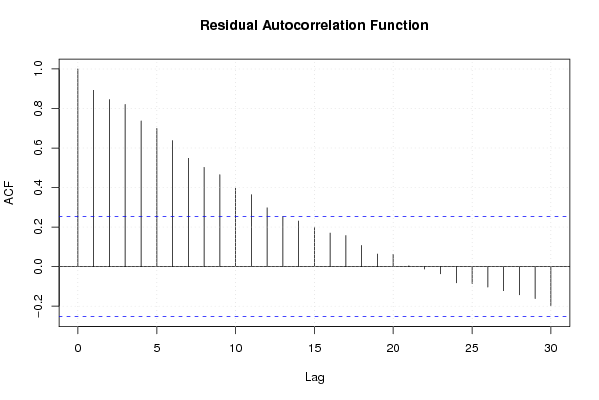
acf(mysum$resid, lag.max=length(mysum$resid)/2, main='Residual Autocorrelation Function')
grid()
dev.off()
bitmap(file='test7.png')
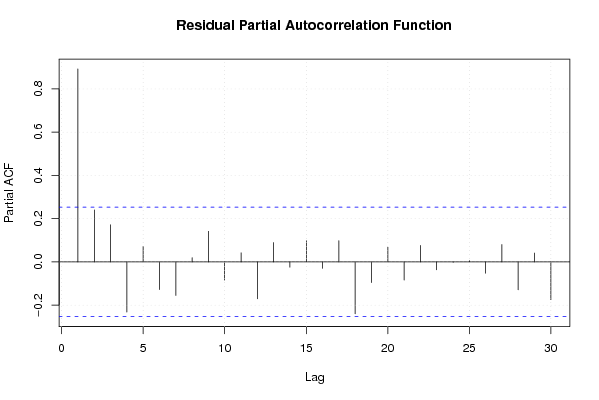
pacf(mysum$resid, lag.max=length(mysum$resid)/2, main='Residual Partial Autocorrelation Function')
grid()
dev.off()
bitmap(file='test8.png')
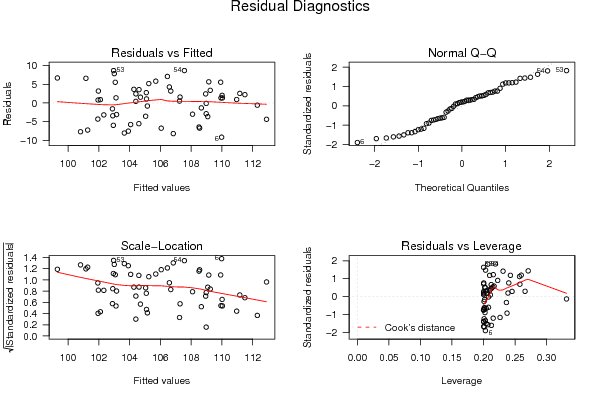
opar <- par(mfrow = c(2,2), oma = c(0, 0, 1.1, 0))
plot(mylm, las = 1, sub='Residual Diagnostics')
par(opar)
dev.off()
if (n > n25) {
bitmap(file='test9.png')
plot(kp3:nmkm3,gqarr[,2], main='Goldfeld-Quandt test',ylab='2-sided p-value',xlab='breakpoint')
grid()
dev.off()
}
load(file='createtable')
a<-table.start()
a<-table.row.start(a)
a<-table.element(a, 'Multiple Linear Regression - Estimated Regression Equation', 1, TRUE)
a<-table.row.end(a)
myeq <- colnames(x)[1]
myeq <- paste(myeq, '[t] = ', sep='')
for (i in 1:k){
if (mysum$coefficients[i,1] > 0) myeq <- paste(myeq, '+', '')
myeq <- paste(myeq, mysum$coefficients[i,1], sep=' ')
if (rownames(mysum$coefficients)[i] != '(Intercept)') {
myeq <- paste(myeq, rownames(mysum$coefficients)[i], sep='')
if (rownames(mysum$coefficients)[i] != 't') myeq <- paste(myeq, '[t]', sep='')
}
}
myeq <- paste(myeq, ' + e[t]')
a<-table.row.start(a)
a<-table.element(a, myeq)
a<-table.row.end(a)
a<-table.end(a)
table.save(a,file='mytable1.tab')
a<-table.start()
a<-table.row.start(a)
a<-table.element(a,hyperlink('ols1.htm','Multiple Linear Regression - Ordinary Least Squares',''), 6, TRUE)
a<-table.row.end(a)
a<-table.row.start(a)
a<-table.element(a,'Variable',header=TRUE)
a<-table.element(a,'Parameter',header=TRUE)
a<-table.element(a,'S.D.',header=TRUE)
a<-table.element(a,'T-STAT
H0: parameter = 0',header=TRUE)
a<-table.element(a,'2-tail p-value',header=TRUE)
a<-table.element(a,'1-tail p-value',header=TRUE)
a<-table.row.end(a)
for (i in 1:k){
a<-table.row.start(a)
a<-table.element(a,rownames(mysum$coefficients)[i],header=TRUE)
a<-table.element(a,mysum$coefficients[i,1])
a<-table.element(a, round(mysum$coefficients[i,2],6))
a<-table.element(a, round(mysum$coefficients[i,3],4))
a<-table.element(a, round(mysum$coefficients[i,4],6))
a<-table.element(a, round(mysum$coefficients[i,4]/2,6))
a<-table.row.end(a)
}
a<-table.end(a)
table.save(a,file='mytable2.tab')
a<-table.start()
a<-table.row.start(a)
a<-table.element(a, 'Multiple Linear Regression - Regression Statistics', 2, TRUE)
a<-table.row.end(a)
a<-table.row.start(a)
a<-table.element(a, 'Multiple R',1,TRUE)
a<-table.element(a, sqrt(mysum$r.squared))
a<-table.row.end(a)
a<-table.row.start(a)
a<-table.element(a, 'R-squared',1,TRUE)
a<-table.element(a, mysum$r.squared)
a<-table.row.end(a)
a<-table.row.start(a)
a<-table.element(a, 'Adjusted R-squared',1,TRUE)
a<-table.element(a, mysum$adj.r.squared)
a<-table.row.end(a)
a<-table.row.start(a)
a<-table.element(a, 'F-TEST (value)',1,TRUE)
a<-table.element(a, mysum$fstatistic[1])
a<-table.row.end(a)
a<-table.row.start(a)
a<-table.element(a, 'F-TEST (DF numerator)',1,TRUE)
a<-table.element(a, mysum$fstatistic[2])
a<-table.row.end(a)
a<-table.row.start(a)
a<-table.element(a, 'F-TEST (DF denominator)',1,TRUE)
a<-table.element(a, mysum$fstatistic[3])
a<-table.row.end(a)
a<-table.row.start(a)
a<-table.element(a, 'p-value',1,TRUE)
a<-table.element(a, 1-pf(mysum$fstatistic[1],mysum$fstatistic[2],mysum$fstatistic[3]))
a<-table.row.end(a)
a<-table.row.start(a)
a<-table.element(a, 'Multiple Linear Regression - Residual Statistics', 2, TRUE)
a<-table.row.end(a)
a<-table.row.start(a)
a<-table.element(a, 'Residual Standard Deviation',1,TRUE)
a<-table.element(a, mysum$sigma)
a<-table.row.end(a)
a<-table.row.start(a)
a<-table.element(a, 'Sum Squared Residuals',1,TRUE)
a<-table.element(a, sum(myerror*myerror))
a<-table.row.end(a)
a<-table.end(a)
table.save(a,file='mytable3.tab')
a<-table.start()
a<-table.row.start(a)
a<-table.element(a, 'Multiple Linear Regression - Actuals, Interpolation, and Residuals', 4, TRUE)
a<-table.row.end(a)
a<-table.row.start(a)
a<-table.element(a, 'Time or Index', 1, TRUE)
a<-table.element(a, 'Actuals', 1, TRUE)
a<-table.element(a, 'Interpolation
Forecast', 1, TRUE)
a<-table.element(a, 'Residuals
Prediction Error', 1, TRUE)
a<-table.row.end(a)
for (i in 1:n) {
a<-table.row.start(a)
a<-table.element(a,i, 1, TRUE)
a<-table.element(a,x[i])
a<-table.element(a,x[i]-mysum$resid[i])
a<-table.element(a,mysum$resid[i])
a<-table.row.end(a)
}
a<-table.end(a)
table.save(a,file='mytable4.tab')
if (n > n25) {
a<-table.start()
a<-table.row.start(a)
a<-table.element(a,'Goldfeld-Quandt test for Heteroskedasticity',4,TRUE)
a<-table.row.end(a)
a<-table.row.start(a)
a<-table.element(a,'p-values',header=TRUE)
a<-table.element(a,'Alternative Hypothesis',3,header=TRUE)
a<-table.row.end(a)
a<-table.row.start(a)
a<-table.element(a,'breakpoint index',header=TRUE)
a<-table.element(a,'greater',header=TRUE)
a<-table.element(a,'2-sided',header=TRUE)
a<-table.element(a,'less',header=TRUE)
a<-table.row.end(a)
for (mypoint in kp3:nmkm3) {
a<-table.row.start(a)
a<-table.element(a,mypoint,header=TRUE)
a<-table.element(a,gqarr[mypoint-kp3+1,1])
a<-table.element(a,gqarr[mypoint-kp3+1,2])
a<-table.element(a,gqarr[mypoint-kp3+1,3])
a<-table.row.end(a)
}
a<-table.end(a)
table.save(a,file='mytable5.tab')
a<-table.start()
a<-table.row.start(a)
a<-table.element(a,'Meta Analysis of Goldfeld-Quandt test for Heteroskedasticity',4,TRUE)
a<-table.row.end(a)
a<-table.row.start(a)
a<-table.element(a,'Description',header=TRUE)
a<-table.element(a,'# significant tests',header=TRUE)
a<-table.element(a,'% significant tests',header=TRUE)
a<-table.element(a,'OK/NOK',header=TRUE)
a<-table.row.end(a)
a<-table.row.start(a)
a<-table.element(a,'1% type I error level',header=TRUE)
a<-table.element(a,numsignificant1)
a<-table.element(a,numsignificant1/numgqtests)
if (numsignificant1/numgqtests < 0.01) dum <- 'OK' else dum <- 'NOK'
a<-table.element(a,dum)
a<-table.row.end(a)
a<-table.row.start(a)
a<-table.element(a,'5% type I error level',header=TRUE)
a<-table.element(a,numsignificant5)
a<-table.element(a,numsignificant5/numgqtests)
if (numsignificant5/numgqtests < 0.05) dum <- 'OK' else dum <- 'NOK'
a<-table.element(a,dum)
a<-table.row.end(a)
a<-table.row.start(a)
a<-table.element(a,'10% type I error level',header=TRUE)
a<-table.element(a,numsignificant10)
a<-table.element(a,numsignificant10/numgqtests)
if (numsignificant10/numgqtests < 0.1) dum <- 'OK' else dum <- 'NOK'
a<-table.element(a,dum)
a<-table.row.end(a)
a<-table.end(a)
table.save(a,file='mytable6.tab')
}