| Multiple Linear Regression - Estimated Regression Equation |
| BESTC[t] = + 53.3118683218126 + 0.562524427468587INDUSTR[t] -0.486068748183151M1[t] + 0.643760885364526M2[t] -4.60851661067863M3[t] -6.00042832052068M4[t] -10.3130778166284M5[t] -7.00809149601084M6[t] -7.7738077861042M7[t] -10.5359586105817M8[t] -6.56459247310959M9[t] -2.71876905342549M10[t] + 0.933573282405774M11[t] + e[t] |
| Multiple Linear Regression - Ordinary Least Squares | |||||
| Variable | Parameter | S.D. | T-STAT H0: parameter = 0 | 2-tail p-value | 1-tail p-value |
| (Intercept) | 53.3118683218126 | 16.87502 | 3.1592 | 0.002765 | 0.001383 |
| INDUSTR | 0.562524427468587 | 0.171301 | 3.2838 | 0.001938 | 0.000969 |
| M1 | -0.486068748183151 | 3.639218 | -0.1336 | 0.894318 | 0.447159 |
| M2 | 0.643760885364526 | 3.869804 | 0.1664 | 0.868591 | 0.434296 |
| M3 | -4.60851661067863 | 3.412023 | -1.3507 | 0.183269 | 0.091634 |
| M4 | -6.00042832052068 | 3.63209 | -1.6521 | 0.105189 | 0.052594 |
| M5 | -10.3130778166284 | 4.112553 | -2.5077 | 0.015664 | 0.007832 |
| M6 | -7.00809149601084 | 4.166935 | -1.6818 | 0.099235 | 0.049617 |
| M7 | -7.7738077861042 | 4.035715 | -1.9263 | 0.060133 | 0.030066 |
| M8 | -10.5359586105817 | 3.710585 | -2.8394 | 0.006657 | 0.003328 |
| M9 | -6.56459247310959 | 4.170877 | -1.5739 | 0.122216 | 0.061108 |
| M10 | -2.71876905342549 | 3.41265 | -0.7967 | 0.429647 | 0.214823 |
| M11 | 0.933573282405774 | 3.44854 | 0.2707 | 0.787795 | 0.393898 |
| Multiple Linear Regression - Regression Statistics | |
| Multiple R | 0.56286069610102 |
| R-squared | 0.316812163215325 |
| Adjusted R-squared | 0.142381226163919 |
| F-TEST (value) | 1.81626131562865 |
| F-TEST (DF numerator) | 12 |
| F-TEST (DF denominator) | 47 |
| p-value | 0.0728147785907012 |
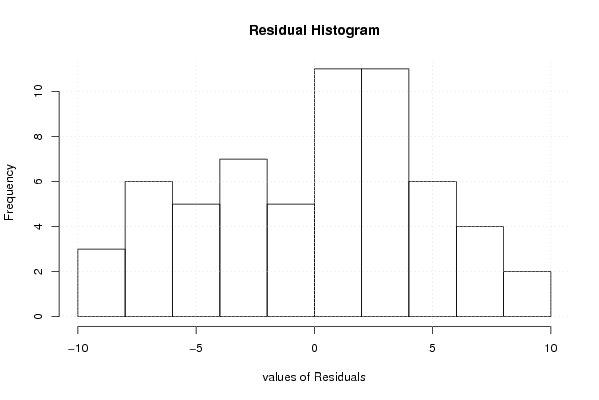
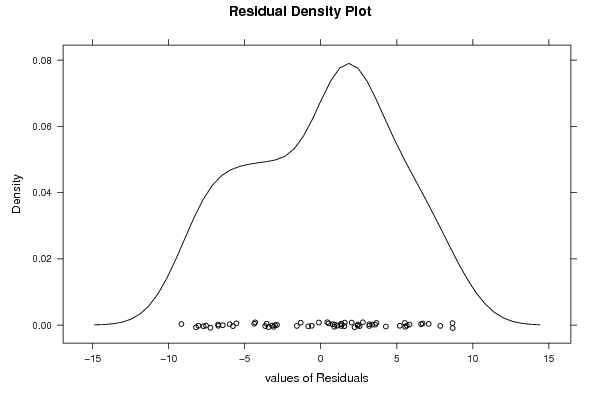
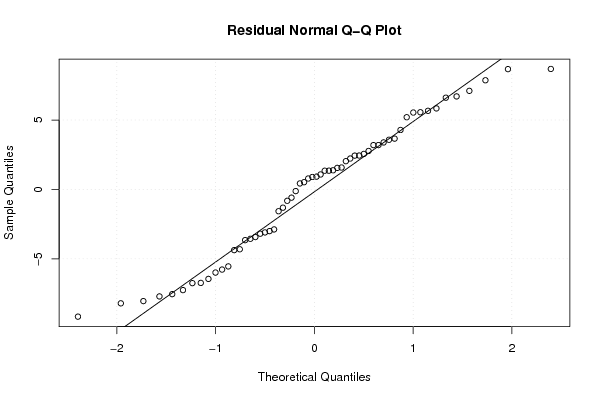
| Multiple Linear Regression - Residual Statistics | |
| Residual Standard Deviation | 5.39173682080917 |
| Sum Squared Residuals | 1366.32881940886 |
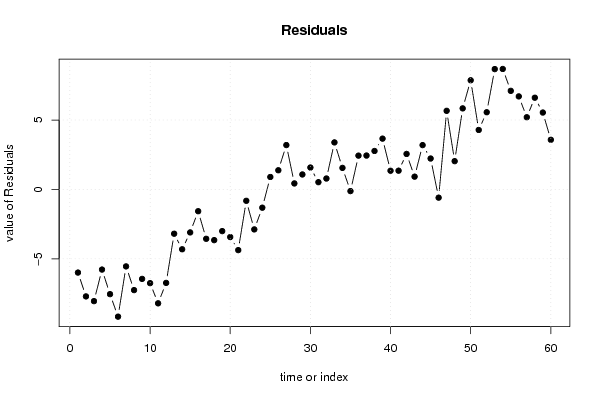
| Multiple Linear Regression - Actuals, Interpolation, and Residuals | |||
| Time or Index | Actuals | Interpolation Forecast | Residuals Prediction Error |
| 1 | 96.96 | 102.946726061081 | -5.9867260610811 |
| 2 | 93.11 | 100.813914015311 | -7.70391401531056 |
| 3 | 95.62 | 103.661988274815 | -8.04198827481507 |
| 4 | 98.3 | 104.070154732873 | -5.77015473287252 |
| 5 | 96.38 | 103.920186000032 | -7.5401860000323 |
| 6 | 100.82 | 109.981542015246 | -9.16154201524597 |
| 7 | 99.06 | 104.603125419910 | -5.5431254199102 |
| 8 | 94.03 | 101.278450167964 | -7.24845016796409 |
| 9 | 102.07 | 108.512457984754 | -6.44245798475403 |
| 10 | 99.31 | 106.05800781679 | -6.74800781678995 |
| 11 | 98.64 | 106.841475572531 | -8.20147557253142 |
| 12 | 101.82 | 108.551767099228 | -6.73176709922801 |
| 13 | 99.14 | 102.327949190865 | -3.18794919086526 |
| 14 | 97.63 | 101.938962870248 | -4.30896287024775 |
| 15 | 100.06 | 103.155716290093 | -3.09571629009335 |
| 16 | 101.32 | 102.888853435188 | -1.56885343518848 |
| 17 | 101.49 | 105.045234854969 | -3.55523485496948 |
| 18 | 105.43 | 109.081502931296 | -3.65150293129622 |
| 19 | 105.09 | 108.090776870215 | -3.00077687021545 |
| 20 | 99.48 | 102.909771007623 | -3.42977100762299 |
| 21 | 108.53 | 112.900148519009 | -4.37014851900901 |
| 22 | 104.34 | 105.157968732840 | -0.817968732840203 |
| 23 | 106.1 | 108.979068396912 | -2.87906839691205 |
| 24 | 107.35 | 108.664271984722 | -1.31427198472173 |
| 25 | 103 | 102.102939419878 | 0.897060580122177 |
| 26 | 104.5 | 103.120264167932 | 1.37973583206821 |
| 27 | 105.17 | 101.974414992409 | 3.19558500759068 |
| 28 | 104.84 | 104.407669389354 | 0.432330610646340 |
| 29 | 106.18 | 105.101487297716 | 1.07851270228367 |
| 30 | 108.86 | 107.281424763397 | 1.57857523660325 |
| 31 | 107.77 | 107.246990229013 | 0.523009770987429 |
| 32 | 102.74 | 101.953479480926 | 0.786520519073607 |
| 33 | 112.63 | 109.243739740463 | 3.38626025953680 |
| 34 | 106.26 | 104.707949190865 | 1.55205080913467 |
| 35 | 108.86 | 108.979068396912 | -0.119068396912045 |
| 36 | 111.38 | 108.945534198456 | 2.43446580154398 |
| 37 | 106.85 | 104.409289572499 | 2.44071042750096 |
| 38 | 107.86 | 105.089099664072 | 2.77090033592816 |
| 39 | 107.94 | 104.280765145031 | 3.65923485496947 |
| 40 | 111.38 | 110.032913664040 | 1.34708633596046 |
| 41 | 111.29 | 109.939197373946 | 1.35080262605382 |
| 42 | 113.72 | 111.16284331293 | 2.55715668707 |
| 43 | 111.88 | 110.959651450305 | 0.920348549694754 |
| 44 | 109.87 | 106.678684671663 | 3.19131532833748 |
| 45 | 113.72 | 111.493837450338 | 2.22616254966246 |
| 46 | 111.71 | 112.302028961691 | -0.592028961691276 |
| 47 | 114.81 | 109.147825725153 | 5.66217427484738 |
| 48 | 112.05 | 110.014330610646 | 2.03566938935367 |
| 49 | 111.54 | 105.703095755677 | 5.83690424432322 |
| 50 | 110.87 | 103.007759282438 | 7.86224071756194 |
| 51 | 110.87 | 106.587115297652 | 4.28288470234826 |
| 52 | 115.48 | 109.920408778546 | 5.55959122145418 |
| 53 | 111.63 | 102.963894473336 | 8.6661055266643 |
| 54 | 116.24 | 107.562686977131 | 8.67731302286895 |
| 55 | 113.56 | 106.459456030557 | 7.10054396944346 |
| 56 | 106.01 | 99.309614671824 | 6.70038532817598 |
| 57 | 110.45 | 105.249816305436 | 5.20018369456378 |
| 58 | 107.77 | 101.164045297813 | 6.60595470218676 |
| 59 | 108.61 | 103.072561908492 | 5.53743809150813 |
| 60 | 108.19 | 104.614096106948 | 3.57590389305211 |
| Goldfeld-Quandt test for Heteroskedasticity | |||
| p-values | Alternative Hypothesis | ||
| breakpoint index | greater | 2-sided | less |
| 16 | 0.422166437341422 | 0.844332874682844 | 0.577833562658578 |
| 17 | 0.464081372515983 | 0.928162745031967 | 0.535918627484017 |
| 18 | 0.520487944648759 | 0.959024110702481 | 0.479512055351241 |
| 19 | 0.497287614407888 | 0.994575228815777 | 0.502712385592112 |
| 20 | 0.50483742540742 | 0.99032514918516 | 0.49516257459258 |
| 21 | 0.456983759621668 | 0.913967519243337 | 0.543016240378332 |
| 22 | 0.564024419797397 | 0.871951160405205 | 0.435975580202603 |
| 23 | 0.623025739743727 | 0.753948520512545 | 0.376974260256273 |
| 24 | 0.665120866866675 | 0.66975826626665 | 0.334879133133325 |
| 25 | 0.75281645751648 | 0.494367084967039 | 0.247183542483519 |
| 26 | 0.8310576934753 | 0.3378846130494 | 0.1689423065247 |
| 27 | 0.923974538082534 | 0.152050923834932 | 0.076025461917466 |
| 28 | 0.943278779721542 | 0.113442440556917 | 0.0567212202784585 |
| 29 | 0.96307550906629 | 0.0738489818674179 | 0.0369244909337089 |
| 30 | 0.98704577675493 | 0.0259084464901413 | 0.0129542232450706 |
| 31 | 0.989769046034356 | 0.020461907931288 | 0.010230953965644 |
| 32 | 0.994630555697168 | 0.0107388886056639 | 0.00536944430283193 |
| 33 | 0.994288942542887 | 0.0114221149142253 | 0.00571105745711265 |
| 34 | 0.99300200657904 | 0.0139959868419201 | 0.00699799342096005 |
| 35 | 0.994060604180665 | 0.0118787916386701 | 0.00593939581933504 |
| 36 | 0.990009530158103 | 0.0199809396837944 | 0.00999046984189722 |
| 37 | 0.990414236008613 | 0.0191715279827733 | 0.00958576399138664 |
| 38 | 0.989596054003116 | 0.0208078919937676 | 0.0104039459968838 |
| 39 | 0.982581575771846 | 0.0348368484563071 | 0.0174184242281536 |
| 40 | 0.981285834854485 | 0.0374283302910302 | 0.0187141651455151 |
| 41 | 0.971934850741305 | 0.0561302985173909 | 0.0280651492586955 |
| 42 | 0.976133438930852 | 0.0477331221382952 | 0.0238665610691476 |
| 43 | 0.98321812228769 | 0.0335637554246196 | 0.0167818777123098 |
| 44 | 0.941674482385823 | 0.116651035228353 | 0.0583255176141767 |
| Meta Analysis of Goldfeld-Quandt test for Heteroskedasticity | |||
| Description | # significant tests | % significant tests | OK/NOK |
| 1% type I error level | 0 | 0 | OK |
| 5% type I error level | 13 | 0.448275862068966 | NOK |
| 10% type I error level | 15 | 0.517241379310345 | NOK |