| Multiple Linear Regression - Estimated Regression Equation |
| BESTC[t] = + 56.7055652840370 + 0.427784443400585INDUSTR[t] + 1.49132630137853M1[t] + 1.91125215674213M2[t] -2.08103055041091M3[t] -2.85161499584517M4[t] -6.61030721957914M5[t] -3.50051793800585M6[t] -4.72282683623544M7[t] -8.30267342615144M8[t] -3.86358360610904M9[t] -2.07236900560768M10[t] + 0.800004760324151M11[t] + 0.270651430122387t + e[t] |
| Multiple Linear Regression - Ordinary Least Squares | |||||
| Variable | Parameter | S.D. | T-STAT H0: parameter = 0 | 2-tail p-value | 1-tail p-value |
| (Intercept) | 56.7055652840370 | 5.026098 | 11.2822 | 0 | 0 |
| INDUSTR | 0.427784443400585 | 0.051363 | 8.3287 | 0 | 0 |
| M1 | 1.49132630137853 | 1.087123 | 1.3718 | 0.176777 | 0.088388 |
| M2 | 1.91125215674213 | 1.153488 | 1.6569 | 0.104339 | 0.05217 |
| M3 | -2.08103055041091 | 1.022239 | -2.0358 | 0.047558 | 0.023779 |
| M4 | -2.85161499584517 | 1.090707 | -2.6145 | 0.012041 | 0.006021 |
| M5 | -6.61030721957914 | 1.235823 | -5.3489 | 3e-06 | 1e-06 |
| M6 | -3.50051793800585 | 1.250703 | -2.7988 | 0.007469 | 0.003735 |
| M7 | -4.72282683623544 | 1.209414 | -3.9051 | 0.000306 | 0.000153 |
| M8 | -8.30267342615144 | 1.109301 | -7.4846 | 0 | 0 |
| M9 | -3.86358360610904 | 1.24773 | -3.0965 | 0.003331 | 0.001666 |
| M10 | -2.07236900560768 | 1.016378 | -2.039 | 0.047223 | 0.023611 |
| M11 | 0.800004760324151 | 1.026656 | 0.7792 | 0.439833 | 0.219916 |
| t | 0.270651430122387 | 0.012298 | 22.0072 | 0 | 0 |
| Multiple Linear Regression - Regression Statistics | |
| Multiple R | 0.969917333827114 |
| R-squared | 0.940739634458297 |
| Adjusted R-squared | 0.923992139848686 |
| F-TEST (value) | 56.1719622180619 |
| F-TEST (DF numerator) | 13 |
| F-TEST (DF denominator) | 46 |
| p-value | 0 |
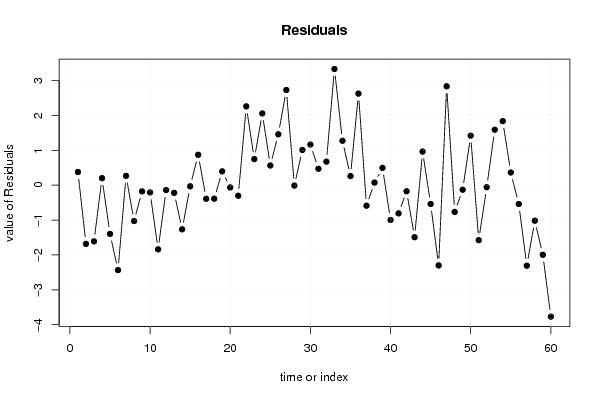
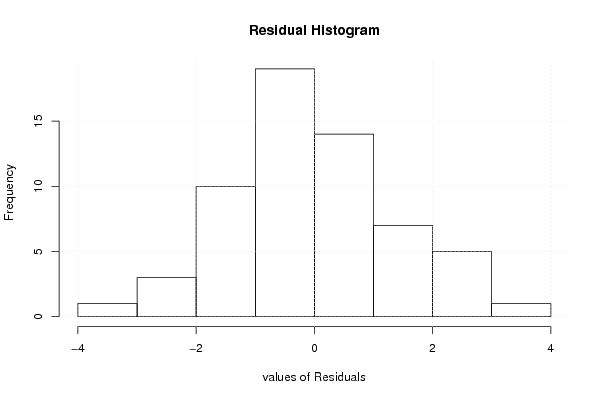
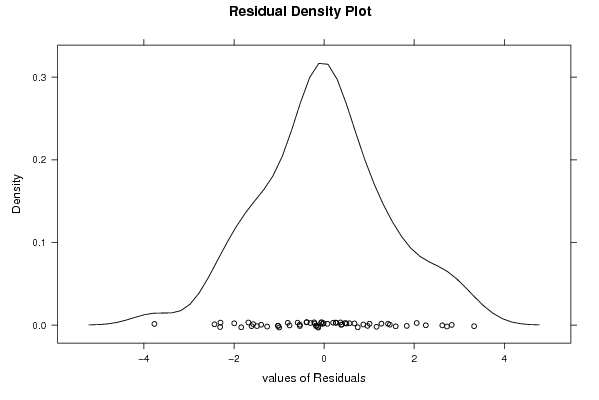
| Multiple Linear Regression - Residual Statistics | |
| Residual Standard Deviation | 1.60513216920770 |
| Sum Squared Residuals | 118.516666908769 |
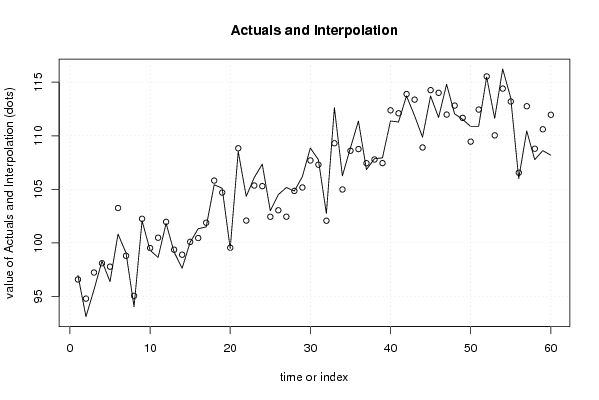
| Multiple Linear Regression - Actuals, Interpolation, and Residuals | |||
| Time or Index | Actuals | Interpolation Forecast | Residuals Prediction Error |
| 1 | 96.96 | 96.5831369225304 | 0.376863077469554 |
| 2 | 93.11 | 94.7925644362927 | -1.68256443629265 |
| 3 | 95.62 | 97.2310291442304 | -1.61102914423043 |
| 4 | 98.3 | 98.1000063478004 | 0.199993652199554 |
| 5 | 96.38 | 97.7775704353532 | -1.39757043535318 |
| 6 | 100.82 | 103.254154919712 | -2.43415491971174 |
| 7 | 99.06 | 98.7946650157197 | 0.265334984280270 |
| 8 | 94.03 | 95.0576854125255 | -1.02768541252553 |
| 9 | 102.07 | 102.248576434414 | -0.178576434413718 |
| 10 | 99.31 | 99.519256698951 | -0.20925669895091 |
| 11 | 98.64 | 100.480581233662 | -1.84058123366214 |
| 12 | 101.82 | 101.961814787443 | -0.141814787443135 |
| 13 | 99.14 | 99.360391196258 | -0.220391196258066 |
| 14 | 97.63 | 98.8959504845625 | -1.26595048456249 |
| 15 | 100.06 | 100.093840306639 | -0.0338403066385519 |
| 16 | 101.32 | 100.449476178128 | 0.870523821872151 |
| 17 | 101.49 | 101.880956483623 | -0.390956483623005 |
| 18 | 105.43 | 105.817516971739 | -0.387516971739418 |
| 19 | 105.09 | 104.694745726272 | 0.395254273727996 |
| 20 | 99.48 | 99.5460774598559 | -0.0660774598558651 |
| 21 | 108.53 | 108.833112254407 | -0.303112254406920 |
| 22 | 104.34 | 102.082618750979 | 2.25738124902139 |
| 23 | 106.1 | 105.353979280053 | 0.746020719946994 |
| 24 | 107.35 | 105.295188837592 | 2.05481116240811 |
| 25 | 103 | 102.437094580366 | 0.562905419633528 |
| 26 | 104.5 | 103.042114977172 | 1.45788502282766 |
| 27 | 105.17 | 102.443310136966 | 2.72668986303404 |
| 28 | 104.84 | 104.852311336778 | -0.0123113367780628 |
| 29 | 106.18 | 105.171552089432 | 1.00844791056831 |
| 30 | 108.86 | 107.696423914326 | 1.16357608567380 |
| 31 | 107.77 | 107.300886222640 | 0.469113777360228 |
| 32 | 102.74 | 102.066661067544 | 0.673338932456485 |
| 33 | 112.63 | 109.300330533772 | 3.32966946622824 |
| 34 | 106.26 | 104.988208357727 | 1.27179164227322 |
| 35 | 108.86 | 108.601796441522 | 0.258203558478359 |
| 36 | 111.38 | 108.756898220761 | 2.62310177923918 |
| 37 | 106.85 | 107.438827959778 | -0.588827959777521 |
| 38 | 107.86 | 107.787177690543 | 0.07282230945697 |
| 39 | 107.94 | 107.445043516377 | 0.494956483622992 |
| 40 | 111.38 | 112.377972932253 | -0.997972932252565 |
| 41 | 111.29 | 112.098315464145 | -0.808315464145366 |
| 42 | 113.72 | 113.895953735259 | -0.175953735258875 |
| 43 | 111.88 | 113.372080710552 | -1.49208071055227 |
| 44 | 109.87 | 108.907867553577 | 0.962132446422937 |
| 45 | 113.72 | 114.259285468843 | -0.539285468842736 |
| 46 | 111.71 | 114.011115505103 | -2.30111550510333 |
| 47 | 114.81 | 111.977948936010 | 2.83205106398955 |
| 48 | 112.05 | 112.817505824691 | -0.767505824690569 |
| 49 | 111.54 | 111.670549341067 | -0.130549341067496 |
| 50 | 110.87 | 109.452192411429 | 1.41780758857051 |
| 51 | 110.87 | 112.446776895788 | -1.57677689578804 |
| 52 | 115.48 | 115.540233205041 | -0.0602332050410774 |
| 53 | 111.63 | 110.041605527447 | 1.58839447255325 |
| 54 | 116.24 | 114.405950458964 | 1.83404954103623 |
| 55 | 113.56 | 113.197622324816 | 0.362377675183779 |
| 56 | 106.01 | 106.551708506498 | -0.541708506498028 |
| 57 | 110.45 | 112.758695308565 | -2.30869530856487 |
| 58 | 107.77 | 108.788800687240 | -1.01880068724038 |
| 59 | 108.61 | 110.605694108753 | -1.99569410875277 |
| 60 | 108.19 | 111.958592329514 | -3.76859232951359 |
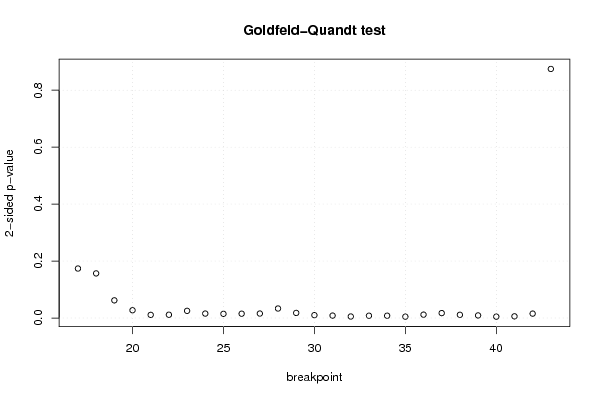
| Goldfeld-Quandt test for Heteroskedasticity | |||
| p-values | Alternative Hypothesis | ||
| breakpoint index | greater | 2-sided | less |
| 17 | 0.086903040618802 | 0.173806081237604 | 0.913096959381198 |
| 18 | 0.0783426657105238 | 0.156685331421048 | 0.921657334289476 |
| 19 | 0.0310303708243889 | 0.0620607416487778 | 0.968969629175611 |
| 20 | 0.0136483702171386 | 0.0272967404342771 | 0.986351629782861 |
| 21 | 0.00553947671003839 | 0.0110789534200768 | 0.994460523289962 |
| 22 | 0.00574633152535474 | 0.0114926630507095 | 0.994253668474645 |
| 23 | 0.0126075413582426 | 0.0252150827164852 | 0.987392458641757 |
| 24 | 0.00782769197854296 | 0.0156553839570859 | 0.992172308021457 |
| 25 | 0.00736178703763536 | 0.0147235740752707 | 0.992638212962365 |
| 26 | 0.00760122678988074 | 0.0152024535797615 | 0.99239877321012 |
| 27 | 0.00785827633650294 | 0.0157165526730059 | 0.992141723663497 |
| 28 | 0.0167105456013864 | 0.0334210912027728 | 0.983289454398614 |
| 29 | 0.0089307938498318 | 0.0178615876996636 | 0.991069206150168 |
| 30 | 0.00504986686967954 | 0.0100997337393591 | 0.99495013313032 |
| 31 | 0.00427320558636513 | 0.00854641117273026 | 0.995726794413635 |
| 32 | 0.00267230016723802 | 0.00534460033447604 | 0.997327699832762 |
| 33 | 0.00400907605311883 | 0.00801815210623766 | 0.995990923946881 |
| 34 | 0.00402263439509221 | 0.00804526879018443 | 0.995977365604908 |
| 35 | 0.00243966553671552 | 0.00487933107343105 | 0.997560334463284 |
| 36 | 0.00590304348819993 | 0.0118060869763999 | 0.9940969565118 |
| 37 | 0.00866794236242795 | 0.0173358847248559 | 0.991332057637572 |
| 38 | 0.00564658399792617 | 0.0112931679958523 | 0.994353416002074 |
| 39 | 0.00457550488940345 | 0.0091510097788069 | 0.995424495110597 |
| 40 | 0.0024101380794434 | 0.0048202761588868 | 0.997589861920557 |
| 41 | 0.00299213052534913 | 0.00598426105069827 | 0.99700786947465 |
| 42 | 0.00773885583675592 | 0.0154777116735118 | 0.992261144163244 |
| 43 | 0.437290348364574 | 0.874580696729149 | 0.562709651635426 |
| Meta Analysis of Goldfeld-Quandt test for Heteroskedasticity | |||
| Description | # significant tests | % significant tests | OK/NOK |
| 1% type I error level | 8 | 0.296296296296296 | NOK |
| 5% type I error level | 23 | 0.851851851851852 | NOK |
| 10% type I error level | 24 | 0.888888888888889 | NOK |