Free Statistics

of Irreproducible Research!

Author's title

Author*The author of this computation has been verified*
R Software Modulerwasp_multipleregression.wasp
Title produced by softwareMultiple Regression
Date of computationThu, 19 Nov 2009 10:24:44 -0700
Cite this page as followsStatistical Computations at FreeStatistics.org, Office for Research Development and Education, URL https://freestatistics.org/blog/index.php?v=date/2009/Nov/19/t1258651684dt3c3m3i032q2fh.htm/, Retrieved Fri, 19 Apr 2024 20:29:03 +0000
Statistical Computations at FreeStatistics.org, Office for Research Development and Education, URL https://freestatistics.org/blog/index.php?pk=57843, Retrieved Fri, 19 Apr 2024 20:29:03 +0000
QR Codes:

Original text written by user:
IsPrivate?No (this computation is public)
User-defined keywordsworkshop 7
Estimated Impact151
Family? (F = Feedback message, R = changed R code, M = changed R Module, P = changed Parameters, D = changed Data)
-     [Multiple Regression] [Q1 The Seatbeltlaw] [2007-11-14 19:27:43] [8cd6641b921d30ebe00b648d1481bba0]
- RMPD  [Multiple Regression] [Seatbelt] [2009-11-12 14:03:14] [b98453cac15ba1066b407e146608df68]
-    D      [Multiple Regression] [workshop 7] [2009-11-19 17:24:44] [6198946fb53eb5eb18db46bb758f7fde] [Current]
Feedback Forum

Post a new message
Dataseries X:
0.6348	1.5291
0.634	1.5358
0.62915	1.5355
0.62168	1.5287
0.61328	1.5334
0.6089	1.5225
0.60857	1.5135
0.62672	1.5144
0.62291	1.4913
0.62393	1.4793
0.61838	1.4663
0.62012	1.4749
0.61659	1.4745
0.6116	1.4775
0.61573	1.4678
0.61407	1.4658
0.62823	1.4572
0.64405	1.4721
0.6387	1.4624
0.63633	1.4636
0.63059	1.4649
0.62994	1.465
0.63709	1.4673
0.64217	1.4679
0.65711	1.4621
0.66977	1.4674
0.68255	1.4695
0.68902	1.4964
0.71322	1.5155
0.70224	1.5411
0.70045	1.5476
0.69919	1.54
0.69693	1.5474
0.69763	1.5485
0.69278	1.559
0.70196	1.5544
0.69215	1.5657
0.6769	1.5734
0.67124	1.567
0.66532	1.5547
0.67157	1.54
0.66428	1.5192
0.66576	1.527
0.66942	1.5387
0.6813	1.5431
0.69144	1.5426
0.69862	1.5216
0.695	1.5364
0.69867	1.5469
0.68968	1.5501
0.69233	1.5494
0.68293	1.5475
0.68399	1.5448
0.66895	1.5391
0.68756	1.5578
0.68527	1.5528
0.6776	1.5496
0.68137	1.549
0.67933	1.5449
0.67922	1.5479


Summary of computational transaction
Raw Inputview raw input (R code)
Raw Outputview raw output of R engine
Computing time3 seconds
R Server'Gwilym Jenkins' @ 72.249.127.135

\begin{tabular}{lllllllll}
\hline
Summary of computational transaction \tabularnewline
Raw Input & view raw input (R code)  \tabularnewline
Raw Output & view raw output of R engine  \tabularnewline
Computing time & 3 seconds \tabularnewline
R Server & 'Gwilym Jenkins' @ 72.249.127.135 \tabularnewline
\hline
\end{tabular}
%Source: https://freestatistics.org/blog/index.php?pk=57843&T=0

[TABLE]
[ROW][C]Summary of computational transaction[/C][/ROW]
[ROW][C]Raw Input[/C][C]view raw input (R code) [/C][/ROW]
[ROW][C]Raw Output[/C][C]view raw output of R engine [/C][/ROW]
[ROW][C]Computing time[/C][C]3 seconds[/C][/ROW]
[ROW][C]R Server[/C][C]'Gwilym Jenkins' @ 72.249.127.135[/C][/ROW]
[/TABLE]
Source: https://freestatistics.org/blog/index.php?pk=57843&T=0

Globally Unique Identifier (entire table): ba.freestatistics.org/blog/index.php?pk=57843&T=0

As an alternative you can also use a QR Code:  

The GUIDs for individual cells are displayed in the table below:

Summary of computational transaction
Raw Inputview raw input (R code)
Raw Outputview raw output of R engine
Computing time3 seconds
R Server'Gwilym Jenkins' @ 72.249.127.135


Multiple Linear Regression - Estimated Regression Equation
Britse_pond[t] = -0.193118251040811 + 0.567705764717280Zwitserse_frank[t] -0.00746666831058105M1[t] -0.0138813841718164M2[t] -0.0103682668776646M3[t] -0.0144070773741441M4[t] -0.0067032868376685M5[t] -0.0114292644117932M6[t] -0.0105289028988846M7[t] -0.00748715228241673M8[t] -0.00750840906356317M9[t] -0.00316126934353599M10[t] + 8.93218259334423e-05M11[t] + e[t]

\begin{tabular}{lllllllll}
\hline
Multiple Linear Regression - Estimated Regression Equation \tabularnewline
Britse_pond[t] =  -0.193118251040811 +  0.567705764717280Zwitserse_frank[t] -0.00746666831058105M1[t] -0.0138813841718164M2[t] -0.0103682668776646M3[t] -0.0144070773741441M4[t] -0.0067032868376685M5[t] -0.0114292644117932M6[t] -0.0105289028988846M7[t] -0.00748715228241673M8[t] -0.00750840906356317M9[t] -0.00316126934353599M10[t] +  8.93218259334423e-05M11[t]  + e[t] \tabularnewline
\hline
\end{tabular}
%Source: https://freestatistics.org/blog/index.php?pk=57843&T=1

[TABLE]
[ROW][C]Multiple Linear Regression - Estimated Regression Equation[/C][/ROW]
[ROW][C]Britse_pond[t] =  -0.193118251040811 +  0.567705764717280Zwitserse_frank[t] -0.00746666831058105M1[t] -0.0138813841718164M2[t] -0.0103682668776646M3[t] -0.0144070773741441M4[t] -0.0067032868376685M5[t] -0.0114292644117932M6[t] -0.0105289028988846M7[t] -0.00748715228241673M8[t] -0.00750840906356317M9[t] -0.00316126934353599M10[t] +  8.93218259334423e-05M11[t]  + e[t][/C][/ROW]
[/TABLE]
Source: https://freestatistics.org/blog/index.php?pk=57843&T=1

Globally Unique Identifier (entire table): ba.freestatistics.org/blog/index.php?pk=57843&T=1

As an alternative you can also use a QR Code:  

The GUIDs for individual cells are displayed in the table below:

Multiple Linear Regression - Estimated Regression Equation
Britse_pond[t] = -0.193118251040811 + 0.567705764717280Zwitserse_frank[t] -0.00746666831058105M1[t] -0.0138813841718164M2[t] -0.0103682668776646M3[t] -0.0144070773741441M4[t] -0.0067032868376685M5[t] -0.0114292644117932M6[t] -0.0105289028988846M7[t] -0.00748715228241673M8[t] -0.00750840906356317M9[t] -0.00316126934353599M10[t] + 8.93218259334423e-05M11[t] + e[t]


Multiple Linear Regression - Ordinary Least Squares
VariableParameterS.D.T-STATH0: parameter = 02-tail p-value1-tail p-value
(Intercept)-0.1931182510408110.147615-1.30830.1971490.098575
Zwitserse_frank0.5677057647172800.0970285.850900
M1-0.007466668310581050.017021-0.43870.662910.331455
M2-0.01388138417181640.017027-0.81530.4190290.209515
M3-0.01036826687766460.017022-0.60910.5453770.272688
M4-0.01440707737414410.017022-0.84640.4016430.200822
M5-0.00670328683766850.017022-0.39380.6955080.347754
M6-0.01142926441179320.017023-0.67140.5052450.252623
M7-0.01052890289888460.017029-0.61830.5393660.269683
M8-0.007487152282416730.01703-0.43970.6622030.331102
M9-0.007508409063563170.017023-0.44110.661190.330595
M10-0.003161269343535990.017021-0.18570.8534590.426729
M118.93218259334423e-050.0170270.00520.9958360.497918

\begin{tabular}{lllllllll}
\hline
Multiple Linear Regression - Ordinary Least Squares \tabularnewline
Variable & Parameter & S.D. & T-STATH0: parameter = 0 & 2-tail p-value & 1-tail p-value \tabularnewline
(Intercept) & -0.193118251040811 & 0.147615 & -1.3083 & 0.197149 & 0.098575 \tabularnewline
Zwitserse_frank & 0.567705764717280 & 0.097028 & 5.8509 & 0 & 0 \tabularnewline
M1 & -0.00746666831058105 & 0.017021 & -0.4387 & 0.66291 & 0.331455 \tabularnewline
M2 & -0.0138813841718164 & 0.017027 & -0.8153 & 0.419029 & 0.209515 \tabularnewline
M3 & -0.0103682668776646 & 0.017022 & -0.6091 & 0.545377 & 0.272688 \tabularnewline
M4 & -0.0144070773741441 & 0.017022 & -0.8464 & 0.401643 & 0.200822 \tabularnewline
M5 & -0.0067032868376685 & 0.017022 & -0.3938 & 0.695508 & 0.347754 \tabularnewline
M6 & -0.0114292644117932 & 0.017023 & -0.6714 & 0.505245 & 0.252623 \tabularnewline
M7 & -0.0105289028988846 & 0.017029 & -0.6183 & 0.539366 & 0.269683 \tabularnewline
M8 & -0.00748715228241673 & 0.01703 & -0.4397 & 0.662203 & 0.331102 \tabularnewline
M9 & -0.00750840906356317 & 0.017023 & -0.4411 & 0.66119 & 0.330595 \tabularnewline
M10 & -0.00316126934353599 & 0.017021 & -0.1857 & 0.853459 & 0.426729 \tabularnewline
M11 & 8.93218259334423e-05 & 0.017027 & 0.0052 & 0.995836 & 0.497918 \tabularnewline
\hline
\end{tabular}
%Source: https://freestatistics.org/blog/index.php?pk=57843&T=2

[TABLE]
[ROW][C]Multiple Linear Regression - Ordinary Least Squares[/C][/ROW]
[ROW][C]Variable[/C][C]Parameter[/C][C]S.D.[/C][C]T-STATH0: parameter = 0[/C][C]2-tail p-value[/C][C]1-tail p-value[/C][/ROW]
[ROW][C](Intercept)[/C][C]-0.193118251040811[/C][C]0.147615[/C][C]-1.3083[/C][C]0.197149[/C][C]0.098575[/C][/ROW]
[ROW][C]Zwitserse_frank[/C][C]0.567705764717280[/C][C]0.097028[/C][C]5.8509[/C][C]0[/C][C]0[/C][/ROW]
[ROW][C]M1[/C][C]-0.00746666831058105[/C][C]0.017021[/C][C]-0.4387[/C][C]0.66291[/C][C]0.331455[/C][/ROW]
[ROW][C]M2[/C][C]-0.0138813841718164[/C][C]0.017027[/C][C]-0.8153[/C][C]0.419029[/C][C]0.209515[/C][/ROW]
[ROW][C]M3[/C][C]-0.0103682668776646[/C][C]0.017022[/C][C]-0.6091[/C][C]0.545377[/C][C]0.272688[/C][/ROW]
[ROW][C]M4[/C][C]-0.0144070773741441[/C][C]0.017022[/C][C]-0.8464[/C][C]0.401643[/C][C]0.200822[/C][/ROW]
[ROW][C]M5[/C][C]-0.0067032868376685[/C][C]0.017022[/C][C]-0.3938[/C][C]0.695508[/C][C]0.347754[/C][/ROW]
[ROW][C]M6[/C][C]-0.0114292644117932[/C][C]0.017023[/C][C]-0.6714[/C][C]0.505245[/C][C]0.252623[/C][/ROW]
[ROW][C]M7[/C][C]-0.0105289028988846[/C][C]0.017029[/C][C]-0.6183[/C][C]0.539366[/C][C]0.269683[/C][/ROW]
[ROW][C]M8[/C][C]-0.00748715228241673[/C][C]0.01703[/C][C]-0.4397[/C][C]0.662203[/C][C]0.331102[/C][/ROW]
[ROW][C]M9[/C][C]-0.00750840906356317[/C][C]0.017023[/C][C]-0.4411[/C][C]0.66119[/C][C]0.330595[/C][/ROW]
[ROW][C]M10[/C][C]-0.00316126934353599[/C][C]0.017021[/C][C]-0.1857[/C][C]0.853459[/C][C]0.426729[/C][/ROW]
[ROW][C]M11[/C][C]8.93218259334423e-05[/C][C]0.017027[/C][C]0.0052[/C][C]0.995836[/C][C]0.497918[/C][/ROW]
[/TABLE]
Source: https://freestatistics.org/blog/index.php?pk=57843&T=2

Globally Unique Identifier (entire table): ba.freestatistics.org/blog/index.php?pk=57843&T=2

As an alternative you can also use a QR Code:  

The GUIDs for individual cells are displayed in the table below:

Multiple Linear Regression - Ordinary Least Squares
VariableParameterS.D.T-STATH0: parameter = 02-tail p-value1-tail p-value
(Intercept)-0.1931182510408110.147615-1.30830.1971490.098575
Zwitserse_frank0.5677057647172800.0970285.850900
M1-0.007466668310581050.017021-0.43870.662910.331455
M2-0.01388138417181640.017027-0.81530.4190290.209515
M3-0.01036826687766460.017022-0.60910.5453770.272688
M4-0.01440707737414410.017022-0.84640.4016430.200822
M5-0.00670328683766850.017022-0.39380.6955080.347754
M6-0.01142926441179320.017023-0.67140.5052450.252623
M7-0.01052890289888460.017029-0.61830.5393660.269683
M8-0.007487152282416730.01703-0.43970.6622030.331102
M9-0.007508409063563170.017023-0.44110.661190.330595
M10-0.003161269343535990.017021-0.18570.8534590.426729
M118.93218259334423e-050.0170270.00520.9958360.497918


Multiple Linear Regression - Regression Statistics
Multiple R0.655418571879294
R-squared0.429573504364294
Adjusted R-squared0.283932696967943
F-TEST (value)2.94954080551917
F-TEST (DF numerator)12
F-TEST (DF denominator)47
p-value0.00394358814395668
Multiple Linear Regression - Residual Statistics
Residual Standard Deviation0.0269125781659805
Sum Squared Residuals0.0340414825863804

\begin{tabular}{lllllllll}
\hline
Multiple Linear Regression - Regression Statistics \tabularnewline
Multiple R & 0.655418571879294 \tabularnewline
R-squared & 0.429573504364294 \tabularnewline
Adjusted R-squared & 0.283932696967943 \tabularnewline
F-TEST (value) & 2.94954080551917 \tabularnewline
F-TEST (DF numerator) & 12 \tabularnewline
F-TEST (DF denominator) & 47 \tabularnewline
p-value & 0.00394358814395668 \tabularnewline
Multiple Linear Regression - Residual Statistics \tabularnewline
Residual Standard Deviation & 0.0269125781659805 \tabularnewline
Sum Squared Residuals & 0.0340414825863804 \tabularnewline
\hline
\end{tabular}
%Source: https://freestatistics.org/blog/index.php?pk=57843&T=3

[TABLE]
[ROW][C]Multiple Linear Regression - Regression Statistics[/C][/ROW]
[ROW][C]Multiple R[/C][C]0.655418571879294[/C][/ROW]
[ROW][C]R-squared[/C][C]0.429573504364294[/C][/ROW]
[ROW][C]Adjusted R-squared[/C][C]0.283932696967943[/C][/ROW]
[ROW][C]F-TEST (value)[/C][C]2.94954080551917[/C][/ROW]
[ROW][C]F-TEST (DF numerator)[/C][C]12[/C][/ROW]
[ROW][C]F-TEST (DF denominator)[/C][C]47[/C][/ROW]
[ROW][C]p-value[/C][C]0.00394358814395668[/C][/ROW]
[ROW][C]Multiple Linear Regression - Residual Statistics[/C][/ROW]
[ROW][C]Residual Standard Deviation[/C][C]0.0269125781659805[/C][/ROW]
[ROW][C]Sum Squared Residuals[/C][C]0.0340414825863804[/C][/ROW]
[/TABLE]
Source: https://freestatistics.org/blog/index.php?pk=57843&T=3

Globally Unique Identifier (entire table): ba.freestatistics.org/blog/index.php?pk=57843&T=3

As an alternative you can also use a QR Code:  

The GUIDs for individual cells are displayed in the table below:

Multiple Linear Regression - Regression Statistics
Multiple R0.655418571879294
R-squared0.429573504364294
Adjusted R-squared0.283932696967943
F-TEST (value)2.94954080551917
F-TEST (DF numerator)12
F-TEST (DF denominator)47
p-value0.00394358814395668
Multiple Linear Regression - Residual Statistics
Residual Standard Deviation0.0269125781659805
Sum Squared Residuals0.0340414825863804


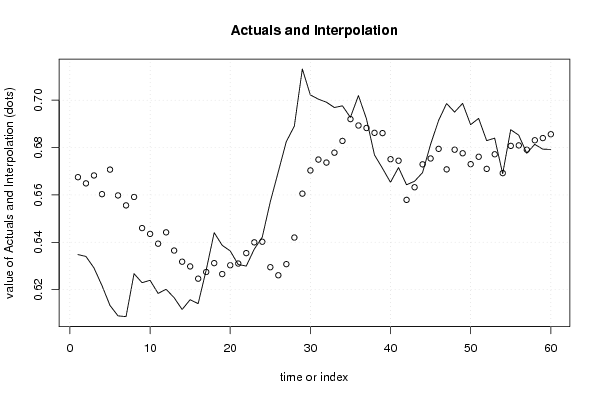
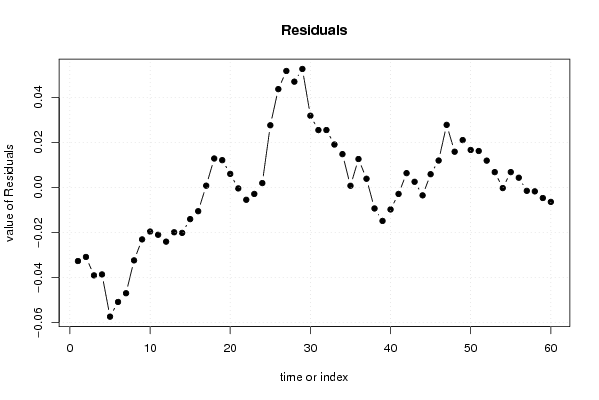
Multiple Linear Regression - Actuals, Interpolation, and Residuals
Time or IndexActualsInterpolationForecastResidualsPrediction Error
10.63480.667493965477801-0.0326939654778007
20.6340.66488287824017-0.0308828782401705
30.629150.668225683804907-0.0390756838049072
40.621680.66032647410835-0.0386464741083502
50.613280.670698481738997-0.057418481738997
60.60890.659784511329454-0.0508845113294539
70.608570.655575520959907-0.047005520959907
80.626720.65912820676462-0.0324082067646203
90.622910.645992946818505-0.0230829468185049
100.623930.643527617361925-0.0195976173619247
110.618380.63939803359007-0.0210180335900694
120.620120.644190981340705-0.0240709813407047
130.616590.636497230724237-0.0199072307242367
140.61160.631785632157153-0.0201856321571531
150.615730.629792003533547-0.0140620035335473
160.614070.624617781507633-0.0105477815076333
170.628230.627439302467540.000790697532459633
180.644050.6311721407877030.0128778592122969
190.63870.6265657563828540.0121342436171460
200.636330.6302887539169830.0060412460830173
210.630590.631005514629969-0.000415514629968741
220.629940.635409424926468-0.00546942492646756
230.637090.639965739354787-0.00287573935478673
240.642170.6402170409876840.00195295901231635
250.657110.6294576792417420.0276523207582576
260.669770.6260518039335090.0437181960664914
270.682550.6307571033335670.0517928966664333
280.689020.6419895779079820.047030422092018
290.713220.6605365485505580.0526834514494423
300.702240.6703438385531950.0318961614468047
310.700450.6749342875367660.0255157124632337
320.699190.6736614743413830.0255285256586172
330.696930.6778412402191440.0190887597808558
340.697630.682812856280360.0148171437196396
350.692780.6920243579793610.000755642020638745
360.701960.6893235896357280.0126364103642717
370.692150.6882719964664530.00387800353354748
380.67690.68622861499354-0.00932861499354018
390.671240.686108415393501-0.0148684153935014
400.665320.675086823990999-0.0097668239909994
410.671570.674445339786131-0.00287533978613102
420.664280.6579110823058870.00636891769411299
430.665760.663239548783590.00252045121640979
440.669420.67292345684725-0.00350345684725027
450.68130.675400105430860.00589989456914017
460.691440.6794633922685280.0119766077314716
470.698620.6707921623789350.027827837621065
480.6950.6791048858708170.0158951141291827
490.698670.6775991280897680.0210708719102324
500.689680.6730010706756280.0166789293243724
510.692330.6761167939344770.0162132060655226
520.682930.6709993424850350.0119306575149649
530.683990.6771703274567740.00681967254322608
540.668950.66920842702376-0.000258427023760691
550.687560.6807248863368830.00683511366311744
560.685270.6809281081297640.00434189187023613
570.67760.679090192901522-0.00149019290152228
580.681370.683096709162719-0.00172670916271895
590.679330.684019706696848-0.00468970669684757
600.679220.685633502165066-0.00641350216506599

\begin{tabular}{lllllllll}
\hline
Multiple Linear Regression - Actuals, Interpolation, and Residuals \tabularnewline
Time or Index & Actuals & InterpolationForecast & ResidualsPrediction Error \tabularnewline
1 & 0.6348 & 0.667493965477801 & -0.0326939654778007 \tabularnewline
2 & 0.634 & 0.66488287824017 & -0.0308828782401705 \tabularnewline
3 & 0.62915 & 0.668225683804907 & -0.0390756838049072 \tabularnewline
4 & 0.62168 & 0.66032647410835 & -0.0386464741083502 \tabularnewline
5 & 0.61328 & 0.670698481738997 & -0.057418481738997 \tabularnewline
6 & 0.6089 & 0.659784511329454 & -0.0508845113294539 \tabularnewline
7 & 0.60857 & 0.655575520959907 & -0.047005520959907 \tabularnewline
8 & 0.62672 & 0.65912820676462 & -0.0324082067646203 \tabularnewline
9 & 0.62291 & 0.645992946818505 & -0.0230829468185049 \tabularnewline
10 & 0.62393 & 0.643527617361925 & -0.0195976173619247 \tabularnewline
11 & 0.61838 & 0.63939803359007 & -0.0210180335900694 \tabularnewline
12 & 0.62012 & 0.644190981340705 & -0.0240709813407047 \tabularnewline
13 & 0.61659 & 0.636497230724237 & -0.0199072307242367 \tabularnewline
14 & 0.6116 & 0.631785632157153 & -0.0201856321571531 \tabularnewline
15 & 0.61573 & 0.629792003533547 & -0.0140620035335473 \tabularnewline
16 & 0.61407 & 0.624617781507633 & -0.0105477815076333 \tabularnewline
17 & 0.62823 & 0.62743930246754 & 0.000790697532459633 \tabularnewline
18 & 0.64405 & 0.631172140787703 & 0.0128778592122969 \tabularnewline
19 & 0.6387 & 0.626565756382854 & 0.0121342436171460 \tabularnewline
20 & 0.63633 & 0.630288753916983 & 0.0060412460830173 \tabularnewline
21 & 0.63059 & 0.631005514629969 & -0.000415514629968741 \tabularnewline
22 & 0.62994 & 0.635409424926468 & -0.00546942492646756 \tabularnewline
23 & 0.63709 & 0.639965739354787 & -0.00287573935478673 \tabularnewline
24 & 0.64217 & 0.640217040987684 & 0.00195295901231635 \tabularnewline
25 & 0.65711 & 0.629457679241742 & 0.0276523207582576 \tabularnewline
26 & 0.66977 & 0.626051803933509 & 0.0437181960664914 \tabularnewline
27 & 0.68255 & 0.630757103333567 & 0.0517928966664333 \tabularnewline
28 & 0.68902 & 0.641989577907982 & 0.047030422092018 \tabularnewline
29 & 0.71322 & 0.660536548550558 & 0.0526834514494423 \tabularnewline
30 & 0.70224 & 0.670343838553195 & 0.0318961614468047 \tabularnewline
31 & 0.70045 & 0.674934287536766 & 0.0255157124632337 \tabularnewline
32 & 0.69919 & 0.673661474341383 & 0.0255285256586172 \tabularnewline
33 & 0.69693 & 0.677841240219144 & 0.0190887597808558 \tabularnewline
34 & 0.69763 & 0.68281285628036 & 0.0148171437196396 \tabularnewline
35 & 0.69278 & 0.692024357979361 & 0.000755642020638745 \tabularnewline
36 & 0.70196 & 0.689323589635728 & 0.0126364103642717 \tabularnewline
37 & 0.69215 & 0.688271996466453 & 0.00387800353354748 \tabularnewline
38 & 0.6769 & 0.68622861499354 & -0.00932861499354018 \tabularnewline
39 & 0.67124 & 0.686108415393501 & -0.0148684153935014 \tabularnewline
40 & 0.66532 & 0.675086823990999 & -0.0097668239909994 \tabularnewline
41 & 0.67157 & 0.674445339786131 & -0.00287533978613102 \tabularnewline
42 & 0.66428 & 0.657911082305887 & 0.00636891769411299 \tabularnewline
43 & 0.66576 & 0.66323954878359 & 0.00252045121640979 \tabularnewline
44 & 0.66942 & 0.67292345684725 & -0.00350345684725027 \tabularnewline
45 & 0.6813 & 0.67540010543086 & 0.00589989456914017 \tabularnewline
46 & 0.69144 & 0.679463392268528 & 0.0119766077314716 \tabularnewline
47 & 0.69862 & 0.670792162378935 & 0.027827837621065 \tabularnewline
48 & 0.695 & 0.679104885870817 & 0.0158951141291827 \tabularnewline
49 & 0.69867 & 0.677599128089768 & 0.0210708719102324 \tabularnewline
50 & 0.68968 & 0.673001070675628 & 0.0166789293243724 \tabularnewline
51 & 0.69233 & 0.676116793934477 & 0.0162132060655226 \tabularnewline
52 & 0.68293 & 0.670999342485035 & 0.0119306575149649 \tabularnewline
53 & 0.68399 & 0.677170327456774 & 0.00681967254322608 \tabularnewline
54 & 0.66895 & 0.66920842702376 & -0.000258427023760691 \tabularnewline
55 & 0.68756 & 0.680724886336883 & 0.00683511366311744 \tabularnewline
56 & 0.68527 & 0.680928108129764 & 0.00434189187023613 \tabularnewline
57 & 0.6776 & 0.679090192901522 & -0.00149019290152228 \tabularnewline
58 & 0.68137 & 0.683096709162719 & -0.00172670916271895 \tabularnewline
59 & 0.67933 & 0.684019706696848 & -0.00468970669684757 \tabularnewline
60 & 0.67922 & 0.685633502165066 & -0.00641350216506599 \tabularnewline
\hline
\end{tabular}
%Source: https://freestatistics.org/blog/index.php?pk=57843&T=4

[TABLE]
[ROW][C]Multiple Linear Regression - Actuals, Interpolation, and Residuals[/C][/ROW]
[ROW][C]Time or Index[/C][C]Actuals[/C][C]InterpolationForecast[/C][C]ResidualsPrediction Error[/C][/ROW]
[ROW][C]1[/C][C]0.6348[/C][C]0.667493965477801[/C][C]-0.0326939654778007[/C][/ROW]
[ROW][C]2[/C][C]0.634[/C][C]0.66488287824017[/C][C]-0.0308828782401705[/C][/ROW]
[ROW][C]3[/C][C]0.62915[/C][C]0.668225683804907[/C][C]-0.0390756838049072[/C][/ROW]
[ROW][C]4[/C][C]0.62168[/C][C]0.66032647410835[/C][C]-0.0386464741083502[/C][/ROW]
[ROW][C]5[/C][C]0.61328[/C][C]0.670698481738997[/C][C]-0.057418481738997[/C][/ROW]
[ROW][C]6[/C][C]0.6089[/C][C]0.659784511329454[/C][C]-0.0508845113294539[/C][/ROW]
[ROW][C]7[/C][C]0.60857[/C][C]0.655575520959907[/C][C]-0.047005520959907[/C][/ROW]
[ROW][C]8[/C][C]0.62672[/C][C]0.65912820676462[/C][C]-0.0324082067646203[/C][/ROW]
[ROW][C]9[/C][C]0.62291[/C][C]0.645992946818505[/C][C]-0.0230829468185049[/C][/ROW]
[ROW][C]10[/C][C]0.62393[/C][C]0.643527617361925[/C][C]-0.0195976173619247[/C][/ROW]
[ROW][C]11[/C][C]0.61838[/C][C]0.63939803359007[/C][C]-0.0210180335900694[/C][/ROW]
[ROW][C]12[/C][C]0.62012[/C][C]0.644190981340705[/C][C]-0.0240709813407047[/C][/ROW]
[ROW][C]13[/C][C]0.61659[/C][C]0.636497230724237[/C][C]-0.0199072307242367[/C][/ROW]
[ROW][C]14[/C][C]0.6116[/C][C]0.631785632157153[/C][C]-0.0201856321571531[/C][/ROW]
[ROW][C]15[/C][C]0.61573[/C][C]0.629792003533547[/C][C]-0.0140620035335473[/C][/ROW]
[ROW][C]16[/C][C]0.61407[/C][C]0.624617781507633[/C][C]-0.0105477815076333[/C][/ROW]
[ROW][C]17[/C][C]0.62823[/C][C]0.62743930246754[/C][C]0.000790697532459633[/C][/ROW]
[ROW][C]18[/C][C]0.64405[/C][C]0.631172140787703[/C][C]0.0128778592122969[/C][/ROW]
[ROW][C]19[/C][C]0.6387[/C][C]0.626565756382854[/C][C]0.0121342436171460[/C][/ROW]
[ROW][C]20[/C][C]0.63633[/C][C]0.630288753916983[/C][C]0.0060412460830173[/C][/ROW]
[ROW][C]21[/C][C]0.63059[/C][C]0.631005514629969[/C][C]-0.000415514629968741[/C][/ROW]
[ROW][C]22[/C][C]0.62994[/C][C]0.635409424926468[/C][C]-0.00546942492646756[/C][/ROW]
[ROW][C]23[/C][C]0.63709[/C][C]0.639965739354787[/C][C]-0.00287573935478673[/C][/ROW]
[ROW][C]24[/C][C]0.64217[/C][C]0.640217040987684[/C][C]0.00195295901231635[/C][/ROW]
[ROW][C]25[/C][C]0.65711[/C][C]0.629457679241742[/C][C]0.0276523207582576[/C][/ROW]
[ROW][C]26[/C][C]0.66977[/C][C]0.626051803933509[/C][C]0.0437181960664914[/C][/ROW]
[ROW][C]27[/C][C]0.68255[/C][C]0.630757103333567[/C][C]0.0517928966664333[/C][/ROW]
[ROW][C]28[/C][C]0.68902[/C][C]0.641989577907982[/C][C]0.047030422092018[/C][/ROW]
[ROW][C]29[/C][C]0.71322[/C][C]0.660536548550558[/C][C]0.0526834514494423[/C][/ROW]
[ROW][C]30[/C][C]0.70224[/C][C]0.670343838553195[/C][C]0.0318961614468047[/C][/ROW]
[ROW][C]31[/C][C]0.70045[/C][C]0.674934287536766[/C][C]0.0255157124632337[/C][/ROW]
[ROW][C]32[/C][C]0.69919[/C][C]0.673661474341383[/C][C]0.0255285256586172[/C][/ROW]
[ROW][C]33[/C][C]0.69693[/C][C]0.677841240219144[/C][C]0.0190887597808558[/C][/ROW]
[ROW][C]34[/C][C]0.69763[/C][C]0.68281285628036[/C][C]0.0148171437196396[/C][/ROW]
[ROW][C]35[/C][C]0.69278[/C][C]0.692024357979361[/C][C]0.000755642020638745[/C][/ROW]
[ROW][C]36[/C][C]0.70196[/C][C]0.689323589635728[/C][C]0.0126364103642717[/C][/ROW]
[ROW][C]37[/C][C]0.69215[/C][C]0.688271996466453[/C][C]0.00387800353354748[/C][/ROW]
[ROW][C]38[/C][C]0.6769[/C][C]0.68622861499354[/C][C]-0.00932861499354018[/C][/ROW]
[ROW][C]39[/C][C]0.67124[/C][C]0.686108415393501[/C][C]-0.0148684153935014[/C][/ROW]
[ROW][C]40[/C][C]0.66532[/C][C]0.675086823990999[/C][C]-0.0097668239909994[/C][/ROW]
[ROW][C]41[/C][C]0.67157[/C][C]0.674445339786131[/C][C]-0.00287533978613102[/C][/ROW]
[ROW][C]42[/C][C]0.66428[/C][C]0.657911082305887[/C][C]0.00636891769411299[/C][/ROW]
[ROW][C]43[/C][C]0.66576[/C][C]0.66323954878359[/C][C]0.00252045121640979[/C][/ROW]
[ROW][C]44[/C][C]0.66942[/C][C]0.67292345684725[/C][C]-0.00350345684725027[/C][/ROW]
[ROW][C]45[/C][C]0.6813[/C][C]0.67540010543086[/C][C]0.00589989456914017[/C][/ROW]
[ROW][C]46[/C][C]0.69144[/C][C]0.679463392268528[/C][C]0.0119766077314716[/C][/ROW]
[ROW][C]47[/C][C]0.69862[/C][C]0.670792162378935[/C][C]0.027827837621065[/C][/ROW]
[ROW][C]48[/C][C]0.695[/C][C]0.679104885870817[/C][C]0.0158951141291827[/C][/ROW]
[ROW][C]49[/C][C]0.69867[/C][C]0.677599128089768[/C][C]0.0210708719102324[/C][/ROW]
[ROW][C]50[/C][C]0.68968[/C][C]0.673001070675628[/C][C]0.0166789293243724[/C][/ROW]
[ROW][C]51[/C][C]0.69233[/C][C]0.676116793934477[/C][C]0.0162132060655226[/C][/ROW]
[ROW][C]52[/C][C]0.68293[/C][C]0.670999342485035[/C][C]0.0119306575149649[/C][/ROW]
[ROW][C]53[/C][C]0.68399[/C][C]0.677170327456774[/C][C]0.00681967254322608[/C][/ROW]
[ROW][C]54[/C][C]0.66895[/C][C]0.66920842702376[/C][C]-0.000258427023760691[/C][/ROW]
[ROW][C]55[/C][C]0.68756[/C][C]0.680724886336883[/C][C]0.00683511366311744[/C][/ROW]
[ROW][C]56[/C][C]0.68527[/C][C]0.680928108129764[/C][C]0.00434189187023613[/C][/ROW]
[ROW][C]57[/C][C]0.6776[/C][C]0.679090192901522[/C][C]-0.00149019290152228[/C][/ROW]
[ROW][C]58[/C][C]0.68137[/C][C]0.683096709162719[/C][C]-0.00172670916271895[/C][/ROW]
[ROW][C]59[/C][C]0.67933[/C][C]0.684019706696848[/C][C]-0.00468970669684757[/C][/ROW]
[ROW][C]60[/C][C]0.67922[/C][C]0.685633502165066[/C][C]-0.00641350216506599[/C][/ROW]
[/TABLE]
Source: https://freestatistics.org/blog/index.php?pk=57843&T=4

Globally Unique Identifier (entire table): ba.freestatistics.org/blog/index.php?pk=57843&T=4

As an alternative you can also use a QR Code:  

The GUIDs for individual cells are displayed in the table below:

Multiple Linear Regression - Actuals, Interpolation, and Residuals
Time or IndexActualsInterpolationForecastResidualsPrediction Error
10.63480.667493965477801-0.0326939654778007
20.6340.66488287824017-0.0308828782401705
30.629150.668225683804907-0.0390756838049072
40.621680.66032647410835-0.0386464741083502
50.613280.670698481738997-0.057418481738997
60.60890.659784511329454-0.0508845113294539
70.608570.655575520959907-0.047005520959907
80.626720.65912820676462-0.0324082067646203
90.622910.645992946818505-0.0230829468185049
100.623930.643527617361925-0.0195976173619247
110.618380.63939803359007-0.0210180335900694
120.620120.644190981340705-0.0240709813407047
130.616590.636497230724237-0.0199072307242367
140.61160.631785632157153-0.0201856321571531
150.615730.629792003533547-0.0140620035335473
160.614070.624617781507633-0.0105477815076333
170.628230.627439302467540.000790697532459633
180.644050.6311721407877030.0128778592122969
190.63870.6265657563828540.0121342436171460
200.636330.6302887539169830.0060412460830173
210.630590.631005514629969-0.000415514629968741
220.629940.635409424926468-0.00546942492646756
230.637090.639965739354787-0.00287573935478673
240.642170.6402170409876840.00195295901231635
250.657110.6294576792417420.0276523207582576
260.669770.6260518039335090.0437181960664914
270.682550.6307571033335670.0517928966664333
280.689020.6419895779079820.047030422092018
290.713220.6605365485505580.0526834514494423
300.702240.6703438385531950.0318961614468047
310.700450.6749342875367660.0255157124632337
320.699190.6736614743413830.0255285256586172
330.696930.6778412402191440.0190887597808558
340.697630.682812856280360.0148171437196396
350.692780.6920243579793610.000755642020638745
360.701960.6893235896357280.0126364103642717
370.692150.6882719964664530.00387800353354748
380.67690.68622861499354-0.00932861499354018
390.671240.686108415393501-0.0148684153935014
400.665320.675086823990999-0.0097668239909994
410.671570.674445339786131-0.00287533978613102
420.664280.6579110823058870.00636891769411299
430.665760.663239548783590.00252045121640979
440.669420.67292345684725-0.00350345684725027
450.68130.675400105430860.00589989456914017
460.691440.6794633922685280.0119766077314716
470.698620.6707921623789350.027827837621065
480.6950.6791048858708170.0158951141291827
490.698670.6775991280897680.0210708719102324
500.689680.6730010706756280.0166789293243724
510.692330.6761167939344770.0162132060655226
520.682930.6709993424850350.0119306575149649
530.683990.6771703274567740.00681967254322608
540.668950.66920842702376-0.000258427023760691
550.687560.6807248863368830.00683511366311744
560.685270.6809281081297640.00434189187023613
570.67760.679090192901522-0.00149019290152228
580.681370.683096709162719-0.00172670916271895
590.679330.684019706696848-0.00468970669684757
600.679220.685633502165066-0.00641350216506599


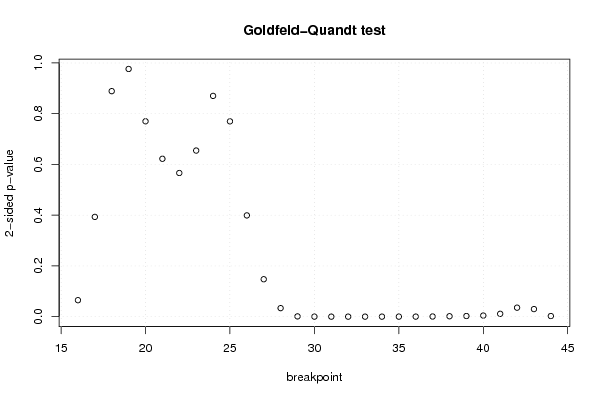
Goldfeld-Quandt test for Heteroskedasticity
p-valuesAlternative Hypothesis
breakpoint indexgreater2-sidedless
160.0324948198935310.0649896397870620.96750518010647
170.1965759211167650.3931518422335310.803424078883235
180.4444097516914550.888819503382910.555590248308545
190.4881595616097350.976319123219470.511840438390265
200.3849868036450120.7699736072900250.615013196354988
210.3111454202742730.6222908405485460.688854579725727
220.283130734800140.566261469600280.71686926519986
230.3273349418873110.6546698837746220.672665058112689
240.4350304420320270.8700608840640550.564969557967973
250.6150771885040030.7698456229919940.384922811495997
260.8004610394667280.3990779210665430.199538960533272
270.926257873120360.1474842537592790.0737421268796395
280.9831954003479460.03360919930410820.0168045996520541
290.999450364735390.001099270529218800.000549635264609399
300.999957868648138.4262703740447e-054.21313518702235e-05
310.999987173824572.56523508595981e-051.28261754297990e-05
320.9999920800331461.58399337078415e-057.91996685392075e-06
330.99999151072461.69785508000576e-058.48927540002881e-06
340.9999828945779923.42108440168021e-051.71054220084011e-05
350.9999471995259870.0001056009480254165.28004740127081e-05
360.999915052729510.0001698945409815698.49472704907845e-05
370.9997161230503860.0005677538992275380.000283876949613769
380.9992021576282460.001595684743508420.00079784237175421
390.9987987195856860.002402560828627840.00120128041431392
400.9978485144875940.004302971024811910.00215148551240596
410.9943874026973050.01122519460539030.00561259730269516
420.9822873881230750.03542522375385010.0177126118769250
430.9850556155421790.02988876891564260.0149443844578213
440.9987897333224620.002420533355076190.00121026667753809

\begin{tabular}{lllllllll}
\hline
Goldfeld-Quandt test for Heteroskedasticity \tabularnewline
p-values & Alternative Hypothesis \tabularnewline
breakpoint index & greater & 2-sided & less \tabularnewline
16 & 0.032494819893531 & 0.064989639787062 & 0.96750518010647 \tabularnewline
17 & 0.196575921116765 & 0.393151842233531 & 0.803424078883235 \tabularnewline
18 & 0.444409751691455 & 0.88881950338291 & 0.555590248308545 \tabularnewline
19 & 0.488159561609735 & 0.97631912321947 & 0.511840438390265 \tabularnewline
20 & 0.384986803645012 & 0.769973607290025 & 0.615013196354988 \tabularnewline
21 & 0.311145420274273 & 0.622290840548546 & 0.688854579725727 \tabularnewline
22 & 0.28313073480014 & 0.56626146960028 & 0.71686926519986 \tabularnewline
23 & 0.327334941887311 & 0.654669883774622 & 0.672665058112689 \tabularnewline
24 & 0.435030442032027 & 0.870060884064055 & 0.564969557967973 \tabularnewline
25 & 0.615077188504003 & 0.769845622991994 & 0.384922811495997 \tabularnewline
26 & 0.800461039466728 & 0.399077921066543 & 0.199538960533272 \tabularnewline
27 & 0.92625787312036 & 0.147484253759279 & 0.0737421268796395 \tabularnewline
28 & 0.983195400347946 & 0.0336091993041082 & 0.0168045996520541 \tabularnewline
29 & 0.99945036473539 & 0.00109927052921880 & 0.000549635264609399 \tabularnewline
30 & 0.99995786864813 & 8.4262703740447e-05 & 4.21313518702235e-05 \tabularnewline
31 & 0.99998717382457 & 2.56523508595981e-05 & 1.28261754297990e-05 \tabularnewline
32 & 0.999992080033146 & 1.58399337078415e-05 & 7.91996685392075e-06 \tabularnewline
33 & 0.9999915107246 & 1.69785508000576e-05 & 8.48927540002881e-06 \tabularnewline
34 & 0.999982894577992 & 3.42108440168021e-05 & 1.71054220084011e-05 \tabularnewline
35 & 0.999947199525987 & 0.000105600948025416 & 5.28004740127081e-05 \tabularnewline
36 & 0.99991505272951 & 0.000169894540981569 & 8.49472704907845e-05 \tabularnewline
37 & 0.999716123050386 & 0.000567753899227538 & 0.000283876949613769 \tabularnewline
38 & 0.999202157628246 & 0.00159568474350842 & 0.00079784237175421 \tabularnewline
39 & 0.998798719585686 & 0.00240256082862784 & 0.00120128041431392 \tabularnewline
40 & 0.997848514487594 & 0.00430297102481191 & 0.00215148551240596 \tabularnewline
41 & 0.994387402697305 & 0.0112251946053903 & 0.00561259730269516 \tabularnewline
42 & 0.982287388123075 & 0.0354252237538501 & 0.0177126118769250 \tabularnewline
43 & 0.985055615542179 & 0.0298887689156426 & 0.0149443844578213 \tabularnewline
44 & 0.998789733322462 & 0.00242053335507619 & 0.00121026667753809 \tabularnewline
\hline
\end{tabular}
%Source: https://freestatistics.org/blog/index.php?pk=57843&T=5

[TABLE]
[ROW][C]Goldfeld-Quandt test for Heteroskedasticity[/C][/ROW]
[ROW][C]p-values[/C][C]Alternative Hypothesis[/C][/ROW]
[ROW][C]breakpoint index[/C][C]greater[/C][C]2-sided[/C][C]less[/C][/ROW]
[ROW][C]16[/C][C]0.032494819893531[/C][C]0.064989639787062[/C][C]0.96750518010647[/C][/ROW]
[ROW][C]17[/C][C]0.196575921116765[/C][C]0.393151842233531[/C][C]0.803424078883235[/C][/ROW]
[ROW][C]18[/C][C]0.444409751691455[/C][C]0.88881950338291[/C][C]0.555590248308545[/C][/ROW]
[ROW][C]19[/C][C]0.488159561609735[/C][C]0.97631912321947[/C][C]0.511840438390265[/C][/ROW]
[ROW][C]20[/C][C]0.384986803645012[/C][C]0.769973607290025[/C][C]0.615013196354988[/C][/ROW]
[ROW][C]21[/C][C]0.311145420274273[/C][C]0.622290840548546[/C][C]0.688854579725727[/C][/ROW]
[ROW][C]22[/C][C]0.28313073480014[/C][C]0.56626146960028[/C][C]0.71686926519986[/C][/ROW]
[ROW][C]23[/C][C]0.327334941887311[/C][C]0.654669883774622[/C][C]0.672665058112689[/C][/ROW]
[ROW][C]24[/C][C]0.435030442032027[/C][C]0.870060884064055[/C][C]0.564969557967973[/C][/ROW]
[ROW][C]25[/C][C]0.615077188504003[/C][C]0.769845622991994[/C][C]0.384922811495997[/C][/ROW]
[ROW][C]26[/C][C]0.800461039466728[/C][C]0.399077921066543[/C][C]0.199538960533272[/C][/ROW]
[ROW][C]27[/C][C]0.92625787312036[/C][C]0.147484253759279[/C][C]0.0737421268796395[/C][/ROW]
[ROW][C]28[/C][C]0.983195400347946[/C][C]0.0336091993041082[/C][C]0.0168045996520541[/C][/ROW]
[ROW][C]29[/C][C]0.99945036473539[/C][C]0.00109927052921880[/C][C]0.000549635264609399[/C][/ROW]
[ROW][C]30[/C][C]0.99995786864813[/C][C]8.4262703740447e-05[/C][C]4.21313518702235e-05[/C][/ROW]
[ROW][C]31[/C][C]0.99998717382457[/C][C]2.56523508595981e-05[/C][C]1.28261754297990e-05[/C][/ROW]
[ROW][C]32[/C][C]0.999992080033146[/C][C]1.58399337078415e-05[/C][C]7.91996685392075e-06[/C][/ROW]
[ROW][C]33[/C][C]0.9999915107246[/C][C]1.69785508000576e-05[/C][C]8.48927540002881e-06[/C][/ROW]
[ROW][C]34[/C][C]0.999982894577992[/C][C]3.42108440168021e-05[/C][C]1.71054220084011e-05[/C][/ROW]
[ROW][C]35[/C][C]0.999947199525987[/C][C]0.000105600948025416[/C][C]5.28004740127081e-05[/C][/ROW]
[ROW][C]36[/C][C]0.99991505272951[/C][C]0.000169894540981569[/C][C]8.49472704907845e-05[/C][/ROW]
[ROW][C]37[/C][C]0.999716123050386[/C][C]0.000567753899227538[/C][C]0.000283876949613769[/C][/ROW]
[ROW][C]38[/C][C]0.999202157628246[/C][C]0.00159568474350842[/C][C]0.00079784237175421[/C][/ROW]
[ROW][C]39[/C][C]0.998798719585686[/C][C]0.00240256082862784[/C][C]0.00120128041431392[/C][/ROW]
[ROW][C]40[/C][C]0.997848514487594[/C][C]0.00430297102481191[/C][C]0.00215148551240596[/C][/ROW]
[ROW][C]41[/C][C]0.994387402697305[/C][C]0.0112251946053903[/C][C]0.00561259730269516[/C][/ROW]
[ROW][C]42[/C][C]0.982287388123075[/C][C]0.0354252237538501[/C][C]0.0177126118769250[/C][/ROW]
[ROW][C]43[/C][C]0.985055615542179[/C][C]0.0298887689156426[/C][C]0.0149443844578213[/C][/ROW]
[ROW][C]44[/C][C]0.998789733322462[/C][C]0.00242053335507619[/C][C]0.00121026667753809[/C][/ROW]
[/TABLE]
Source: https://freestatistics.org/blog/index.php?pk=57843&T=5

Globally Unique Identifier (entire table): ba.freestatistics.org/blog/index.php?pk=57843&T=5

As an alternative you can also use a QR Code:  

The GUIDs for individual cells are displayed in the table below:

Goldfeld-Quandt test for Heteroskedasticity
p-valuesAlternative Hypothesis
breakpoint indexgreater2-sidedless
160.0324948198935310.0649896397870620.96750518010647
170.1965759211167650.3931518422335310.803424078883235
180.4444097516914550.888819503382910.555590248308545
190.4881595616097350.976319123219470.511840438390265
200.3849868036450120.7699736072900250.615013196354988
210.3111454202742730.6222908405485460.688854579725727
220.283130734800140.566261469600280.71686926519986
230.3273349418873110.6546698837746220.672665058112689
240.4350304420320270.8700608840640550.564969557967973
250.6150771885040030.7698456229919940.384922811495997
260.8004610394667280.3990779210665430.199538960533272
270.926257873120360.1474842537592790.0737421268796395
280.9831954003479460.03360919930410820.0168045996520541
290.999450364735390.001099270529218800.000549635264609399
300.999957868648138.4262703740447e-054.21313518702235e-05
310.999987173824572.56523508595981e-051.28261754297990e-05
320.9999920800331461.58399337078415e-057.91996685392075e-06
330.99999151072461.69785508000576e-058.48927540002881e-06
340.9999828945779923.42108440168021e-051.71054220084011e-05
350.9999471995259870.0001056009480254165.28004740127081e-05
360.999915052729510.0001698945409815698.49472704907845e-05
370.9997161230503860.0005677538992275380.000283876949613769
380.9992021576282460.001595684743508420.00079784237175421
390.9987987195856860.002402560828627840.00120128041431392
400.9978485144875940.004302971024811910.00215148551240596
410.9943874026973050.01122519460539030.00561259730269516
420.9822873881230750.03542522375385010.0177126118769250
430.9850556155421790.02988876891564260.0149443844578213
440.9987897333224620.002420533355076190.00121026667753809


Meta Analysis of Goldfeld-Quandt test for Heteroskedasticity
Description# significant tests% significant testsOK/NOK
1% type I error level130.448275862068966NOK
5% type I error level170.586206896551724NOK
10% type I error level180.620689655172414NOK

\begin{tabular}{lllllllll}
\hline
Meta Analysis of Goldfeld-Quandt test for Heteroskedasticity \tabularnewline
Description & # significant tests & % significant tests & OK/NOK \tabularnewline
1% type I error level & 13 & 0.448275862068966 & NOK \tabularnewline
5% type I error level & 17 & 0.586206896551724 & NOK \tabularnewline
10% type I error level & 18 & 0.620689655172414 & NOK \tabularnewline
\hline
\end{tabular}
%Source: https://freestatistics.org/blog/index.php?pk=57843&T=6

[TABLE]
[ROW][C]Meta Analysis of Goldfeld-Quandt test for Heteroskedasticity[/C][/ROW]
[ROW][C]Description[/C][C]# significant tests[/C][C]% significant tests[/C][C]OK/NOK[/C][/ROW]
[ROW][C]1% type I error level[/C][C]13[/C][C]0.448275862068966[/C][C]NOK[/C][/ROW]
[ROW][C]5% type I error level[/C][C]17[/C][C]0.586206896551724[/C][C]NOK[/C][/ROW]
[ROW][C]10% type I error level[/C][C]18[/C][C]0.620689655172414[/C][C]NOK[/C][/ROW]
[/TABLE]
Source: https://freestatistics.org/blog/index.php?pk=57843&T=6

Globally Unique Identifier (entire table): ba.freestatistics.org/blog/index.php?pk=57843&T=6

As an alternative you can also use a QR Code:  

The GUIDs for individual cells are displayed in the table below:

Meta Analysis of Goldfeld-Quandt test for Heteroskedasticity
Description# significant tests% significant testsOK/NOK
1% type I error level130.448275862068966NOK
5% type I error level170.586206896551724NOK
10% type I error level180.620689655172414NOK


Parameters (Session):
par1 = 1 ; par2 = Include Monthly Dummies ; par3 = No Linear Trend ;
Parameters (R input):
par1 = 1 ; par2 = Include Monthly Dummies ; par3 = No Linear Trend ;
R code (references can be found in the software module):
library(lattice)
library(lmtest)
n25 <- 25 #minimum number of obs. for Goldfeld-Quandt test
par1 <- as.numeric(par1)
x <- t(y)
k <- length(x[1,])
n <- length(x[,1])
x1 <- cbind(x[,par1], x[,1:k!=par1])
mycolnames <- c(colnames(x)[par1], colnames(x)[1:k!=par1])
colnames(x1) <- mycolnames #colnames(x)[par1]
x <- x1
if (par3 == 'First Differences'){
x2 <- array(0, dim=c(n-1,k), dimnames=list(1:(n-1), paste('(1-B)',colnames(x),sep='')))
for (i in 1:n-1) {
for (j in 1:k) {
x2[i,j] <- x[i+1,j] - x[i,j]
}
}
x <- x2
}
if (par2 == 'Include Monthly Dummies'){
x2 <- array(0, dim=c(n,11), dimnames=list(1:n, paste('M', seq(1:11), sep ='')))
for (i in 1:11){
x2[seq(i,n,12),i] <- 1
}
x <- cbind(x, x2)
}
if (par2 == 'Include Quarterly Dummies'){
x2 <- array(0, dim=c(n,3), dimnames=list(1:n, paste('Q', seq(1:3), sep ='')))
for (i in 1:3){
x2[seq(i,n,4),i] <- 1
}
x <- cbind(x, x2)
}
k <- length(x[1,])
if (par3 == 'Linear Trend'){
x <- cbind(x, c(1:n))
colnames(x)[k+1] <- 't'
}
x
k <- length(x[1,])
df <- as.data.frame(x)
(mylm <- lm(df))
(mysum <- summary(mylm))
if (n > n25) {
kp3 <- k + 3
nmkm3 <- n - k - 3
gqarr <- array(NA, dim=c(nmkm3-kp3+1,3))
numgqtests <- 0
numsignificant1 <- 0
numsignificant5 <- 0
numsignificant10 <- 0
for (mypoint in kp3:nmkm3) {
j <- 0
numgqtests <- numgqtests + 1
for (myalt in c('greater', 'two.sided', 'less')) {
j <- j + 1
gqarr[mypoint-kp3+1,j] <- gqtest(mylm, point=mypoint, alternative=myalt)$p.value
}
if (gqarr[mypoint-kp3+1,2] < 0.01) numsignificant1 <- numsignificant1 + 1
if (gqarr[mypoint-kp3+1,2] < 0.05) numsignificant5 <- numsignificant5 + 1
if (gqarr[mypoint-kp3+1,2] < 0.10) numsignificant10 <- numsignificant10 + 1
}
gqarr
}
bitmap(file='test0.png')
plot(x[,1], type='l', main='Actuals and Interpolation', ylab='value of Actuals and Interpolation (dots)', xlab='time or index')
points(x[,1]-mysum$resid)
grid()
dev.off()
bitmap(file='test1.png')
plot(mysum$resid, type='b', pch=19, main='Residuals', ylab='value of Residuals', xlab='time or index')
grid()
dev.off()
bitmap(file='test2.png')
hist(mysum$resid, main='Residual Histogram', xlab='values of Residuals')
grid()
dev.off()
bitmap(file='test3.png')
densityplot(~mysum$resid,col='black',main='Residual Density Plot', xlab='values of Residuals')
dev.off()
bitmap(file='test4.png')
qqnorm(mysum$resid, main='Residual Normal Q-Q Plot')
qqline(mysum$resid)
grid()
dev.off()
(myerror <- as.ts(mysum$resid))
bitmap(file='test5.png')
dum <- cbind(lag(myerror,k=1),myerror)
dum
dum1 <- dum[2:length(myerror),]
dum1
z <- as.data.frame(dum1)
z
plot(z,main=paste('Residual Lag plot, lowess, and regression line'), ylab='values of Residuals', xlab='lagged values of Residuals')
lines(lowess(z))
abline(lm(z))
grid()
dev.off()
bitmap(file='test6.png')
acf(mysum$resid, lag.max=length(mysum$resid)/2, main='Residual Autocorrelation Function')
grid()
dev.off()
bitmap(file='test7.png')
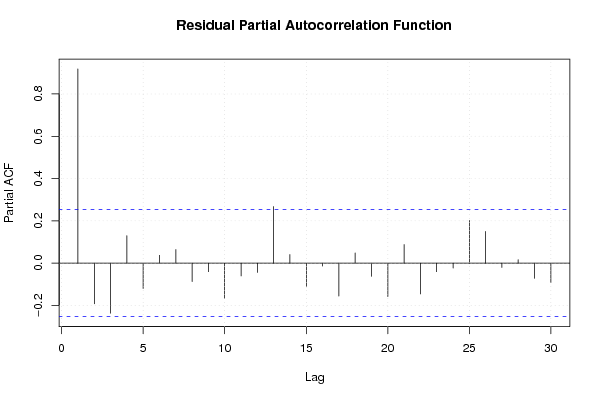
pacf(mysum$resid, lag.max=length(mysum$resid)/2, main='Residual Partial Autocorrelation Function')
grid()
dev.off()
bitmap(file='test8.png')
opar <- par(mfrow = c(2,2), oma = c(0, 0, 1.1, 0))
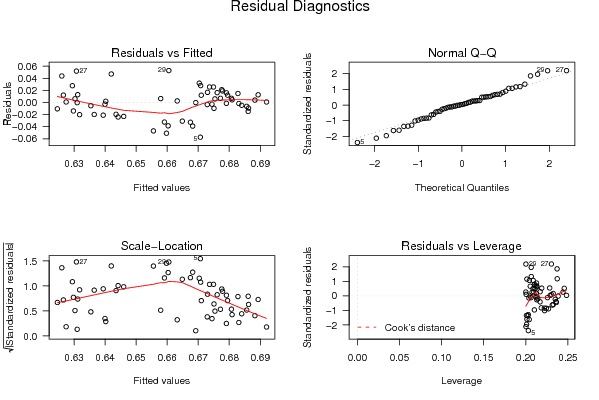
plot(mylm, las = 1, sub='Residual Diagnostics')
par(opar)
dev.off()
if (n > n25) {
bitmap(file='test9.png')
plot(kp3:nmkm3,gqarr[,2], main='Goldfeld-Quandt test',ylab='2-sided p-value',xlab='breakpoint')
grid()
dev.off()
}
load(file='createtable')
a<-table.start()
a<-table.row.start(a)
a<-table.element(a, 'Multiple Linear Regression - Estimated Regression Equation', 1, TRUE)
a<-table.row.end(a)
myeq <- colnames(x)[1]
myeq <- paste(myeq, '[t] = ', sep='')
for (i in 1:k){
if (mysum$coefficients[i,1] > 0) myeq <- paste(myeq, '+', '')
myeq <- paste(myeq, mysum$coefficients[i,1], sep=' ')
if (rownames(mysum$coefficients)[i] != '(Intercept)') {
myeq <- paste(myeq, rownames(mysum$coefficients)[i], sep='')
if (rownames(mysum$coefficients)[i] != 't') myeq <- paste(myeq, '[t]', sep='')
}
}
myeq <- paste(myeq, ' + e[t]')
a<-table.row.start(a)
a<-table.element(a, myeq)
a<-table.row.end(a)
a<-table.end(a)
table.save(a,file='mytable1.tab')
a<-table.start()
a<-table.row.start(a)
a<-table.element(a,hyperlink('ols1.htm','Multiple Linear Regression - Ordinary Least Squares',''), 6, TRUE)
a<-table.row.end(a)
a<-table.row.start(a)
a<-table.element(a,'Variable',header=TRUE)
a<-table.element(a,'Parameter',header=TRUE)
a<-table.element(a,'S.D.',header=TRUE)
a<-table.element(a,'T-STAT
H0: parameter = 0',header=TRUE)
a<-table.element(a,'2-tail p-value',header=TRUE)
a<-table.element(a,'1-tail p-value',header=TRUE)
a<-table.row.end(a)
for (i in 1:k){
a<-table.row.start(a)
a<-table.element(a,rownames(mysum$coefficients)[i],header=TRUE)
a<-table.element(a,mysum$coefficients[i,1])
a<-table.element(a, round(mysum$coefficients[i,2],6))
a<-table.element(a, round(mysum$coefficients[i,3],4))
a<-table.element(a, round(mysum$coefficients[i,4],6))
a<-table.element(a, round(mysum$coefficients[i,4]/2,6))
a<-table.row.end(a)
}
a<-table.end(a)
table.save(a,file='mytable2.tab')
a<-table.start()
a<-table.row.start(a)
a<-table.element(a, 'Multiple Linear Regression - Regression Statistics', 2, TRUE)
a<-table.row.end(a)
a<-table.row.start(a)
a<-table.element(a, 'Multiple R',1,TRUE)
a<-table.element(a, sqrt(mysum$r.squared))
a<-table.row.end(a)
a<-table.row.start(a)
a<-table.element(a, 'R-squared',1,TRUE)
a<-table.element(a, mysum$r.squared)
a<-table.row.end(a)
a<-table.row.start(a)
a<-table.element(a, 'Adjusted R-squared',1,TRUE)
a<-table.element(a, mysum$adj.r.squared)
a<-table.row.end(a)
a<-table.row.start(a)
a<-table.element(a, 'F-TEST (value)',1,TRUE)
a<-table.element(a, mysum$fstatistic[1])
a<-table.row.end(a)
a<-table.row.start(a)
a<-table.element(a, 'F-TEST (DF numerator)',1,TRUE)
a<-table.element(a, mysum$fstatistic[2])
a<-table.row.end(a)
a<-table.row.start(a)
a<-table.element(a, 'F-TEST (DF denominator)',1,TRUE)
a<-table.element(a, mysum$fstatistic[3])
a<-table.row.end(a)
a<-table.row.start(a)
a<-table.element(a, 'p-value',1,TRUE)
a<-table.element(a, 1-pf(mysum$fstatistic[1],mysum$fstatistic[2],mysum$fstatistic[3]))
a<-table.row.end(a)
a<-table.row.start(a)
a<-table.element(a, 'Multiple Linear Regression - Residual Statistics', 2, TRUE)
a<-table.row.end(a)
a<-table.row.start(a)
a<-table.element(a, 'Residual Standard Deviation',1,TRUE)
a<-table.element(a, mysum$sigma)
a<-table.row.end(a)
a<-table.row.start(a)
a<-table.element(a, 'Sum Squared Residuals',1,TRUE)
a<-table.element(a, sum(myerror*myerror))
a<-table.row.end(a)
a<-table.end(a)
table.save(a,file='mytable3.tab')
a<-table.start()
a<-table.row.start(a)
a<-table.element(a, 'Multiple Linear Regression - Actuals, Interpolation, and Residuals', 4, TRUE)
a<-table.row.end(a)
a<-table.row.start(a)
a<-table.element(a, 'Time or Index', 1, TRUE)
a<-table.element(a, 'Actuals', 1, TRUE)
a<-table.element(a, 'Interpolation
Forecast', 1, TRUE)
a<-table.element(a, 'Residuals
Prediction Error', 1, TRUE)
a<-table.row.end(a)
for (i in 1:n) {
a<-table.row.start(a)
a<-table.element(a,i, 1, TRUE)
a<-table.element(a,x[i])
a<-table.element(a,x[i]-mysum$resid[i])
a<-table.element(a,mysum$resid[i])
a<-table.row.end(a)
}
a<-table.end(a)
table.save(a,file='mytable4.tab')
if (n > n25) {
a<-table.start()
a<-table.row.start(a)
a<-table.element(a,'Goldfeld-Quandt test for Heteroskedasticity',4,TRUE)
a<-table.row.end(a)
a<-table.row.start(a)
a<-table.element(a,'p-values',header=TRUE)
a<-table.element(a,'Alternative Hypothesis',3,header=TRUE)
a<-table.row.end(a)
a<-table.row.start(a)
a<-table.element(a,'breakpoint index',header=TRUE)
a<-table.element(a,'greater',header=TRUE)
a<-table.element(a,'2-sided',header=TRUE)
a<-table.element(a,'less',header=TRUE)
a<-table.row.end(a)
for (mypoint in kp3:nmkm3) {
a<-table.row.start(a)
a<-table.element(a,mypoint,header=TRUE)
a<-table.element(a,gqarr[mypoint-kp3+1,1])
a<-table.element(a,gqarr[mypoint-kp3+1,2])
a<-table.element(a,gqarr[mypoint-kp3+1,3])
a<-table.row.end(a)
}
a<-table.end(a)
table.save(a,file='mytable5.tab')
a<-table.start()
a<-table.row.start(a)
a<-table.element(a,'Meta Analysis of Goldfeld-Quandt test for Heteroskedasticity',4,TRUE)
a<-table.row.end(a)
a<-table.row.start(a)
a<-table.element(a,'Description',header=TRUE)
a<-table.element(a,'# significant tests',header=TRUE)
a<-table.element(a,'% significant tests',header=TRUE)
a<-table.element(a,'OK/NOK',header=TRUE)
a<-table.row.end(a)
a<-table.row.start(a)
a<-table.element(a,'1% type I error level',header=TRUE)
a<-table.element(a,numsignificant1)
a<-table.element(a,numsignificant1/numgqtests)
if (numsignificant1/numgqtests < 0.01) dum <- 'OK' else dum <- 'NOK'
a<-table.element(a,dum)
a<-table.row.end(a)
a<-table.row.start(a)
a<-table.element(a,'5% type I error level',header=TRUE)
a<-table.element(a,numsignificant5)
a<-table.element(a,numsignificant5/numgqtests)
if (numsignificant5/numgqtests < 0.05) dum <- 'OK' else dum <- 'NOK'
a<-table.element(a,dum)
a<-table.row.end(a)
a<-table.row.start(a)
a<-table.element(a,'10% type I error level',header=TRUE)
a<-table.element(a,numsignificant10)
a<-table.element(a,numsignificant10/numgqtests)
if (numsignificant10/numgqtests < 0.1) dum <- 'OK' else dum <- 'NOK'
a<-table.element(a,dum)
a<-table.row.end(a)
a<-table.end(a)
table.save(a,file='mytable6.tab')
}