| Multiple Linear Regression - Estimated Regression Equation |
| Britse_pond[t] = -0.193118251040811 + 0.567705764717280Zwitserse_frank[t] -0.00746666831058105M1[t] -0.0138813841718164M2[t] -0.0103682668776646M3[t] -0.0144070773741441M4[t] -0.0067032868376685M5[t] -0.0114292644117932M6[t] -0.0105289028988846M7[t] -0.00748715228241673M8[t] -0.00750840906356317M9[t] -0.00316126934353599M10[t] + 8.93218259334423e-05M11[t] + e[t] |
| Multiple Linear Regression - Ordinary Least Squares | |||||
| Variable | Parameter | S.D. | T-STAT H0: parameter = 0 | 2-tail p-value | 1-tail p-value |
| (Intercept) | -0.193118251040811 | 0.147615 | -1.3083 | 0.197149 | 0.098575 |
| Zwitserse_frank | 0.567705764717280 | 0.097028 | 5.8509 | 0 | 0 |
| M1 | -0.00746666831058105 | 0.017021 | -0.4387 | 0.66291 | 0.331455 |
| M2 | -0.0138813841718164 | 0.017027 | -0.8153 | 0.419029 | 0.209515 |
| M3 | -0.0103682668776646 | 0.017022 | -0.6091 | 0.545377 | 0.272688 |
| M4 | -0.0144070773741441 | 0.017022 | -0.8464 | 0.401643 | 0.200822 |
| M5 | -0.0067032868376685 | 0.017022 | -0.3938 | 0.695508 | 0.347754 |
| M6 | -0.0114292644117932 | 0.017023 | -0.6714 | 0.505245 | 0.252623 |
| M7 | -0.0105289028988846 | 0.017029 | -0.6183 | 0.539366 | 0.269683 |
| M8 | -0.00748715228241673 | 0.01703 | -0.4397 | 0.662203 | 0.331102 |
| M9 | -0.00750840906356317 | 0.017023 | -0.4411 | 0.66119 | 0.330595 |
| M10 | -0.00316126934353599 | 0.017021 | -0.1857 | 0.853459 | 0.426729 |
| M11 | 8.93218259334423e-05 | 0.017027 | 0.0052 | 0.995836 | 0.497918 |
| Multiple Linear Regression - Regression Statistics | |
| Multiple R | 0.655418571879294 |
| R-squared | 0.429573504364294 |
| Adjusted R-squared | 0.283932696967943 |
| F-TEST (value) | 2.94954080551917 |
| F-TEST (DF numerator) | 12 |
| F-TEST (DF denominator) | 47 |
| p-value | 0.00394358814395668 |
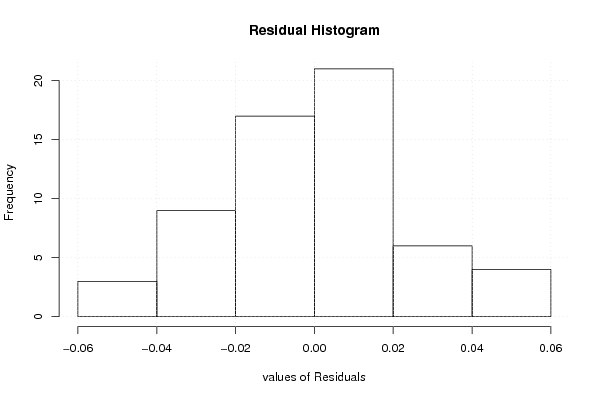
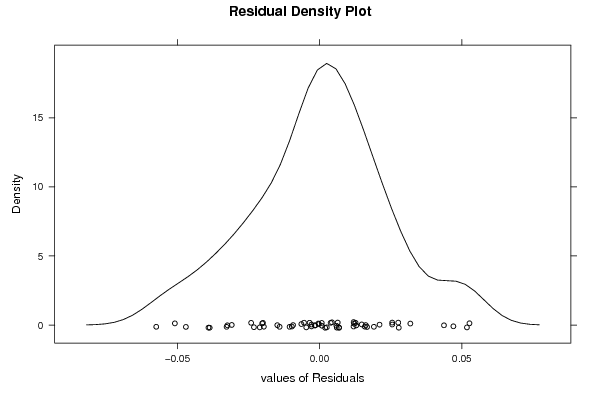
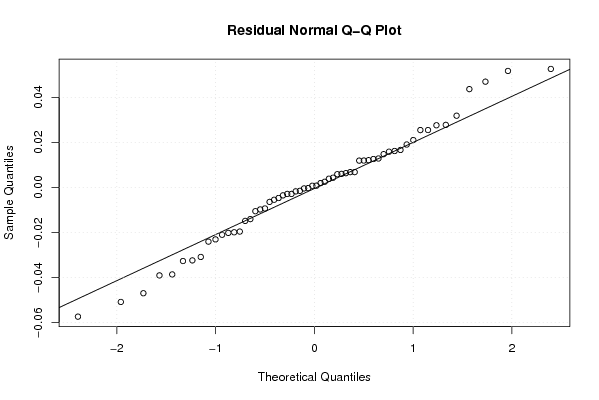
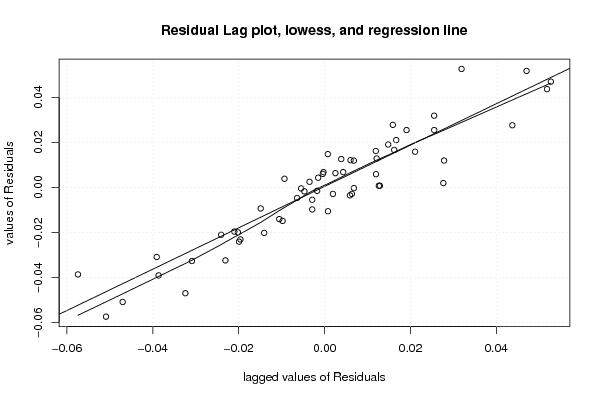
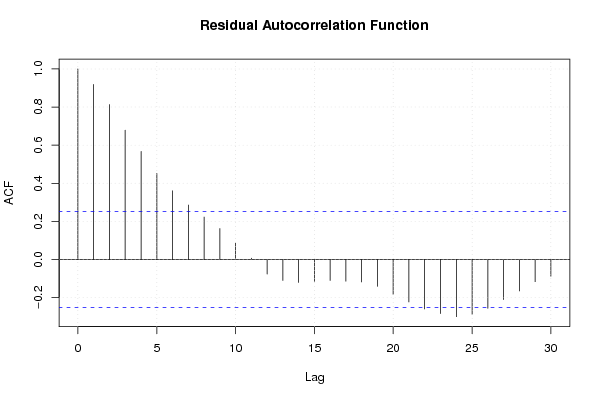
| Multiple Linear Regression - Residual Statistics | |
| Residual Standard Deviation | 0.0269125781659805 |
| Sum Squared Residuals | 0.0340414825863804 |
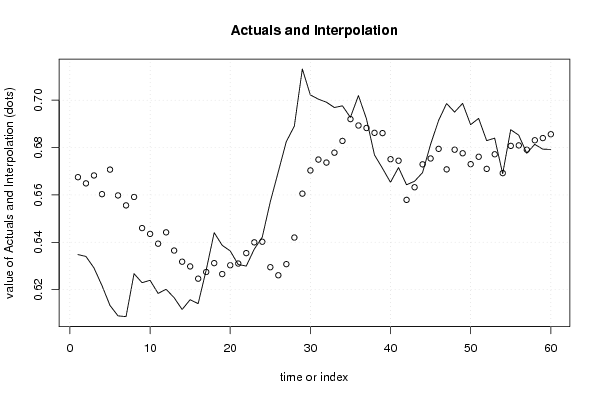
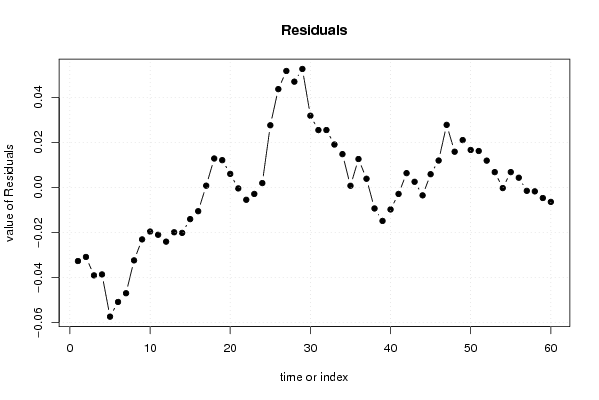
| Multiple Linear Regression - Actuals, Interpolation, and Residuals | |||
| Time or Index | Actuals | Interpolation Forecast | Residuals Prediction Error |
| 1 | 0.6348 | 0.667493965477801 | -0.0326939654778007 |
| 2 | 0.634 | 0.66488287824017 | -0.0308828782401705 |
| 3 | 0.62915 | 0.668225683804907 | -0.0390756838049072 |
| 4 | 0.62168 | 0.66032647410835 | -0.0386464741083502 |
| 5 | 0.61328 | 0.670698481738997 | -0.057418481738997 |
| 6 | 0.6089 | 0.659784511329454 | -0.0508845113294539 |
| 7 | 0.60857 | 0.655575520959907 | -0.047005520959907 |
| 8 | 0.62672 | 0.65912820676462 | -0.0324082067646203 |
| 9 | 0.62291 | 0.645992946818505 | -0.0230829468185049 |
| 10 | 0.62393 | 0.643527617361925 | -0.0195976173619247 |
| 11 | 0.61838 | 0.63939803359007 | -0.0210180335900694 |
| 12 | 0.62012 | 0.644190981340705 | -0.0240709813407047 |
| 13 | 0.61659 | 0.636497230724237 | -0.0199072307242367 |
| 14 | 0.6116 | 0.631785632157153 | -0.0201856321571531 |
| 15 | 0.61573 | 0.629792003533547 | -0.0140620035335473 |
| 16 | 0.61407 | 0.624617781507633 | -0.0105477815076333 |
| 17 | 0.62823 | 0.62743930246754 | 0.000790697532459633 |
| 18 | 0.64405 | 0.631172140787703 | 0.0128778592122969 |
| 19 | 0.6387 | 0.626565756382854 | 0.0121342436171460 |
| 20 | 0.63633 | 0.630288753916983 | 0.0060412460830173 |
| 21 | 0.63059 | 0.631005514629969 | -0.000415514629968741 |
| 22 | 0.62994 | 0.635409424926468 | -0.00546942492646756 |
| 23 | 0.63709 | 0.639965739354787 | -0.00287573935478673 |
| 24 | 0.64217 | 0.640217040987684 | 0.00195295901231635 |
| 25 | 0.65711 | 0.629457679241742 | 0.0276523207582576 |
| 26 | 0.66977 | 0.626051803933509 | 0.0437181960664914 |
| 27 | 0.68255 | 0.630757103333567 | 0.0517928966664333 |
| 28 | 0.68902 | 0.641989577907982 | 0.047030422092018 |
| 29 | 0.71322 | 0.660536548550558 | 0.0526834514494423 |
| 30 | 0.70224 | 0.670343838553195 | 0.0318961614468047 |
| 31 | 0.70045 | 0.674934287536766 | 0.0255157124632337 |
| 32 | 0.69919 | 0.673661474341383 | 0.0255285256586172 |
| 33 | 0.69693 | 0.677841240219144 | 0.0190887597808558 |
| 34 | 0.69763 | 0.68281285628036 | 0.0148171437196396 |
| 35 | 0.69278 | 0.692024357979361 | 0.000755642020638745 |
| 36 | 0.70196 | 0.689323589635728 | 0.0126364103642717 |
| 37 | 0.69215 | 0.688271996466453 | 0.00387800353354748 |
| 38 | 0.6769 | 0.68622861499354 | -0.00932861499354018 |
| 39 | 0.67124 | 0.686108415393501 | -0.0148684153935014 |
| 40 | 0.66532 | 0.675086823990999 | -0.0097668239909994 |
| 41 | 0.67157 | 0.674445339786131 | -0.00287533978613102 |
| 42 | 0.66428 | 0.657911082305887 | 0.00636891769411299 |
| 43 | 0.66576 | 0.66323954878359 | 0.00252045121640979 |
| 44 | 0.66942 | 0.67292345684725 | -0.00350345684725027 |
| 45 | 0.6813 | 0.67540010543086 | 0.00589989456914017 |
| 46 | 0.69144 | 0.679463392268528 | 0.0119766077314716 |
| 47 | 0.69862 | 0.670792162378935 | 0.027827837621065 |
| 48 | 0.695 | 0.679104885870817 | 0.0158951141291827 |
| 49 | 0.69867 | 0.677599128089768 | 0.0210708719102324 |
| 50 | 0.68968 | 0.673001070675628 | 0.0166789293243724 |
| 51 | 0.69233 | 0.676116793934477 | 0.0162132060655226 |
| 52 | 0.68293 | 0.670999342485035 | 0.0119306575149649 |
| 53 | 0.68399 | 0.677170327456774 | 0.00681967254322608 |
| 54 | 0.66895 | 0.66920842702376 | -0.000258427023760691 |
| 55 | 0.68756 | 0.680724886336883 | 0.00683511366311744 |
| 56 | 0.68527 | 0.680928108129764 | 0.00434189187023613 |
| 57 | 0.6776 | 0.679090192901522 | -0.00149019290152228 |
| 58 | 0.68137 | 0.683096709162719 | -0.00172670916271895 |
| 59 | 0.67933 | 0.684019706696848 | -0.00468970669684757 |
| 60 | 0.67922 | 0.685633502165066 | -0.00641350216506599 |
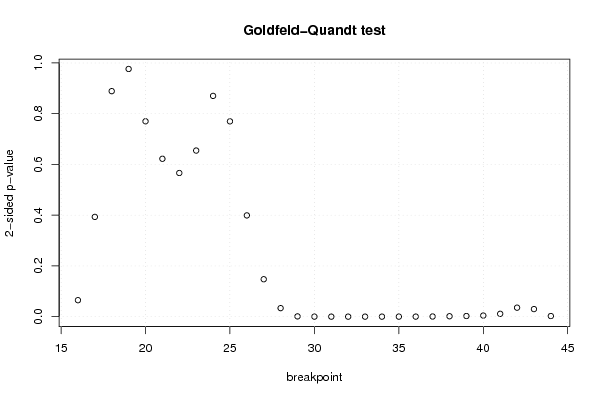
| Goldfeld-Quandt test for Heteroskedasticity | |||
| p-values | Alternative Hypothesis | ||
| breakpoint index | greater | 2-sided | less |
| 16 | 0.032494819893531 | 0.064989639787062 | 0.96750518010647 |
| 17 | 0.196575921116765 | 0.393151842233531 | 0.803424078883235 |
| 18 | 0.444409751691455 | 0.88881950338291 | 0.555590248308545 |
| 19 | 0.488159561609735 | 0.97631912321947 | 0.511840438390265 |
| 20 | 0.384986803645012 | 0.769973607290025 | 0.615013196354988 |
| 21 | 0.311145420274273 | 0.622290840548546 | 0.688854579725727 |
| 22 | 0.28313073480014 | 0.56626146960028 | 0.71686926519986 |
| 23 | 0.327334941887311 | 0.654669883774622 | 0.672665058112689 |
| 24 | 0.435030442032027 | 0.870060884064055 | 0.564969557967973 |
| 25 | 0.615077188504003 | 0.769845622991994 | 0.384922811495997 |
| 26 | 0.800461039466728 | 0.399077921066543 | 0.199538960533272 |
| 27 | 0.92625787312036 | 0.147484253759279 | 0.0737421268796395 |
| 28 | 0.983195400347946 | 0.0336091993041082 | 0.0168045996520541 |
| 29 | 0.99945036473539 | 0.00109927052921880 | 0.000549635264609399 |
| 30 | 0.99995786864813 | 8.4262703740447e-05 | 4.21313518702235e-05 |
| 31 | 0.99998717382457 | 2.56523508595981e-05 | 1.28261754297990e-05 |
| 32 | 0.999992080033146 | 1.58399337078415e-05 | 7.91996685392075e-06 |
| 33 | 0.9999915107246 | 1.69785508000576e-05 | 8.48927540002881e-06 |
| 34 | 0.999982894577992 | 3.42108440168021e-05 | 1.71054220084011e-05 |
| 35 | 0.999947199525987 | 0.000105600948025416 | 5.28004740127081e-05 |
| 36 | 0.99991505272951 | 0.000169894540981569 | 8.49472704907845e-05 |
| 37 | 0.999716123050386 | 0.000567753899227538 | 0.000283876949613769 |
| 38 | 0.999202157628246 | 0.00159568474350842 | 0.00079784237175421 |
| 39 | 0.998798719585686 | 0.00240256082862784 | 0.00120128041431392 |
| 40 | 0.997848514487594 | 0.00430297102481191 | 0.00215148551240596 |
| 41 | 0.994387402697305 | 0.0112251946053903 | 0.00561259730269516 |
| 42 | 0.982287388123075 | 0.0354252237538501 | 0.0177126118769250 |
| 43 | 0.985055615542179 | 0.0298887689156426 | 0.0149443844578213 |
| 44 | 0.998789733322462 | 0.00242053335507619 | 0.00121026667753809 |
| Meta Analysis of Goldfeld-Quandt test for Heteroskedasticity | |||
| Description | # significant tests | % significant tests | OK/NOK |
| 1% type I error level | 13 | 0.448275862068966 | NOK |
| 5% type I error level | 17 | 0.586206896551724 | NOK |
| 10% type I error level | 18 | 0.620689655172414 | NOK |