| Multiple Linear Regression - Estimated Regression Equation |
| tip[t] = + 148.709722845724 -6.73344601992774wrk[t] + 10.8604325507622M1[t] + 25.4657096670195M2[t] + 23.5264393545385M3[t] + 15.8805136440503M4[t] + 9.40395958033748M5[t] + 11.7100879594146M6[t] + 13.5001892937090M7[t] + 21.692939264815M8[t] + 14.3670135543268M9[t] + 12.2570810826429M10[t] + 21.0044999741475M11[t] -0.200763493497329t + e[t] |
| Multiple Linear Regression - Ordinary Least Squares | |||||
| Variable | Parameter | S.D. | T-STAT H0: parameter = 0 | 2-tail p-value | 1-tail p-value |
| (Intercept) | 148.709722845724 | 15.459616 | 9.6192 | 0 | 0 |
| wrk | -6.73344601992774 | 1.681322 | -4.0049 | 0.000219 | 0.00011 |
| M1 | 10.8604325507622 | 3.457746 | 3.1409 | 0.002912 | 0.001456 |
| M2 | 25.4657096670195 | 3.636829 | 7.0022 | 0 | 0 |
| M3 | 23.5264393545385 | 3.698346 | 6.3613 | 0 | 0 |
| M4 | 15.8805136440503 | 3.764367 | 4.2186 | 0.000111 | 5.6e-05 |
| M5 | 9.40395958033748 | 3.692156 | 2.547 | 0.014198 | 0.007099 |
| M6 | 11.7100879594146 | 3.617235 | 3.2373 | 0.002215 | 0.001107 |
| M7 | 13.5001892937090 | 3.608518 | 3.7412 | 0.000498 | 0.000249 |
| M8 | 21.692939264815 | 3.615371 | 6.0002 | 0 | 0 |
| M9 | 14.3670135543268 | 3.648186 | 3.9381 | 0.000271 | 0.000135 |
| M10 | 12.2570810826429 | 3.728772 | 3.2872 | 0.00192 | 0.00096 |
| M11 | 21.0044999741475 | 3.76136 | 5.5843 | 1e-06 | 1e-06 |
| t | -0.200763493497329 | 0.062979 | -3.1878 | 0.002551 | 0.001275 |
| Multiple Linear Regression - Regression Statistics | |
| Multiple R | 0.85112026922121 |
| R-squared | 0.724405712679186 |
| Adjusted R-squared | 0.648177505547897 |
| F-TEST (value) | 9.50311885771538 |
| F-TEST (DF numerator) | 13 |
| F-TEST (DF denominator) | 47 |
| p-value | 3.17124770887744e-09 |
| Multiple Linear Regression - Residual Statistics | |
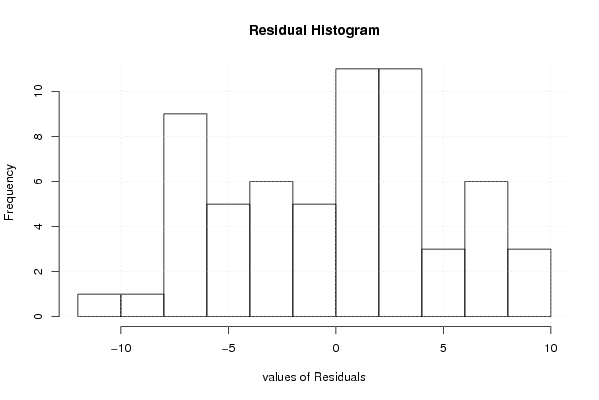
| Residual Standard Deviation | 5.69196778054146 |
| Sum Squared Residuals | 1522.72936909194 |
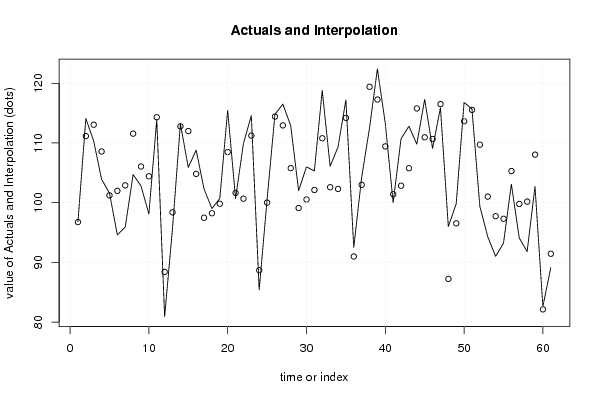
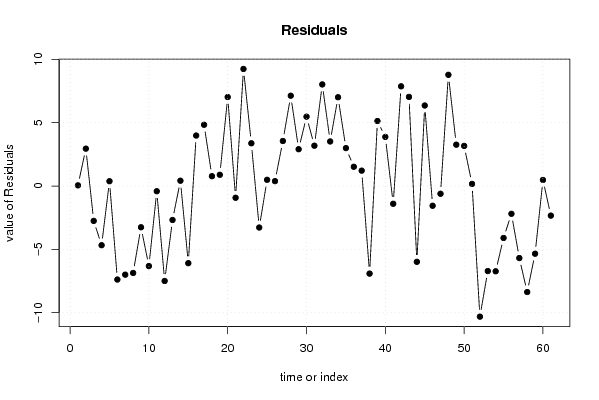
| Multiple Linear Regression - Actuals, Interpolation, and Residuals | |||
| Time or Index | Actuals | Interpolation Forecast | Residuals Prediction Error |
| 1 | 96.8 | 96.7483439176615 | 0.0516560823385169 |
| 2 | 114.1 | 111.152857540421 | 2.94714245957885 |
| 3 | 110.3 | 113.052891346400 | -2.7528913463995 |
| 4 | 103.9 | 108.572925152378 | -4.67292515237781 |
| 5 | 101.6 | 101.222262993175 | 0.377737006825067 |
| 6 | 94.6 | 101.980938674769 | -7.38093867476915 |
| 7 | 95.9 | 102.896931913573 | -6.99693191357347 |
| 8 | 104.7 | 111.562262993175 | -6.86226299317491 |
| 9 | 102.8 | 106.055607595168 | -3.25560759516771 |
| 10 | 98.1 | 104.418256231979 | -6.31825623197926 |
| 11 | 113.9 | 114.311600833972 | -0.411600833972023 |
| 12 | 80.9 | 88.3929251523778 | -7.49292515237782 |
| 13 | 95.7 | 98.3792496076499 | -2.67924960764985 |
| 14 | 113.2 | 112.783763230410 | 0.416236769590139 |
| 15 | 105.9 | 111.990418628417 | -6.09041862841709 |
| 16 | 108.8 | 104.817074026424 | 3.98292597357569 |
| 17 | 102.3 | 97.4664118672214 | 4.83358813277858 |
| 18 | 99 | 98.2250875488157 | 0.774912451184354 |
| 19 | 100.7 | 99.8144253896128 | 0.885574610387246 |
| 20 | 115.5 | 108.479756469214 | 7.0202435307858 |
| 21 | 100.7 | 101.626411867221 | -0.926411867221417 |
| 22 | 109.9 | 100.662405106026 | 9.23759489397426 |
| 23 | 114.6 | 111.229094310011 | 3.37090568998868 |
| 24 | 85.4 | 88.677141638381 | -3.27714163838096 |
| 25 | 100.5 | 100.010155297639 | 0.489844702361455 |
| 26 | 114.8 | 114.414668920399 | 0.385331079601439 |
| 27 | 116.5 | 112.947979716413 | 3.55202028358699 |
| 28 | 112.9 | 105.774635114420 | 7.12536488557977 |
| 29 | 102 | 99.0973175572101 | 2.90268244278989 |
| 30 | 106 | 100.529337840797 | 5.4706621592029 |
| 31 | 105.3 | 102.118675681594 | 3.18132431840578 |
| 32 | 118.8 | 110.784006761196 | 8.01599323880433 |
| 33 | 106.1 | 102.583972955217 | 3.51602704478266 |
| 34 | 109.3 | 102.293310796014 | 7.00668920398555 |
| 35 | 117.2 | 114.206689203986 | 2.99331079601445 |
| 36 | 92.5 | 90.9813919303624 | 1.51860806963758 |
| 37 | 104.2 | 102.987750191613 | 1.21224980838722 |
| 38 | 112.5 | 119.412297620351 | -6.91229762035112 |
| 39 | 122.4 | 117.272263814373 | 5.12773618562722 |
| 40 | 113.3 | 109.425574610387 | 3.87442538961275 |
| 41 | 100 | 101.401567849192 | -1.40156784919158 |
| 42 | 110.7 | 102.833588132779 | 7.86641186722143 |
| 43 | 112.8 | 105.769615177561 | 7.03038482243877 |
| 44 | 109.8 | 115.781635461148 | -5.98163546114823 |
| 45 | 117.3 | 110.948324665134 | 6.35167533486623 |
| 46 | 109.1 | 110.657662505931 | -1.55766250593089 |
| 47 | 115.9 | 116.510939495967 | -0.610939495967005 |
| 48 | 96 | 87.225540804409 | 8.77445919559107 |
| 49 | 99.8 | 96.5385206576882 | 3.26147934231181 |
| 50 | 116.8 | 113.636412688419 | 3.16358731158070 |
| 51 | 115.7 | 115.536446494398 | 0.163553505602383 |
| 52 | 99.4 | 109.709791096390 | -10.3097910963904 |
| 53 | 94.3 | 101.012439733202 | -6.71243973320195 |
| 54 | 91 | 97.7310478028395 | -6.73104780283953 |
| 55 | 93.2 | 97.3003518376583 | -4.10035183765832 |
| 56 | 103.1 | 105.292338315267 | -2.19233831526699 |
| 57 | 94.1 | 99.7856829172598 | -5.68568291725976 |
| 58 | 91.8 | 100.168365360050 | -8.36836536004965 |
| 59 | 102.7 | 108.041676156064 | -5.3416761560641 |
| 60 | 82.6 | 82.1230004744699 | 0.47699952553011 |
| 61 | 89.1 | 91.4359803277491 | -2.33598032774915 |
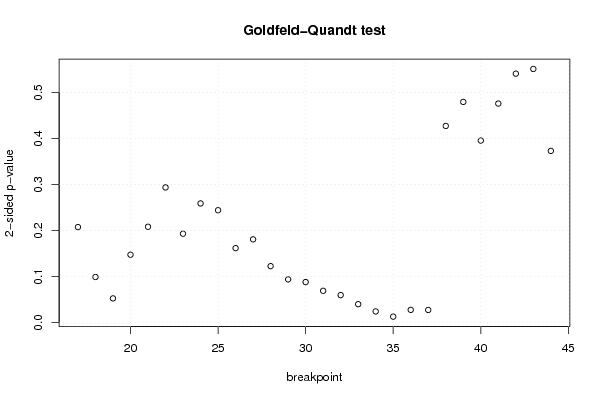
| Goldfeld-Quandt test for Heteroskedasticity | |||
| p-values | Alternative Hypothesis | ||
| breakpoint index | greater | 2-sided | less |
| 17 | 0.103644711302395 | 0.207289422604789 | 0.896355288697605 |
| 18 | 0.0493284138367071 | 0.0986568276734143 | 0.950671586163293 |
| 19 | 0.0260896876526105 | 0.052179375305221 | 0.97391031234739 |
| 20 | 0.0735792231557039 | 0.147158446311408 | 0.926420776844296 |
| 21 | 0.103961921022482 | 0.207923842044964 | 0.896038078977518 |
| 22 | 0.146757177135812 | 0.293514354271624 | 0.853242822864188 |
| 23 | 0.0963903534003695 | 0.192780706800739 | 0.90360964659963 |
| 24 | 0.129339944778401 | 0.258679889556801 | 0.8706600552216 |
| 25 | 0.121948349830986 | 0.243896699661971 | 0.878051650169015 |
| 26 | 0.0807158429044832 | 0.161431685808966 | 0.919284157095517 |
| 27 | 0.0902857951590934 | 0.180571590318187 | 0.909714204840907 |
| 28 | 0.0611501288616575 | 0.122300257723315 | 0.938849871138343 |
| 29 | 0.0467465613825124 | 0.0934931227650248 | 0.953253438617488 |
| 30 | 0.0438284966418503 | 0.0876569932837006 | 0.95617150335815 |
| 31 | 0.0343480422445660 | 0.0686960844891319 | 0.965651957755434 |
| 32 | 0.0296406039680056 | 0.0592812079360112 | 0.970359396031994 |
| 33 | 0.0197696235977607 | 0.0395392471955215 | 0.98023037640224 |
| 34 | 0.0119030350749487 | 0.0238060701498974 | 0.988096964925051 |
| 35 | 0.00621844985537458 | 0.0124368997107492 | 0.993781550144625 |
| 36 | 0.0135963146089699 | 0.0271926292179397 | 0.98640368539103 |
| 37 | 0.0135084778538605 | 0.0270169557077210 | 0.98649152214614 |
| 38 | 0.213632244812531 | 0.427264489625061 | 0.78636775518747 |
| 39 | 0.239767571237016 | 0.479535142474033 | 0.760232428762984 |
| 40 | 0.197696609767324 | 0.395393219534649 | 0.802303390232675 |
| 41 | 0.237947597161131 | 0.475895194322261 | 0.76205240283887 |
| 42 | 0.270467894535583 | 0.540935789071166 | 0.729532105464417 |
| 43 | 0.275592063116883 | 0.551184126233766 | 0.724407936883117 |
| 44 | 0.813516799760314 | 0.372966400479371 | 0.186483200239686 |
| Meta Analysis of Goldfeld-Quandt test for Heteroskedasticity | |||
| Description | # significant tests | % significant tests | OK/NOK |
| 1% type I error level | 0 | 0 | OK |
| 5% type I error level | 5 | 0.178571428571429 | NOK |
| 10% type I error level | 11 | 0.392857142857143 | NOK |