| Multiple Linear Regression - Estimated Regression Equation |
| Y[t] = + 1.77078780452645 -3.52383385534748X[t] + 0.0536256306760848t + e[t] |
| Multiple Linear Regression - Ordinary Least Squares | |||||
| Variable | Parameter | S.D. | T-STAT H0: parameter = 0 | 2-tail p-value | 1-tail p-value |
| (Intercept) | 1.77078780452645 | 0.148037 | 11.9618 | 0 | 0 |
| X | -3.52383385534748 | 0.230361 | -15.297 | 0 | 0 |
| t | 0.0536256306760848 | 0.005147 | 10.4189 | 0 | 0 |
| Multiple Linear Regression - Regression Statistics | |
| Multiple R | 0.896747302244183 |
| R-squared | 0.80415572408222 |
| Adjusted R-squared | 0.797283995102648 |
| F-TEST (value) | 117.023783457245 |
| F-TEST (DF numerator) | 2 |
| F-TEST (DF denominator) | 57 |
| p-value | 0 |
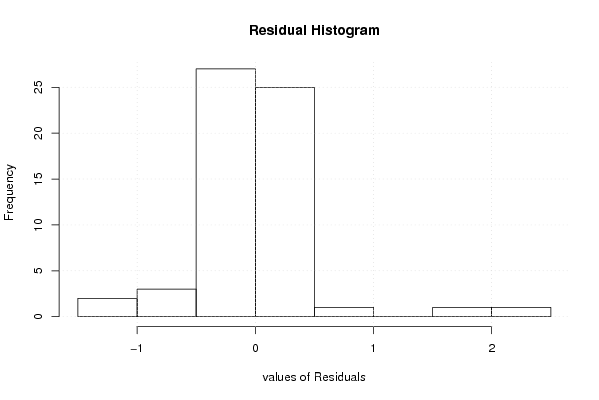
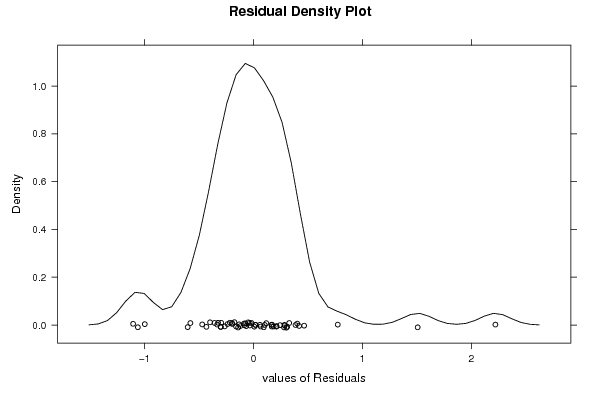
| Multiple Linear Regression - Residual Statistics | |
| Residual Standard Deviation | 0.512376397337417 |
| Sum Squared Residuals | 14.9641856352628 |
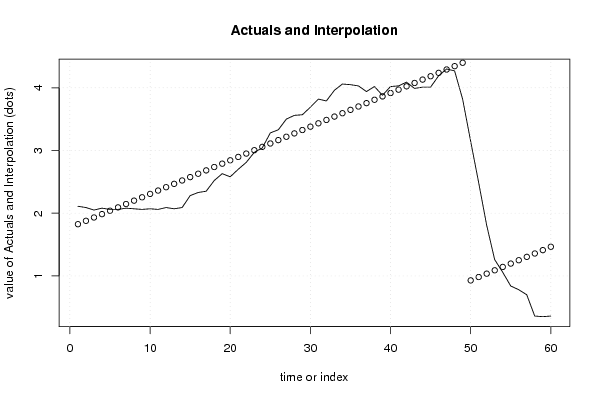
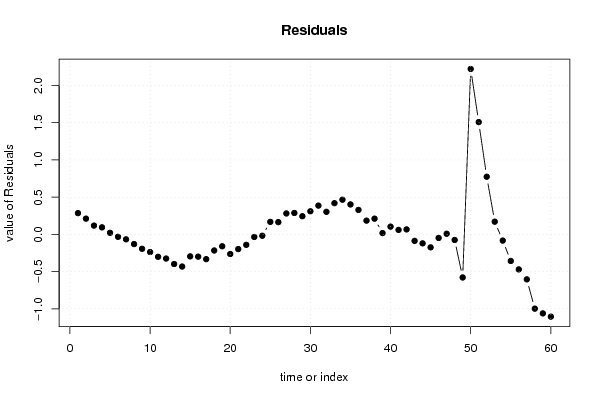
| Multiple Linear Regression - Actuals, Interpolation, and Residuals | |||
| Time or Index | Actuals | Interpolation Forecast | Residuals Prediction Error |
| 1 | 2.11 | 1.82441343520253 | 0.285586564797467 |
| 2 | 2.09 | 1.87803906587862 | 0.211960934121378 |
| 3 | 2.05 | 1.93166469655471 | 0.118335303445291 |
| 4 | 2.08 | 1.98529032723079 | 0.0947096727692085 |
| 5 | 2.06 | 2.03891595790688 | 0.0210840420931237 |
| 6 | 2.06 | 2.09254158858296 | -0.032541588582961 |
| 7 | 2.08 | 2.14616721925905 | -0.0661672192590457 |
| 8 | 2.07 | 2.19979284993513 | -0.129792849935131 |
| 9 | 2.06 | 2.25341848061122 | -0.193418480611215 |
| 10 | 2.07 | 2.3070441112873 | -0.23704411128730 |
| 11 | 2.06 | 2.36066974196338 | -0.300669741963385 |
| 12 | 2.09 | 2.41429537263947 | -0.32429537263947 |
| 13 | 2.07 | 2.46792100331555 | -0.397921003315554 |
| 14 | 2.09 | 2.52154663399164 | -0.431546633991639 |
| 15 | 2.28 | 2.57517226466772 | -0.295172264667724 |
| 16 | 2.33 | 2.62879789534381 | -0.298797895343809 |
| 17 | 2.35 | 2.68242352601989 | -0.332423526019893 |
| 18 | 2.52 | 2.73604915669598 | -0.216049156695978 |
| 19 | 2.63 | 2.78967478737206 | -0.159674787372063 |
| 20 | 2.58 | 2.84330041804815 | -0.263300418048148 |
| 21 | 2.7 | 2.89692604872423 | -0.196926048724232 |
| 22 | 2.81 | 2.95055167940032 | -0.140551679400317 |
| 23 | 2.97 | 3.0041773100764 | -0.0341773100764017 |
| 24 | 3.04 | 3.05780294075249 | -0.0178029407524866 |
| 25 | 3.28 | 3.11142857142857 | 0.168571428571428 |
| 26 | 3.33 | 3.16505420210466 | 0.164945797895344 |
| 27 | 3.5 | 3.21867983278074 | 0.281320167219259 |
| 28 | 3.56 | 3.27230546345683 | 0.287694536543174 |
| 29 | 3.57 | 3.32593109413291 | 0.244068905867089 |
| 30 | 3.69 | 3.37955672480900 | 0.310443275191005 |
| 31 | 3.82 | 3.43318235548508 | 0.38681764451492 |
| 32 | 3.79 | 3.48680798616116 | 0.303192013838835 |
| 33 | 3.96 | 3.54043361683725 | 0.419566383162751 |
| 34 | 4.06 | 3.59405924751333 | 0.465940752486666 |
| 35 | 4.05 | 3.64768487818942 | 0.402315121810581 |
| 36 | 4.03 | 3.70131050886550 | 0.328689491134497 |
| 37 | 3.94 | 3.75493613954159 | 0.185063860458411 |
| 38 | 4.02 | 3.80856177021767 | 0.211438229782326 |
| 39 | 3.88 | 3.86218740089376 | 0.017812599106242 |
| 40 | 4.02 | 3.91581303156984 | 0.104186968430157 |
| 41 | 4.03 | 3.96943866224593 | 0.0605613377540729 |
| 42 | 4.09 | 4.02306429292201 | 0.0669357070779878 |
| 43 | 3.99 | 4.0766899235981 | -0.0866899235980966 |
| 44 | 4.01 | 4.13031555427418 | -0.120315554274182 |
| 45 | 4.01 | 4.18394118495027 | -0.173941184950267 |
| 46 | 4.19 | 4.23756681562635 | -0.0475668156263509 |
| 47 | 4.3 | 4.29119244630244 | 0.00880755369756383 |
| 48 | 4.27 | 4.34481807697852 | -0.0748180769785212 |
| 49 | 3.82 | 4.39844370765461 | -0.578443707654606 |
| 50 | 3.15 | 0.928235482983213 | 2.22176451701679 |
| 51 | 2.49 | 0.981861113659298 | 1.50813888634070 |
| 52 | 1.81 | 1.03548674433538 | 0.774513255664618 |
| 53 | 1.26 | 1.08911237501147 | 0.170887624988533 |
| 54 | 1.06 | 1.14273800568755 | -0.0827380056875516 |
| 55 | 0.84 | 1.19636363636364 | -0.356363636363636 |
| 56 | 0.78 | 1.24998926703972 | -0.469989267039721 |
| 57 | 0.7 | 1.30361489771581 | -0.603614897715806 |
| 58 | 0.36 | 1.35724052839189 | -0.99724052839189 |
| 59 | 0.35 | 1.41086615906798 | -1.06086615906798 |
| 60 | 0.36 | 1.46449178974406 | -1.10449178974406 |
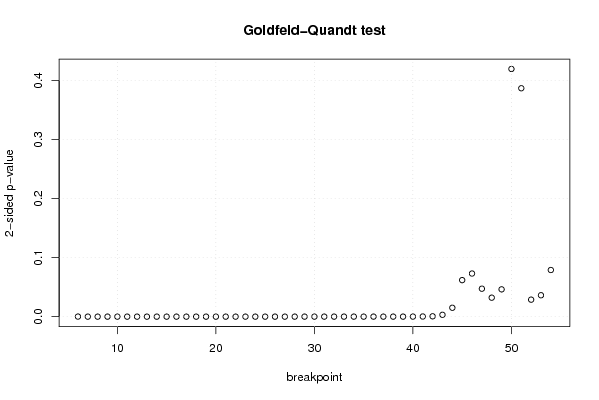
| Goldfeld-Quandt test for Heteroskedasticity | |||
| p-values | Alternative Hypothesis | ||
| breakpoint index | greater | 2-sided | less |
| 6 | 6.99618293716003e-05 | 0.000139923658743201 | 0.999930038170628 |
| 7 | 5.21805273291234e-06 | 1.04361054658247e-05 | 0.999994781947267 |
| 8 | 2.03274914330383e-07 | 4.06549828660767e-07 | 0.999999796725086 |
| 9 | 6.42583077302468e-09 | 1.28516615460494e-08 | 0.99999999357417 |
| 10 | 2.40809172621059e-10 | 4.81618345242119e-10 | 0.999999999759191 |
| 11 | 6.93666250979949e-12 | 1.38733250195990e-11 | 0.999999999993063 |
| 12 | 8.35204811944443e-13 | 1.67040962388889e-12 | 0.999999999999165 |
| 13 | 2.73324180663265e-14 | 5.4664836132653e-14 | 0.999999999999973 |
| 14 | 1.92623081124881e-15 | 3.85246162249761e-15 | 0.999999999999998 |
| 15 | 7.79926840072244e-11 | 1.55985368014449e-10 | 0.999999999922007 |
| 16 | 4.43675156387278e-10 | 8.87350312774556e-10 | 0.999999999556325 |
| 17 | 4.27247226093449e-10 | 8.54494452186898e-10 | 0.999999999572753 |
| 18 | 3.58073344947624e-09 | 7.16146689895247e-09 | 0.999999996419267 |
| 19 | 1.8286734102155e-08 | 3.657346820431e-08 | 0.999999981713266 |
| 20 | 1.21693705508033e-08 | 2.43387411016067e-08 | 0.99999998783063 |
| 21 | 1.48002648609049e-08 | 2.96005297218097e-08 | 0.999999985199735 |
| 22 | 2.53166078005328e-08 | 5.06332156010655e-08 | 0.999999974683392 |
| 23 | 8.42255707846836e-08 | 1.68451141569367e-07 | 0.99999991577443 |
| 24 | 1.78646364634147e-07 | 3.57292729268294e-07 | 0.999999821353635 |
| 25 | 1.05709974259606e-06 | 2.11419948519213e-06 | 0.999998942900257 |
| 26 | 2.49507200014264e-06 | 4.99014400028529e-06 | 0.999997504928 |
| 27 | 6.95378152702759e-06 | 1.39075630540552e-05 | 0.999993046218473 |
| 28 | 1.16816955983223e-05 | 2.33633911966447e-05 | 0.999988318304402 |
| 29 | 1.30093587940959e-05 | 2.60187175881917e-05 | 0.999986990641206 |
| 30 | 1.51820306655954e-05 | 3.03640613311908e-05 | 0.999984817969334 |
| 31 | 1.82870817809078e-05 | 3.65741635618156e-05 | 0.999981712918219 |
| 32 | 1.65092053743668e-05 | 3.30184107487336e-05 | 0.999983490794626 |
| 33 | 1.64043956829378e-05 | 3.28087913658755e-05 | 0.999983595604317 |
| 34 | 1.51321857914557e-05 | 3.02643715829115e-05 | 0.999984867814208 |
| 35 | 1.12546633650036e-05 | 2.25093267300072e-05 | 0.999988745336635 |
| 36 | 8.00251112009772e-06 | 1.60050222401954e-05 | 0.99999199748888 |
| 37 | 7.94353854538233e-06 | 1.58870770907647e-05 | 0.999992056461455 |
| 38 | 7.83529808616074e-06 | 1.56705961723215e-05 | 0.999992164701914 |
| 39 | 2.24556157433078e-05 | 4.49112314866157e-05 | 0.999977544384257 |
| 40 | 4.52678258841343e-05 | 9.05356517682685e-05 | 0.999954732174116 |
| 41 | 0.000121553705967838 | 0.000243107411935675 | 0.999878446294032 |
| 42 | 0.000288467423630803 | 0.000576934847261606 | 0.99971153257637 |
| 43 | 0.00156709051927494 | 0.00313418103854989 | 0.998432909480725 |
| 44 | 0.0075370814501137 | 0.0150741629002274 | 0.992462918549886 |
| 45 | 0.0309491287940536 | 0.0618982575881072 | 0.969050871205946 |
| 46 | 0.0365409744900518 | 0.0730819489801036 | 0.963459025509948 |
| 47 | 0.0236749423828376 | 0.0473498847656751 | 0.976325057617162 |
| 48 | 0.0160726204324550 | 0.0321452408649100 | 0.983927379567545 |
| 49 | 0.0231348026763358 | 0.0462696053526715 | 0.976865197323664 |
| 50 | 0.209906516577804 | 0.419813033155609 | 0.790093483422196 |
| 51 | 0.806455916415761 | 0.387088167168478 | 0.193544083584239 |
| 52 | 0.985601367381717 | 0.0287972652365664 | 0.0143986326182832 |
| 53 | 0.981867361681927 | 0.0362652766361454 | 0.0181326383180727 |
| 54 | 0.960462985778262 | 0.0790740284434769 | 0.0395370142217385 |
| Meta Analysis of Goldfeld-Quandt test for Heteroskedasticity | |||
| Description | # significant tests | % significant tests | OK/NOK |
| 1% type I error level | 38 | 0.775510204081633 | NOK |
| 5% type I error level | 44 | 0.897959183673469 | NOK |
| 10% type I error level | 47 | 0.959183673469388 | NOK |