| Multiple Linear Regression - Estimated Regression Equation |
| Y[t] = + 2996.21858257135 -397.434462871071X[t] + 177.028669075707M1[t] + 114.595914455059M2[t] + 334.238409008073M3[t] + 204.342364556124M4[t] + 178.748941589334M5[t] + 453.032484736411M6[t] + 22.3364402844630M7[t] -44.4569826823279M8[t] -31.3734395352507M9[t] + 164.561302458348M10[t] -197.155266290631M11[t] + 13.7164568529229t + e[t] |
| Multiple Linear Regression - Ordinary Least Squares | |||||
| Variable | Parameter | S.D. | T-STAT H0: parameter = 0 | 2-tail p-value | 1-tail p-value |
| (Intercept) | 2996.21858257135 | 185.868852 | 16.1201 | 0 | 0 |
| X | -397.434462871071 | 100.09187 | -3.9707 | 0.000244 | 0.000122 |
| M1 | 177.028669075707 | 149.576482 | 1.1835 | 0.24255 | 0.121275 |
| M2 | 114.595914455059 | 156.950654 | 0.7301 | 0.468929 | 0.234464 |
| M3 | 334.238409008073 | 156.647487 | 2.1337 | 0.038116 | 0.019058 |
| M4 | 204.342364556124 | 156.539162 | 1.3054 | 0.198119 | 0.09906 |
| M5 | 178.748941589334 | 156.325218 | 1.1434 | 0.258646 | 0.129323 |
| M6 | 453.032484736411 | 156.129905 | 2.9016 | 0.005633 | 0.002817 |
| M7 | 22.3364402844630 | 156.024256 | 0.1432 | 0.886776 | 0.443388 |
| M8 | -44.4569826823279 | 155.91773 | -0.2851 | 0.776796 | 0.388398 |
| M9 | -31.3734395352507 | 155.908904 | -0.2012 | 0.841388 | 0.420694 |
| M10 | 164.561302458348 | 155.827815 | 1.056 | 0.296346 | 0.148173 |
| M11 | -197.155266290631 | 155.758956 | -1.2658 | 0.211833 | 0.105917 |
| t | 13.7164568529229 | 5.039211 | 2.7219 | 0.009075 | 0.004537 |
| Multiple Linear Regression - Regression Statistics | |
| Multiple R | 0.729466690504987 |
| R-squared | 0.532121652556298 |
| Adjusted R-squared | 0.402708492625061 |
| F-TEST (value) | 4.11180480284261 |
| F-TEST (DF numerator) | 13 |
| F-TEST (DF denominator) | 47 |
| p-value | 0.000165474103349661 |
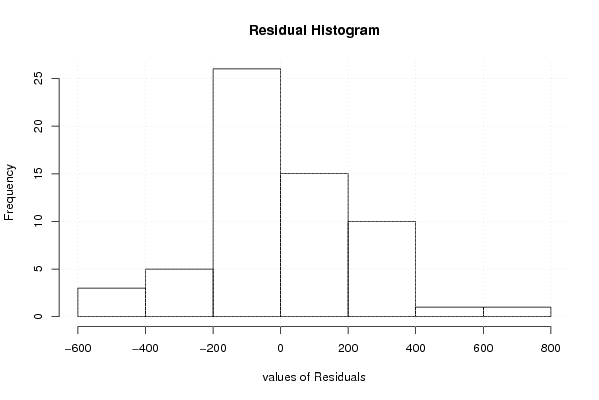
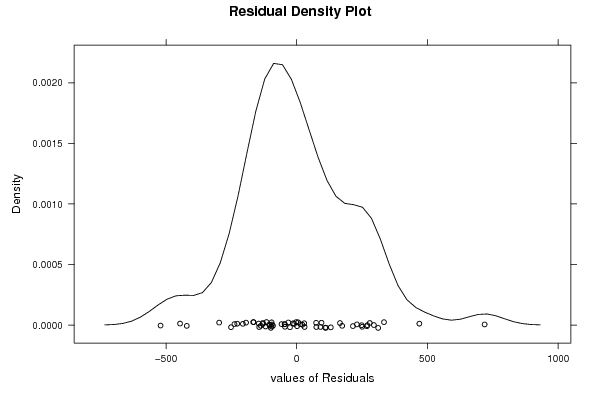
| Multiple Linear Regression - Residual Statistics | |
| Residual Standard Deviation | 246.259297428538 |
| Sum Squared Residuals | 2850251.15378987 |
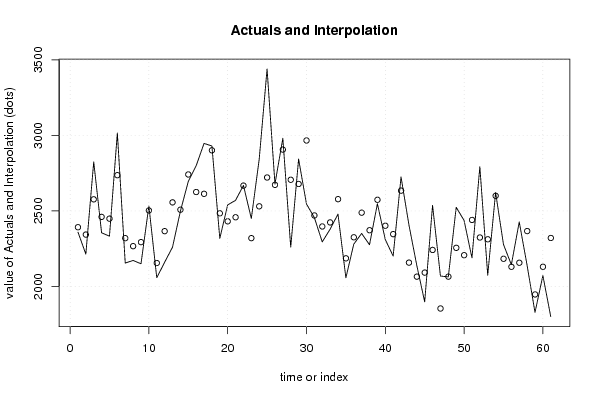
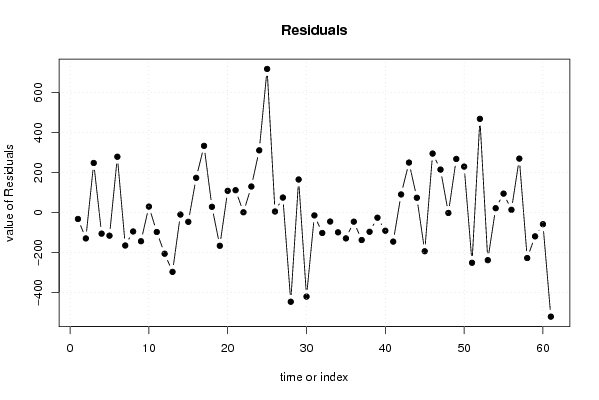
| Multiple Linear Regression - Actuals, Interpolation, and Residuals | |||
| Time or Index | Actuals | Interpolation Forecast | Residuals Prediction Error |
| 1 | 2360 | 2392.09478275783 | -32.0947827578258 |
| 2 | 2214 | 2343.37848499011 | -129.378484990108 |
| 3 | 2825 | 2576.73743639605 | 248.262563603954 |
| 4 | 2355 | 2460.55784879702 | -105.557848797021 |
| 5 | 2333 | 2448.68088268315 | -115.680882683153 |
| 6 | 3016 | 2736.68088268315 | 279.319117316848 |
| 7 | 2155 | 2319.70129508413 | -164.701295084128 |
| 8 | 2172 | 2266.62432897026 | -94.62432897026 |
| 9 | 2150 | 2293.42432897026 | -143.42432897026 |
| 10 | 2533 | 2503.07552781678 | 29.9244721832179 |
| 11 | 2058 | 2155.07541592073 | -97.0754159207257 |
| 12 | 2160 | 2365.94713906428 | -205.947139064279 |
| 13 | 2260 | 2556.69226499291 | -296.692264992910 |
| 14 | 2498 | 2507.97596722518 | -9.97596722518373 |
| 15 | 2695 | 2741.33491863112 | -46.334918631121 |
| 16 | 2799 | 2625.15533103210 | 173.844668967904 |
| 17 | 2947 | 2613.27836491823 | 333.721635081772 |
| 18 | 2930 | 2901.27836491823 | 28.7216350817717 |
| 19 | 2318 | 2484.29877731920 | -166.298777319203 |
| 20 | 2540 | 2431.22181120534 | 108.778188794665 |
| 21 | 2570 | 2458.02181120534 | 111.978188794665 |
| 22 | 2669 | 2667.67301005186 | 1.32698994814249 |
| 23 | 2450 | 2319.6728981558 | 130.327101844199 |
| 24 | 2842 | 2530.54462129935 | 311.455378700645 |
| 25 | 3440 | 2721.28974722798 | 718.710252772015 |
| 26 | 2678 | 2672.57344946026 | 5.42655053974068 |
| 27 | 2981 | 2905.9324008662 | 75.0675991338036 |
| 28 | 2260 | 2706.29157606425 | -446.291576064246 |
| 29 | 2844 | 2678.51723143554 | 165.482768564464 |
| 30 | 2546 | 2966.51723143554 | -420.517231435536 |
| 31 | 2456 | 2470.05075126230 | -14.0507512622963 |
| 32 | 2295 | 2397.10206200487 | -102.102062004875 |
| 33 | 2379 | 2423.90206200488 | -44.9020620048750 |
| 34 | 2479 | 2577.91243604945 | -98.912436049447 |
| 35 | 2057 | 2186.19453323757 | -129.194533237573 |
| 36 | 2280 | 2325.52805306433 | -45.5280530643336 |
| 37 | 2351 | 2488.45276659199 | -137.452766591988 |
| 38 | 2276 | 2372.17261013618 | -96.172610136181 |
| 39 | 2548 | 2573.73680451243 | -25.7368045124324 |
| 40 | 2311 | 2401.91639211146 | -90.9163921114575 |
| 41 | 2201 | 2346.32163508177 | -145.321635081772 |
| 42 | 2725 | 2634.32163508177 | 90.6783649182282 |
| 43 | 2408 | 2157.72687805209 | 250.273121947914 |
| 44 | 2139 | 2064.90646565111 | 74.093534348889 |
| 45 | 1898 | 2091.70646565111 | -193.706465651111 |
| 46 | 2537 | 2241.74249506697 | 295.257504933028 |
| 47 | 2069 | 1853.99893688381 | 215.001063116191 |
| 48 | 2063 | 2064.87066002736 | -1.87066002736259 |
| 49 | 2524 | 2255.61578595599 | 268.384214044008 |
| 50 | 2437 | 2206.89948818827 | 230.100511811733 |
| 51 | 2189 | 2440.25843959420 | -251.258439594204 |
| 52 | 2793 | 2324.07885199518 | 468.921148004821 |
| 53 | 2074 | 2312.20188588131 | -238.201885881311 |
| 54 | 2622 | 2600.20188588131 | 21.7981141186885 |
| 55 | 2278 | 2183.22229828229 | 94.7777017177136 |
| 56 | 2144 | 2130.14533216842 | 13.8546678315815 |
| 57 | 2427 | 2156.94533216842 | 270.054667831581 |
| 58 | 2139 | 2366.59653101494 | -227.596531014941 |
| 59 | 1828 | 1947.05821580209 | -119.058215802092 |
| 60 | 2072 | 2130.10952654467 | -58.10952654467 |
| 61 | 1800 | 2320.8546524733 | -520.8546524733 |
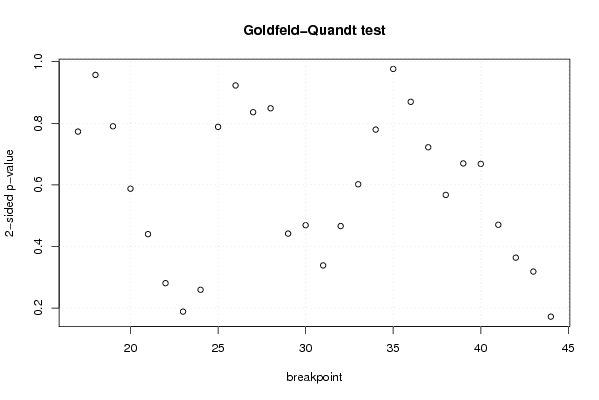
| Goldfeld-Quandt test for Heteroskedasticity | |||
| p-values | Alternative Hypothesis | ||
| breakpoint index | greater | 2-sided | less |
| 17 | 0.613502739050481 | 0.772994521899038 | 0.386497260949519 |
| 18 | 0.521476708883348 | 0.957046582233305 | 0.478523291116652 |
| 19 | 0.3950987812497 | 0.7901975624994 | 0.6049012187503 |
| 20 | 0.293785755094465 | 0.587571510188929 | 0.706214244905535 |
| 21 | 0.220018748901669 | 0.440037497803339 | 0.77998125109833 |
| 22 | 0.140409218817058 | 0.280818437634115 | 0.859590781182942 |
| 23 | 0.0942655454993997 | 0.188531090998799 | 0.9057344545006 |
| 24 | 0.129717823218669 | 0.259435646437338 | 0.87028217678133 |
| 25 | 0.605875059336117 | 0.788249881327765 | 0.394124940663883 |
| 26 | 0.538583705024501 | 0.922832589950997 | 0.461416294975499 |
| 27 | 0.582057131553342 | 0.835885736893316 | 0.417942868446658 |
| 28 | 0.575651762317718 | 0.848696475364563 | 0.424348237682282 |
| 29 | 0.779126471480211 | 0.441747057039578 | 0.220873528519789 |
| 30 | 0.765456711305048 | 0.469086577389904 | 0.234543288694952 |
| 31 | 0.830746708353578 | 0.338506583292844 | 0.169253291646422 |
| 32 | 0.766864673498232 | 0.466270653003537 | 0.233135326501768 |
| 33 | 0.699038363742738 | 0.601923272514525 | 0.300961636257263 |
| 34 | 0.610263975214537 | 0.779472049570926 | 0.389736024785463 |
| 35 | 0.511815861349589 | 0.976368277300823 | 0.488184138650411 |
| 36 | 0.434811043222344 | 0.869622086444689 | 0.565188956777656 |
| 37 | 0.361029466058470 | 0.722058932116941 | 0.63897053394153 |
| 38 | 0.283712620104940 | 0.567425240209879 | 0.71628737989506 |
| 39 | 0.334815597174628 | 0.669631194349256 | 0.665184402825372 |
| 40 | 0.334059736432856 | 0.668119472865712 | 0.665940263567144 |
| 41 | 0.235209337936339 | 0.470418675872677 | 0.764790662063661 |
| 42 | 0.181864112472554 | 0.363728224945108 | 0.818135887527446 |
| 43 | 0.159252960820254 | 0.318505921640508 | 0.840747039179746 |
| 44 | 0.0860757802891491 | 0.172151560578298 | 0.91392421971085 |
| Meta Analysis of Goldfeld-Quandt test for Heteroskedasticity | |||
| Description | # significant tests | % significant tests | OK/NOK |
| 1% type I error level | 0 | 0 | OK |
| 5% type I error level | 0 | 0 | OK |
| 10% type I error level | 0 | 0 | OK |