| Multiple Linear Regression - Estimated Regression Equation |
| USDOLLAR[t] = + 0.105597037179138 + 0.00941197428820186Amerikaanse_inflatie[t] + 1.20596116767540`Y[t-1]`[t] -0.527201466526525`Y[t-2]`[t] + 0.547813323376132`Y[t-3]`[t] -0.388942635999796`Y[t-4]`[t] + 0.0293145636322456M1[t] -0.00111634037128101M2[t] + 0.0413735451661571M3[t] + 0.0121472277427398M4[t] + 0.0212072164688286M5[t] + 0.0097722538432314M6[t] -0.0136301901705398M7[t] + 0.0219708478339727M8[t] -0.00996368572382476M9[t] + 0.0239631461363912M10[t] + 0.0182904283986546M11[t] + 0.000324299601614479t + e[t] |
| Multiple Linear Regression - Ordinary Least Squares | |||||
| Variable | Parameter | S.D. | T-STAT H0: parameter = 0 | 2-tail p-value | 1-tail p-value |
| (Intercept) | 0.105597037179138 | 0.049654 | 2.1267 | 0.040181 | 0.020091 |
| Amerikaanse_inflatie | 0.00941197428820186 | 0.01381 | 0.6815 | 0.499782 | 0.249891 |
| `Y[t-1]` | 1.20596116767540 | 0.183309 | 6.5788 | 0 | 0 |
| `Y[t-2]` | -0.527201466526525 | 0.247678 | -2.1286 | 0.040012 | 0.020006 |
| `Y[t-3]` | 0.547813323376132 | 0.238998 | 2.2921 | 0.027685 | 0.013843 |
| `Y[t-4]` | -0.388942635999796 | 0.151709 | -2.5637 | 0.014552 | 0.007276 |
| M1 | 0.0293145636322456 | 0.021012 | 1.3952 | 0.171286 | 0.085643 |
| M2 | -0.00111634037128101 | 0.021164 | -0.0527 | 0.958217 | 0.479109 |
| M3 | 0.0413735451661571 | 0.021036 | 1.9668 | 0.056745 | 0.028372 |
| M4 | 0.0121472277427398 | 0.021818 | 0.5568 | 0.581042 | 0.290521 |
| M5 | 0.0212072164688286 | 0.02116 | 1.0022 | 0.322739 | 0.16137 |
| M6 | 0.0097722538432314 | 0.021568 | 0.4531 | 0.653129 | 0.326565 |
| M7 | -0.0136301901705398 | 0.021231 | -0.642 | 0.524832 | 0.262416 |
| M8 | 0.0219708478339727 | 0.022859 | 0.9611 | 0.342726 | 0.171363 |
| M9 | -0.00996368572382476 | 0.023219 | -0.4291 | 0.670327 | 0.335163 |
| M10 | 0.0239631461363912 | 0.022911 | 1.0459 | 0.302391 | 0.151196 |
| M11 | 0.0182904283986546 | 0.022231 | 0.8227 | 0.415924 | 0.207962 |
| t | 0.000324299601614479 | 0.000282 | 1.1515 | 0.256916 | 0.128458 |
| Multiple Linear Regression - Regression Statistics | |
| Multiple R | 0.94880027255588 |
| R-squared | 0.900221957202111 |
| Adjusted R-squared | 0.85437799159227 |
| F-TEST (value) | 19.6366510886849 |
| F-TEST (DF numerator) | 17 |
| F-TEST (DF denominator) | 37 |
| p-value | 1.49324996812084e-13 |
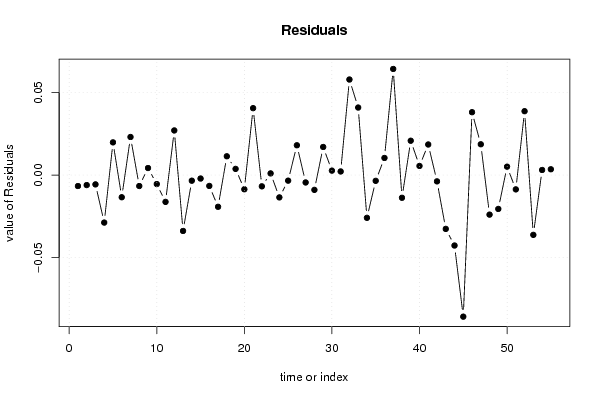
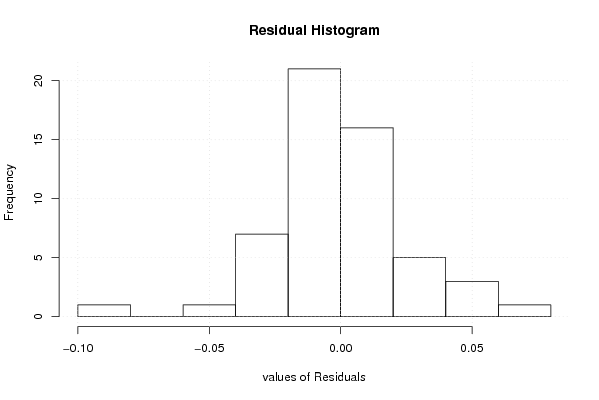
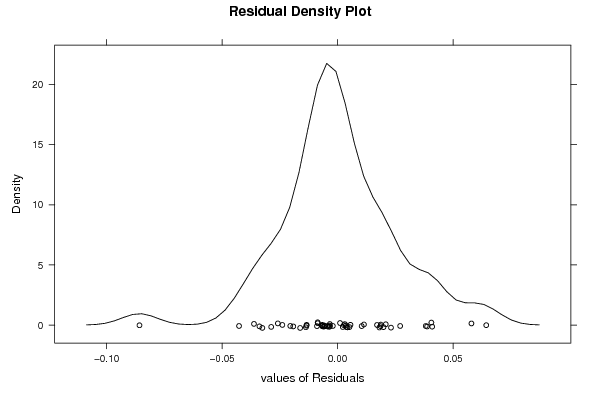
| Multiple Linear Regression - Residual Statistics | |
| Residual Standard Deviation | 0.0305246824388129 |
| Sum Squared Residuals | 0.0344749808056438 |
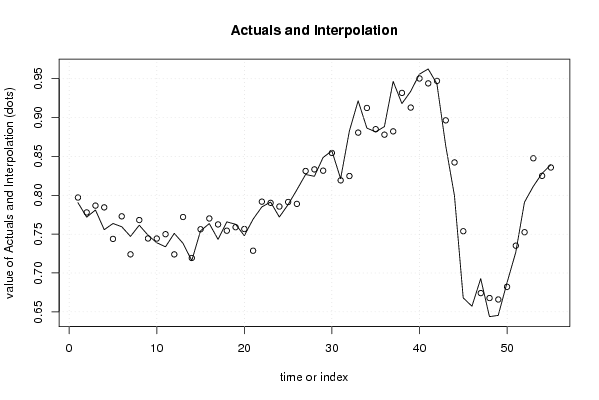
| Multiple Linear Regression - Actuals, Interpolation, and Residuals | |||
| Time or Index | Actuals | Interpolation Forecast | Residuals Prediction Error |
| 1 | 0.7905 | 0.79712299239437 | -0.00662299239437012 |
| 2 | 0.7719 | 0.777946421441421 | -0.00604642144142124 |
| 3 | 0.7811 | 0.786729018034817 | -0.00562901803481656 |
| 4 | 0.7557 | 0.784461318183687 | -0.0287613181836867 |
| 5 | 0.7637 | 0.743860913783656 | 0.0198390862163442 |
| 6 | 0.7595 | 0.772919651688219 | -0.0134196516882189 |
| 7 | 0.7471 | 0.724007325403481 | 0.0230926745965185 |
| 8 | 0.7615 | 0.768137141975872 | -0.00663714197587215 |
| 9 | 0.7487 | 0.74441980692445 | 0.00428019307554969 |
| 10 | 0.7389 | 0.744328176998905 | -0.00542817699890496 |
| 11 | 0.7337 | 0.749933933683564 | -0.0162339336835641 |
| 12 | 0.751 | 0.723944841133322 | 0.0270551588666775 |
| 13 | 0.7382 | 0.772045128350074 | -0.0338451283500743 |
| 14 | 0.7159 | 0.71928584161107 | -0.00338584161107040 |
| 15 | 0.7542 | 0.756278535970568 | -0.00207853597056763 |
| 16 | 0.7636 | 0.770159497314745 | -0.00655949731474485 |
| 17 | 0.7433 | 0.76250903565132 | -0.0192090356513203 |
| 18 | 0.7658 | 0.754411694569875 | 0.0113883054301251 |
| 19 | 0.7627 | 0.75893338581886 | 0.00376661418113985 |
| 20 | 0.748 | 0.756603717086188 | -0.00860371708618804 |
| 21 | 0.7692 | 0.728641503109469 | 0.0405584968905306 |
| 22 | 0.785 | 0.791801929764523 | -0.00680192976452251 |
| 23 | 0.7913 | 0.790269837694587 | 0.00103016230541267 |
| 24 | 0.772 | 0.785504857569513 | -0.0135048575695132 |
| 25 | 0.788 | 0.79135722109776 | -0.00335722109775968 |
| 26 | 0.807 | 0.788930463502756 | 0.0180695364972439 |
| 27 | 0.8268 | 0.831260684911889 | -0.00446068491188936 |
| 28 | 0.8244 | 0.833347966055096 | -0.00894796605509596 |
| 29 | 0.8487 | 0.83166468675651 | 0.0170353132434903 |
| 30 | 0.8572 | 0.854486837602672 | 0.00271316239732783 |
| 31 | 0.8214 | 0.819192537058665 | 0.00220746294133468 |
| 32 | 0.8827 | 0.82478629407322 | 0.057913705926781 |
| 33 | 0.9216 | 0.880672152779527 | 0.0409278472204730 |
| 34 | 0.8865 | 0.912388358570235 | -0.0258883585702349 |
| 35 | 0.8816 | 0.885072227619392 | -0.0034722276193915 |
| 36 | 0.8884 | 0.878007080980017 | 0.0103929190199829 |
| 37 | 0.9466 | 0.882283376034397 | 0.0643166239656029 |
| 38 | 0.918 | 0.931741681406962 | -0.0137416814069616 |
| 39 | 0.9337 | 0.912876683150589 | 0.0208233168494111 |
| 40 | 0.9559 | 0.950348918563324 | 0.00555108143667627 |
| 41 | 0.9626 | 0.94405641603773 | 0.0185435839622705 |
| 42 | 0.9434 | 0.947192089912107 | -0.00379208991210688 |
| 43 | 0.8639 | 0.896498612726762 | -0.0325986127267623 |
| 44 | 0.7996 | 0.842272846864721 | -0.0426728468647208 |
| 45 | 0.668 | 0.753766537186553 | -0.0857665371865532 |
| 46 | 0.6572 | 0.619081534666338 | 0.0381184653336624 |
| 47 | 0.6928 | 0.674124001002457 | 0.0186759989975429 |
| 48 | 0.6438 | 0.667743220317147 | -0.0239432203171471 |
| 49 | 0.6454 | 0.665891282123399 | -0.0204912821233989 |
| 50 | 0.6873 | 0.68219559203779 | 0.00510440796220938 |
| 51 | 0.7265 | 0.735155077932138 | -0.0086550779321376 |
| 52 | 0.7912 | 0.752482299883149 | 0.0387177001168513 |
| 53 | 0.8114 | 0.847608947770785 | -0.0362089477707847 |
| 54 | 0.8281 | 0.824989726227127 | 0.00311027377287283 |
| 55 | 0.8393 | 0.83576813899223 | 0.0035318610077692 |
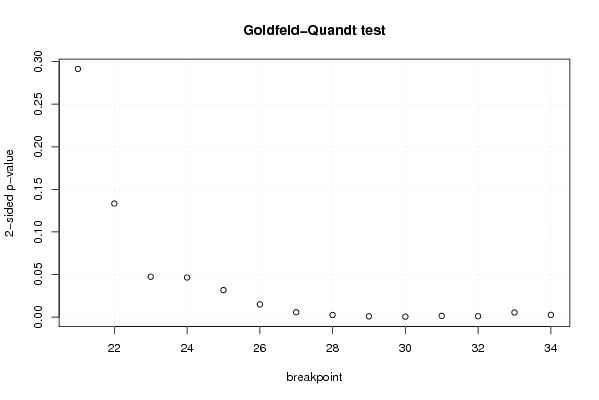
| Goldfeld-Quandt test for Heteroskedasticity | |||
| p-values | Alternative Hypothesis | ||
| breakpoint index | greater | 2-sided | less |
| 21 | 0.145730276264427 | 0.291460552528853 | 0.854269723735573 |
| 22 | 0.0666558641426012 | 0.133311728285202 | 0.933344135857399 |
| 23 | 0.0236722145265902 | 0.0473444290531805 | 0.97632778547341 |
| 24 | 0.0232310826196132 | 0.0464621652392265 | 0.976768917380387 |
| 25 | 0.0158342423218833 | 0.0316684846437665 | 0.984165757678117 |
| 26 | 0.00744278463504582 | 0.0148855692700916 | 0.992557215364954 |
| 27 | 0.0028250229230559 | 0.0056500458461118 | 0.997174977076944 |
| 28 | 0.00122212352569661 | 0.00244424705139322 | 0.998777876474303 |
| 29 | 0.000403525439058238 | 0.000807050878116476 | 0.999596474560942 |
| 30 | 0.000234483543839377 | 0.000468967087678754 | 0.99976551645616 |
| 31 | 0.000697188006406072 | 0.00139437601281214 | 0.999302811993594 |
| 32 | 0.000490859058266538 | 0.000981718116533076 | 0.999509140941733 |
| 33 | 0.0026897377436839 | 0.0053794754873678 | 0.997310262256316 |
| 34 | 0.00126699205251235 | 0.00253398410502471 | 0.998733007947488 |
| Meta Analysis of Goldfeld-Quandt test for Heteroskedasticity | |||
| Description | # significant tests | % significant tests | OK/NOK |
| 1% type I error level | 8 | 0.571428571428571 | NOK |
| 5% type I error level | 12 | 0.857142857142857 | NOK |
| 10% type I error level | 12 | 0.857142857142857 | NOK |