| Multiple Linear Regression - Estimated Regression Equation |
| manwerk[t] = + 43.1129876094284 -0.379210799699017infl[t] + e[t] |
| Multiple Linear Regression - Ordinary Least Squares | |||||
| Variable | Parameter | S.D. | T-STAT H0: parameter = 0 | 2-tail p-value | 1-tail p-value |
| (Intercept) | 43.1129876094284 | 2.107179 | 20.46 | 0 | 0 |
| infl | -0.379210799699017 | 0.020694 | -18.3247 | 0 | 0 |
| Multiple Linear Regression - Regression Statistics | |
| Multiple R | 0.923425815020273 |
| R-squared | 0.852715235845855 |
| Adjusted R-squared | 0.850175843360438 |
| F-TEST (value) | 335.794974878042 |
| F-TEST (DF numerator) | 1 |
| F-TEST (DF denominator) | 58 |
| p-value | 0 |
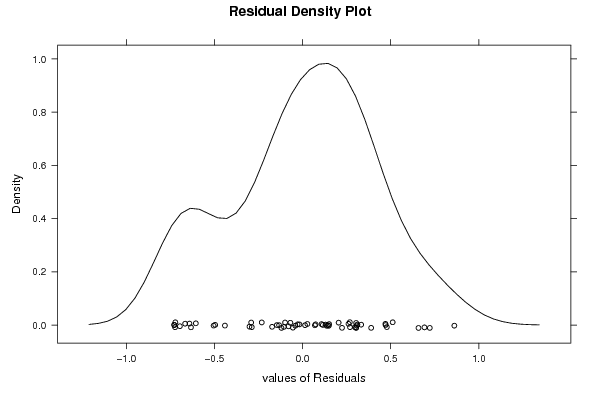
| Multiple Linear Regression - Residual Statistics | |
| Residual Standard Deviation | 0.409023021958564 |
| Sum Squared Residuals | 9.70339028454272 |
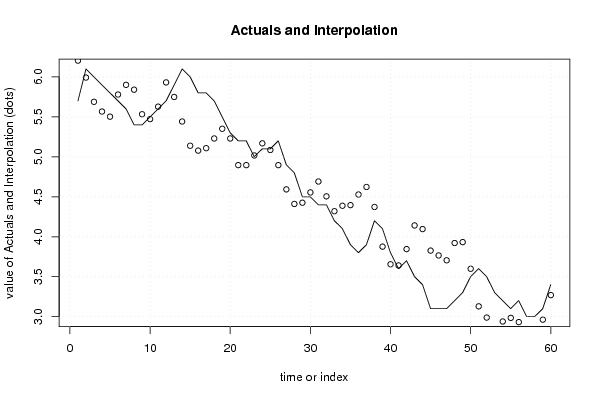
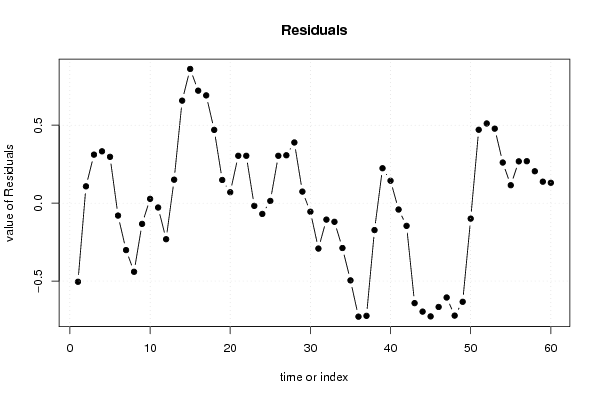
| Multiple Linear Regression - Actuals, Interpolation, and Residuals | |||
| Time or Index | Actuals | Interpolation Forecast | Residuals Prediction Error |
| 1 | 5.7 | 6.20440047472313 | -0.50440047472313 |
| 2 | 6.1 | 5.99204242689168 | 0.107957573108319 |
| 3 | 6 | 5.68867378713247 | 0.311326212867535 |
| 4 | 5.9 | 5.56732633122878 | 0.332673668771223 |
| 5 | 5.8 | 5.50286049527994 | 0.297139504720056 |
| 6 | 5.7 | 5.77968437906023 | -0.0796843790602275 |
| 7 | 5.6 | 5.90103183496392 | -0.301031834963916 |
| 8 | 5.4 | 5.84035810701207 | -0.440358107012069 |
| 9 | 5.4 | 5.53319735925587 | -0.133197359255870 |
| 10 | 5.5 | 5.47252363130402 | 0.0274763686959769 |
| 11 | 5.6 | 5.62800005918062 | -0.0280000591806245 |
| 12 | 5.7 | 5.93136869893984 | -0.231368698939836 |
| 13 | 5.9 | 5.74934751508431 | 0.150652484915694 |
| 14 | 6.1 | 5.4421867673281 | 0.657813232671897 |
| 15 | 6 | 5.13881812756889 | 0.86118187243111 |
| 16 | 5.8 | 5.07814439961705 | 0.721855600382951 |
| 17 | 5.8 | 5.10848126359297 | 0.69151873640703 |
| 18 | 5.7 | 5.22982871949665 | 0.470171280503348 |
| 19 | 5.5 | 5.35117617540034 | 0.148823824599660 |
| 20 | 5.3 | 5.22982871949665 | 0.0701712805033476 |
| 21 | 5.2 | 4.89612321576152 | 0.303876784238481 |
| 22 | 5.2 | 4.89612321576152 | 0.303876784238481 |
| 23 | 5 | 5.01747067166521 | -0.0174706716652073 |
| 24 | 5.1 | 5.16915499154481 | -0.0691549915448111 |
| 25 | 5.1 | 5.08572861561103 | 0.0142713843889721 |
| 26 | 5.2 | 4.89612321576152 | 0.303876784238481 |
| 27 | 4.9 | 4.59275457600231 | 0.307245423997694 |
| 28 | 4.8 | 4.41073339214678 | 0.389266607853223 |
| 29 | 4.5 | 4.42590182413474 | 0.0740981758652598 |
| 30 | 4.5 | 4.5548334960324 | -0.0548334960324018 |
| 31 | 4.4 | 4.69134938392405 | -0.291349383924053 |
| 32 | 4.4 | 4.50553609207153 | -0.105536092071531 |
| 33 | 4.2 | 4.31972280021902 | -0.119722800219015 |
| 34 | 4.1 | 4.38798074416484 | -0.287980744164836 |
| 35 | 3.9 | 4.39556496015882 | -0.495564960158820 |
| 36 | 3.8 | 4.52828874005347 | -0.728288740053473 |
| 37 | 3.9 | 4.62309143997823 | -0.723091439978228 |
| 38 | 4.2 | 4.37281231217688 | -0.172812312176877 |
| 39 | 4.1 | 3.87604616457116 | 0.223953835428835 |
| 40 | 3.8 | 3.65610390074574 | 0.143896099254264 |
| 41 | 3.6 | 3.64093546875777 | -0.0409354687577725 |
| 42 | 3.7 | 3.84570930059524 | -0.145709300595244 |
| 43 | 3.5 | 4.14149372436048 | -0.641493724360478 |
| 44 | 3.4 | 4.09598842839659 | -0.695988428396594 |
| 45 | 3.1 | 3.82674876061029 | -0.726748760610294 |
| 46 | 3.1 | 3.76607503265845 | -0.666075032658447 |
| 47 | 3.1 | 3.70540130470661 | -0.605401304706606 |
| 48 | 3.2 | 3.92155146053505 | -0.721551460535048 |
| 49 | 3.3 | 3.93292778452602 | -0.63292778452602 |
| 50 | 3.5 | 3.59922228079088 | -0.099222280790881 |
| 51 | 3.6 | 3.1290008891641 | 0.470999110835898 |
| 52 | 3.5 | 2.98869289327546 | 0.511307106724536 |
| 53 | 3.3 | 2.8218401414079 | 0.478159858592102 |
| 54 | 3.2 | 2.93939548931459 | 0.260604510685407 |
| 55 | 3.1 | 2.98490078527848 | 0.115099214721523 |
| 56 | 3.2 | 2.93181127332061 | 0.268188726679385 |
| 57 | 3 | 2.73082954948014 | 0.269170450519864 |
| 58 | 3 | 2.79529538542897 | 0.204704614571031 |
| 59 | 3.1 | 2.96214813729654 | 0.137851862703465 |
| 60 | 3.4 | 3.26930888505274 | 0.13069111494726 |
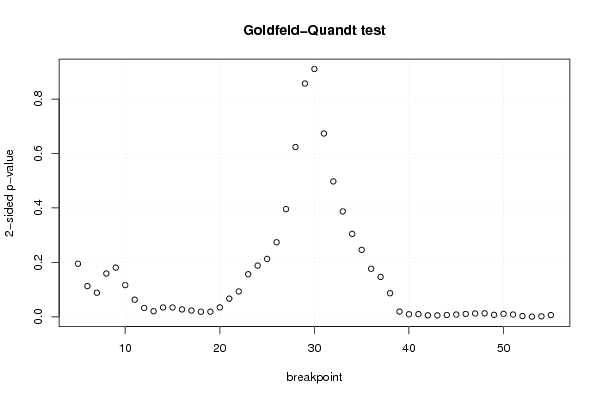
| Goldfeld-Quandt test for Heteroskedasticity | |||
| p-values | Alternative Hypothesis | ||
| breakpoint index | greater | 2-sided | less |
| 5 | 0.0974700490702477 | 0.194940098140495 | 0.902529950929752 |
| 6 | 0.0563382891130237 | 0.112676578226047 | 0.943661710886976 |
| 7 | 0.044176119191087 | 0.088352238382174 | 0.955823880808913 |
| 8 | 0.0794825989228437 | 0.158965197845687 | 0.920517401077156 |
| 9 | 0.090292776651715 | 0.18058555330343 | 0.909707223348285 |
| 10 | 0.0581163918236122 | 0.116232783647224 | 0.941883608176388 |
| 11 | 0.0313494490127587 | 0.0626988980255175 | 0.968650550987241 |
| 12 | 0.0161693269674729 | 0.0323386539349459 | 0.983830673032527 |
| 13 | 0.0101370329166275 | 0.0202740658332550 | 0.989862967083373 |
| 14 | 0.0170157191228554 | 0.0340314382457107 | 0.982984280877145 |
| 15 | 0.0170474110582815 | 0.0340948221165631 | 0.982952588941719 |
| 16 | 0.0134382482033007 | 0.0268764964066013 | 0.9865617517967 |
| 17 | 0.0114814547290039 | 0.0229629094580078 | 0.988518545270996 |
| 18 | 0.00925893545894472 | 0.0185178709178894 | 0.990741064541055 |
| 19 | 0.00924181651810485 | 0.0184836330362097 | 0.990758183481895 |
| 20 | 0.0172189615919080 | 0.0344379231838161 | 0.982781038408092 |
| 21 | 0.0332615925408983 | 0.0665231850817967 | 0.966738407459102 |
| 22 | 0.0464504731231995 | 0.092900946246399 | 0.9535495268768 |
| 23 | 0.0781254730441641 | 0.156250946088328 | 0.921874526955836 |
| 24 | 0.094008646149719 | 0.188017292299438 | 0.905991353850281 |
| 25 | 0.106324859354815 | 0.212649718709631 | 0.893675140645185 |
| 26 | 0.136920964074502 | 0.273841928149005 | 0.863079035925498 |
| 27 | 0.197809917372259 | 0.395619834744519 | 0.80219008262774 |
| 28 | 0.311940480734322 | 0.623880961468645 | 0.688059519265678 |
| 29 | 0.428713867498248 | 0.857427734996497 | 0.571286132501752 |
| 30 | 0.544521496020952 | 0.910957007958095 | 0.455478503979048 |
| 31 | 0.663161129429969 | 0.673677741140061 | 0.336838870570031 |
| 32 | 0.751214301621983 | 0.497571396756035 | 0.248785698378017 |
| 33 | 0.806394578808072 | 0.387210842383857 | 0.193605421191928 |
| 34 | 0.847688302553229 | 0.304623394893542 | 0.152311697446771 |
| 35 | 0.877008879672268 | 0.245982240655465 | 0.122991120327732 |
| 36 | 0.91180476596221 | 0.17639046807558 | 0.08819523403779 |
| 37 | 0.926765088627906 | 0.146469822744187 | 0.0732349113720936 |
| 38 | 0.956768084408935 | 0.0864638311821304 | 0.0432319155910652 |
| 39 | 0.990496296684215 | 0.0190074066315695 | 0.00950370331578473 |
| 40 | 0.995481506794828 | 0.0090369864103435 | 0.00451849320517175 |
| 41 | 0.995196935296117 | 0.00960612940776617 | 0.00480306470388309 |
| 42 | 0.997373169245076 | 0.00525366150984763 | 0.00262683075492381 |
| 43 | 0.997401345830624 | 0.00519730833875126 | 0.00259865416937563 |
| 44 | 0.996727184382569 | 0.00654563123486241 | 0.00327281561743121 |
| 45 | 0.995949331181618 | 0.00810133763676381 | 0.00405066881838191 |
| 46 | 0.994880214462363 | 0.0102395710752734 | 0.00511978553763672 |
| 47 | 0.994014320943856 | 0.0119713581122881 | 0.00598567905614403 |
| 48 | 0.993753065964297 | 0.0124938680714062 | 0.00624693403570309 |
| 49 | 0.996467693712179 | 0.00706461257564273 | 0.00353230628782136 |
| 50 | 0.994737679002852 | 0.0105246419942961 | 0.00526232099714807 |
| 51 | 0.99588274806502 | 0.00823450386996051 | 0.00411725193498025 |
| 52 | 0.99878963295695 | 0.00242073408609925 | 0.00121036704304963 |
| 53 | 0.999824347112119 | 0.000351305775762188 | 0.000175652887881094 |
| 54 | 0.999262427128483 | 0.00147514574303307 | 0.000737572871516535 |
| 55 | 0.996990606891134 | 0.0060187862177323 | 0.00300939310886615 |
| Meta Analysis of Goldfeld-Quandt test for Heteroskedasticity | |||
| Description | # significant tests | % significant tests | OK/NOK |
| 1% type I error level | 12 | 0.235294117647059 | NOK |
| 5% type I error level | 26 | 0.509803921568627 | NOK |
| 10% type I error level | 31 | 0.607843137254902 | NOK |