| Multiple Linear Regression - Estimated Regression Equation |
| Y[t] = + 2543.65104195461 -332.852461340271X[t] -0.00897260626492228Y1[t] + 0.189452813460899Y2[t] + 0.0589636885733872Y3[t] -0.103950946153406Y4[t] + 254.931163373105M1[t] + 180.446464753134M2[t] + 295.839564571899M3[t] + 207.577948072379M4[t] + 175.647916374566M5[t] + 448.898639026695M6[t] + 55.4442951055209M7[t] -82.8238967667418M8[t] -2.92881928519086M9[t] + 260.561703653976M10[t] -149.418332236016M11[t] + 11.1347397110506t + e[t] |
| Multiple Linear Regression - Ordinary Least Squares | |||||
| Variable | Parameter | S.D. | T-STAT H0: parameter = 0 | 2-tail p-value | 1-tail p-value |
| (Intercept) | 2543.65104195461 | 1051.899372 | 2.4182 | 0.019909 | 0.009954 |
| X | -332.852461340271 | 191.479044 | -1.7383 | 0.089311 | 0.044655 |
| Y1 | -0.00897260626492228 | 0.165852 | -0.0541 | 0.957106 | 0.478553 |
| Y2 | 0.189452813460899 | 0.167123 | 1.1336 | 0.263238 | 0.131619 |
| Y3 | 0.0589636885733872 | 0.166855 | 0.3534 | 0.725528 | 0.362764 |
| Y4 | -0.103950946153406 | 0.164072 | -0.6336 | 0.529718 | 0.264859 |
| M1 | 254.931163373105 | 171.545617 | 1.4861 | 0.144553 | 0.072276 |
| M2 | 180.446464753134 | 188.337934 | 0.9581 | 0.343369 | 0.171684 |
| M3 | 295.839564571899 | 172.475163 | 1.7153 | 0.093497 | 0.046748 |
| M4 | 207.577948072379 | 190.803704 | 1.0879 | 0.282694 | 0.141347 |
| M5 | 175.647916374566 | 187.713706 | 0.9357 | 0.354642 | 0.177321 |
| M6 | 448.898639026695 | 182.079982 | 2.4654 | 0.017754 | 0.008877 |
| M7 | 55.4442951055209 | 208.18079 | 0.2663 | 0.79126 | 0.39563 |
| M8 | -82.8238967667418 | 179.470854 | -0.4615 | 0.646774 | 0.323387 |
| M9 | -2.92881928519086 | 183.373895 | -0.016 | 0.987331 | 0.493665 |
| M10 | 260.561703653976 | 185.982212 | 1.401 | 0.168389 | 0.084195 |
| M11 | -149.418332236016 | 173.915755 | -0.8591 | 0.395027 | 0.197513 |
| t | 11.1347397110506 | 8.573994 | 1.2987 | 0.200981 | 0.10049 |
| Multiple Linear Regression - Regression Statistics | |
| Multiple R | 0.741783509030645 |
| R-squared | 0.550242774269817 |
| Adjusted R-squared | 0.372431778050907 |
| F-TEST (value) | 3.09453737941152 |
| F-TEST (DF numerator) | 17 |
| F-TEST (DF denominator) | 43 |
| p-value | 0.00139595311085983 |
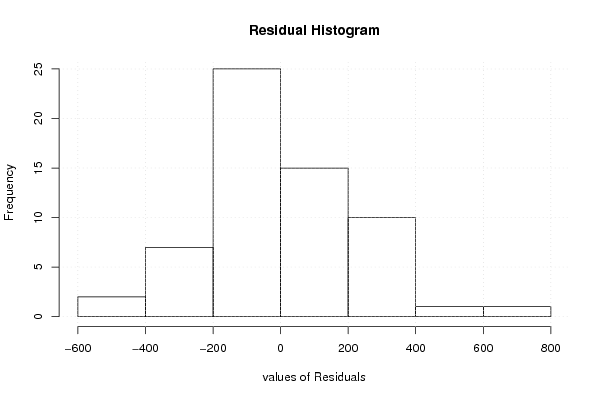
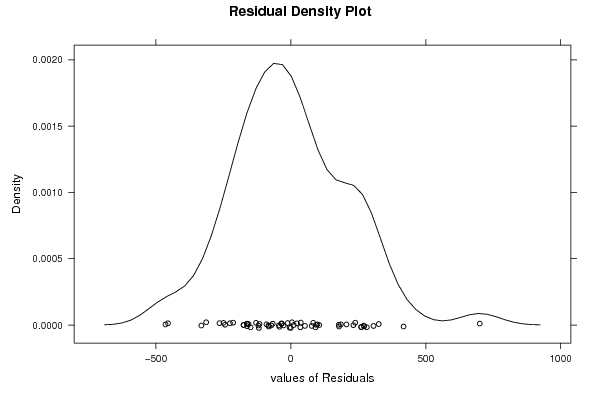
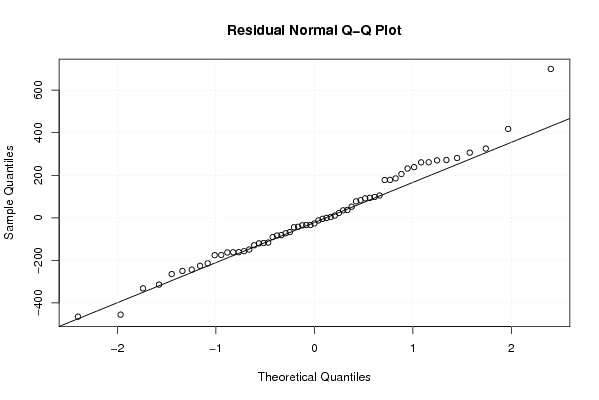
| Multiple Linear Regression - Residual Statistics | |
| Residual Standard Deviation | 252.423589587147 |
| Sum Squared Residuals | 2739859.74894261 |
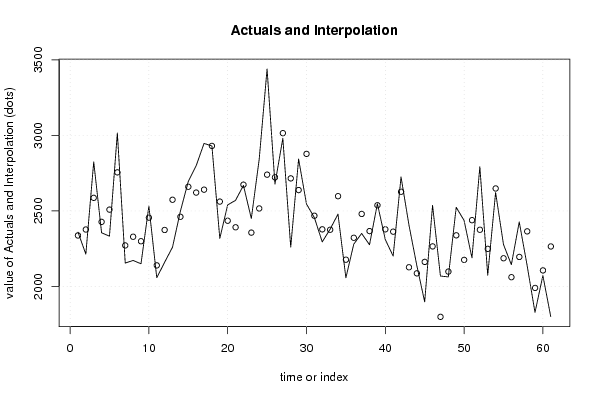
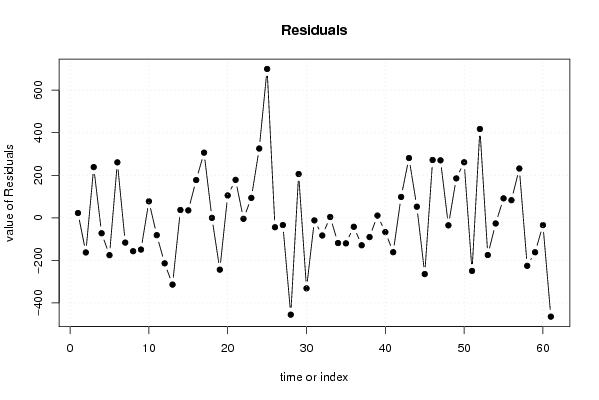
| Multiple Linear Regression - Actuals, Interpolation, and Residuals | |||
| Time or Index | Actuals | Interpolation Forecast | Residuals Prediction Error |
| 1 | 2360 | 2337.46838271003 | 22.5316172899689 |
| 2 | 2214 | 2376.85233343769 | -162.852333437686 |
| 3 | 2825 | 2586.60552248833 | 238.394477511670 |
| 4 | 2355 | 2427.6614525981 | -72.661452598102 |
| 5 | 2333 | 2508.56281805648 | -175.562818056482 |
| 6 | 3016 | 2755.30650728760 | 260.693492712397 |
| 7 | 2155 | 2271.46368937317 | -116.463689373175 |
| 8 | 2172 | 2329.01166634334 | -157.011666343342 |
| 9 | 2150 | 2299.32919695060 | -149.329196950604 |
| 10 | 2533 | 2455.60632268302 | 77.3936773169778 |
| 11 | 2058 | 2139.66070375231 | -81.6607037523058 |
| 12 | 2160 | 2373.97182399751 | -213.971823997512 |
| 13 | 2260 | 2574.0024483877 | -314.002448387701 |
| 14 | 2498 | 2461.25845137619 | 36.7415486238139 |
| 15 | 2695 | 2659.98708761839 | 35.0129123816067 |
| 16 | 2799 | 2621.47574934912 | 177.52425065088 |
| 17 | 2947 | 2640.70777382773 | 306.292226172271 |
| 18 | 2930 | 2930.34390452808 | -0.343904528079557 |
| 19 | 2318 | 2561.86973823608 | -243.869738236084 |
| 20 | 2540 | 2434.92255078908 | 105.077449210923 |
| 21 | 2570 | 2391.62820481634 | 178.371795183657 |
| 22 | 2669 | 2673.72420254463 | -4.72420254462778 |
| 23 | 2450 | 2356.38212065846 | 93.6178793415375 |
| 24 | 2842 | 2516.34782252132 | 325.652177478679 |
| 25 | 3440 | 2740.12517458585 | 699.874825414146 |
| 26 | 2678 | 2722.47090854042 | -44.4709085404226 |
| 27 | 2981 | 3015.00767962209 | -34.0076796220907 |
| 28 | 2260 | 2715.41155727144 | -455.411557271438 |
| 29 | 2844 | 2638.08262193407 | 205.917378065931 |
| 30 | 2546 | 2877.70922233986 | -331.709222339856 |
| 31 | 2456 | 2468.12344944390 | -12.1234494438971 |
| 32 | 2295 | 2378.08139667163 | -83.0813966716299 |
| 33 | 2379 | 2375.22651851294 | 3.77348148705526 |
| 34 | 2479 | 2597.66748466418 | -118.667484664176 |
| 35 | 2057 | 2177.08762473552 | -120.087624735520 |
| 36 | 2280 | 2322.14802700209 | -42.1480270020869 |
| 37 | 2351 | 2480.1287686953 | -129.128768695299 |
| 38 | 2276 | 2366.52704252219 | -90.5270425221932 |
| 39 | 2548 | 2537.56698219898 | 10.4330178010174 |
| 40 | 2311 | 2378.19661180575 | -67.1966118057504 |
| 41 | 2201 | 2362.64242819781 | -161.642428197814 |
| 42 | 2725 | 2626.94900471337 | 98.0509952866323 |
| 43 | 2408 | 2126.91102459307 | 281.088975406933 |
| 44 | 2139 | 2086.76028523260 | 52.2397147673964 |
| 45 | 1898 | 2162.47876853269 | -264.478768532693 |
| 46 | 2537 | 2265.21396820859 | 271.786031791413 |
| 47 | 2069 | 1798.78302015264 | 270.216979847355 |
| 48 | 2063 | 2098.34817520229 | -35.348175202289 |
| 49 | 2524 | 2338.5339722457 | 185.466027754302 |
| 50 | 2437 | 2175.89126412351 | 261.108735876489 |
| 51 | 2189 | 2438.83272807220 | -249.832728072203 |
| 52 | 2793 | 2375.25462897559 | 417.745371024411 |
| 53 | 2074 | 2249.00435798391 | -175.004357983906 |
| 54 | 2622 | 2648.69136113109 | -26.6913611310936 |
| 55 | 2278 | 2186.63209835378 | 91.3679016462235 |
| 56 | 2144 | 2061.22410096335 | 82.7758990366518 |
| 57 | 2427 | 2195.33731118741 | 231.662688812585 |
| 58 | 2139 | 2364.78802189959 | -225.788021899587 |
| 59 | 1828 | 1990.08653070107 | -162.086530701067 |
| 60 | 2072 | 2106.18415127679 | -34.1841512767911 |
| 61 | 1800 | 2264.74125337542 | -464.741253375417 |
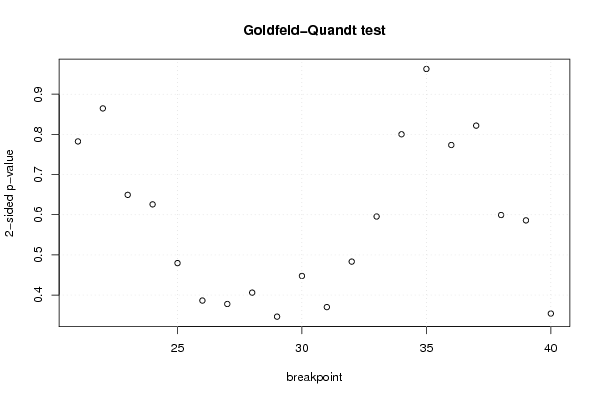
| Goldfeld-Quandt test for Heteroskedasticity | |||
| p-values | Alternative Hypothesis | ||
| breakpoint index | greater | 2-sided | less |
| 21 | 0.608757415731514 | 0.782485168536971 | 0.391242584268486 |
| 22 | 0.432382726713473 | 0.864765453426947 | 0.567617273286527 |
| 23 | 0.324743188724523 | 0.649486377449046 | 0.675256811275477 |
| 24 | 0.312903034628554 | 0.625806069257107 | 0.687096965371446 |
| 25 | 0.760206269838633 | 0.479587460322735 | 0.239793730161367 |
| 26 | 0.806833021858897 | 0.386333956282207 | 0.193166978141103 |
| 27 | 0.811105919085628 | 0.377788161828745 | 0.188894080914372 |
| 28 | 0.79697111329699 | 0.406057773406022 | 0.203028886703011 |
| 29 | 0.82686922478783 | 0.346261550424341 | 0.173130775212170 |
| 30 | 0.776232269593693 | 0.447535460812613 | 0.223767730406307 |
| 31 | 0.814978286170295 | 0.370043427659411 | 0.185021713829705 |
| 32 | 0.758341593175053 | 0.483316813649893 | 0.241658406824947 |
| 33 | 0.702234442790076 | 0.595531114419847 | 0.297765557209924 |
| 34 | 0.599846067733304 | 0.800307864533393 | 0.400153932266696 |
| 35 | 0.481474571703589 | 0.962949143407179 | 0.518525428296411 |
| 36 | 0.386779402140268 | 0.773558804280536 | 0.613220597859732 |
| 37 | 0.410912875273493 | 0.821825750546986 | 0.589087124726507 |
| 38 | 0.299626517385597 | 0.599253034771194 | 0.700373482614403 |
| 39 | 0.292959089074945 | 0.585918178149891 | 0.707040910925055 |
| 40 | 0.177005057880631 | 0.354010115761261 | 0.82299494211937 |
| Meta Analysis of Goldfeld-Quandt test for Heteroskedasticity | |||
| Description | # significant tests | % significant tests | OK/NOK |
| 1% type I error level | 0 | 0 | OK |
| 5% type I error level | 0 | 0 | OK |
| 10% type I error level | 0 | 0 | OK |