| Multiple Linear Regression - Estimated Regression Equation |
| Y[t] = + 8.89484092155787 + 0.000137136588041943X[t] + 0.173170369354539M1[t] + 0.164695099652587M2[t] -0.0237856555128910M3[t] -0.292263667946609M4[t] -0.500766364966173M5[t] -0.54924437739989M6[t] + 0.242285838361675M7[t] + 0.373835253245565M8[t] + 0.265373697202413M9[t] -0.00309334430426069M10[t] -0.171535701225087M11[t] -0.031532958493326t + e[t] |
| Multiple Linear Regression - Ordinary Least Squares | |||||
| Variable | Parameter | S.D. | T-STAT H0: parameter = 0 | 2-tail p-value | 1-tail p-value |
| (Intercept) | 8.89484092155787 | 0.255544 | 34.8074 | 0 | 0 |
| X | 0.000137136588041943 | 0.063784 | 0.0022 | 0.998294 | 0.499147 |
| M1 | 0.173170369354539 | 0.297778 | 0.5815 | 0.563715 | 0.281857 |
| M2 | 0.164695099652587 | 0.297391 | 0.5538 | 0.582398 | 0.291199 |
| M3 | -0.0237856555128910 | 0.297183 | -0.08 | 0.936555 | 0.468278 |
| M4 | -0.292263667946609 | 0.296986 | -0.9841 | 0.330214 | 0.165107 |
| M5 | -0.500766364966173 | 0.297925 | -1.6808 | 0.099571 | 0.049786 |
| M6 | -0.54924437739989 | 0.297965 | -1.8433 | 0.07173 | 0.035865 |
| M7 | 0.242285838361675 | 0.297596 | 0.8141 | 0.419758 | 0.209879 |
| M8 | 0.373835253245565 | 0.29639 | 1.2613 | 0.213562 | 0.106781 |
| M9 | 0.265373697202413 | 0.295865 | 0.8969 | 0.37442 | 0.18721 |
| M10 | -0.00309334430426069 | 0.295605 | -0.0105 | 0.991696 | 0.495848 |
| M11 | -0.171535701225087 | 0.295041 | -0.5814 | 0.563812 | 0.281906 |
| t | -0.031532958493326 | 0.004289 | -7.3519 | 0 | 0 |
| Multiple Linear Regression - Regression Statistics | |
| Multiple R | 0.832460976610311 |
| R-squared | 0.692991277578994 |
| Adjusted R-squared | 0.606227942981753 |
| F-TEST (value) | 7.98714434842653 |
| F-TEST (DF numerator) | 13 |
| F-TEST (DF denominator) | 46 |
| p-value | 5.19511160756991e-08 |
| Multiple Linear Regression - Residual Statistics | |
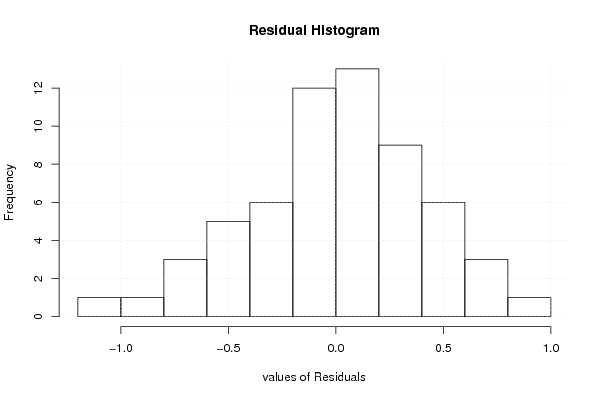
| Residual Standard Deviation | 0.466431076529146 |
| Sum Squared Residuals | 10.0076656609984 |
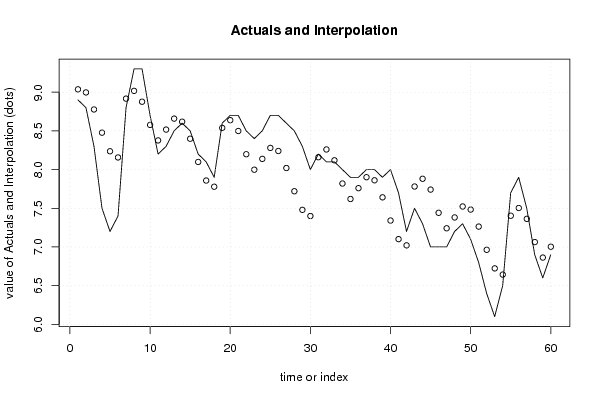
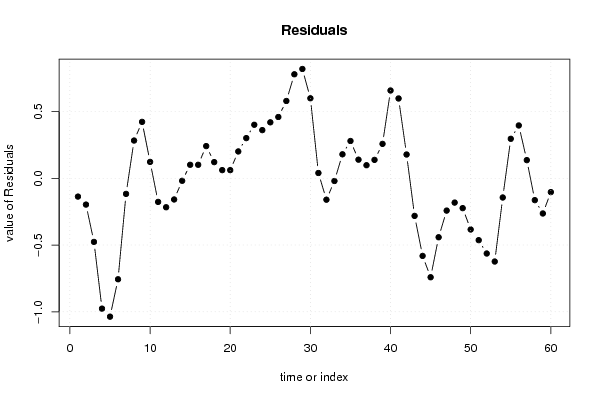
| Multiple Linear Regression - Actuals, Interpolation, and Residuals | |||
| Time or Index | Actuals | Interpolation Forecast | Residuals Prediction Error |
| 1 | 8.9 | 9.03667032364237 | -0.136670323642367 |
| 2 | 8.8 | 8.99663466812946 | -0.196634668129456 |
| 3 | 8.3 | 8.77659352715304 | -0.476593527153044 |
| 4 | 7.5 | 8.47667855183763 | -0.97667855183763 |
| 5 | 7.2 | 8.23673889193637 | -1.03673889193637 |
| 6 | 7.4 | 8.1566730663741 | -0.756673066374107 |
| 7 | 8.8 | 8.91668403730115 | -0.116684037301150 |
| 8 | 9.3 | 9.01668678003291 | 0.283313219967088 |
| 9 | 9.3 | 8.87666483817883 | 0.423335161821176 |
| 10 | 8.7 | 8.57678826110806 | 0.123211738891937 |
| 11 | 8.2 | 8.3767580910587 | -0.176758091058695 |
| 12 | 8.3 | 8.51670597915524 | -0.216705979155237 |
| 13 | 8.5 | 8.65835710367526 | -0.158357103675255 |
| 14 | 8.6 | 8.61839001645639 | -0.0183900164563883 |
| 15 | 8.5 | 8.3984448710916 | 0.101555128908393 |
| 16 | 8.2 | 8.09837904552935 | 0.101620954470652 |
| 17 | 8.1 | 7.85832967635765 | 0.241670323642348 |
| 18 | 7.9 | 7.77837356006583 | 0.121626439934175 |
| 19 | 8.6 | 8.53837081733406 | 0.0616291826659352 |
| 20 | 8.7 | 8.63841470104224 | 0.0615852989577617 |
| 21 | 8.7 | 8.49843390016456 | 0.201566099835436 |
| 22 | 8.5 | 8.19832419089413 | 0.30167580910587 |
| 23 | 8.4 | 7.99836258913878 | 0.401637410861218 |
| 24 | 8.5 | 8.13843390016456 | 0.361566099835436 |
| 25 | 8.7 | 8.28007131102578 | 0.419928688974223 |
| 26 | 8.7 | 8.2400630828305 | 0.4599369171695 |
| 27 | 8.6 | 8.01996708721887 | 0.580032912781129 |
| 28 | 8.5 | 7.72001097092704 | 0.779989029072957 |
| 29 | 8.3 | 7.48000274273176 | 0.81999725726824 |
| 30 | 8 | 7.3999506308283 | 0.600049369171695 |
| 31 | 8.2 | 8.15993417443774 | 0.0400658255622591 |
| 32 | 8.1 | 8.2599369171695 | -0.159936917169501 |
| 33 | 8.1 | 8.1198875479978 | -0.0198875479978061 |
| 34 | 8 | 7.8198601206802 | 0.180139879319803 |
| 35 | 7.9 | 7.61992594624246 | 0.280074053757543 |
| 36 | 7.9 | 7.75994240263302 | 0.140057597366978 |
| 37 | 8 | 7.90152495885902 | 0.0984750411409812 |
| 38 | 8 | 7.86153044432255 | 0.138469555677454 |
| 39 | 7.9 | 7.64151673066374 | 0.258483269336259 |
| 40 | 8 | 7.3415057597367 | 0.658494240263302 |
| 41 | 7.7 | 7.10140153592979 | 0.598598464070213 |
| 42 | 7.2 | 7.02139056500274 | 0.178609434997257 |
| 43 | 7.5 | 7.78138782227098 | -0.281387822270982 |
| 44 | 7.3 | 7.88139056500274 | -0.581390565002743 |
| 45 | 7 | 7.74142347778387 | -0.741423477783873 |
| 46 | 7 | 7.44153318705431 | -0.441533187054307 |
| 47 | 7 | 7.24165386725178 | -0.241653867251783 |
| 48 | 7.2 | 7.38168403730115 | -0.181684037301152 |
| 49 | 7.3 | 7.52337630279758 | -0.223376302797582 |
| 50 | 7.1 | 7.48338178826111 | -0.383381788261109 |
| 51 | 6.8 | 7.26347778387274 | -0.463477783872738 |
| 52 | 6.4 | 6.96342567196928 | -0.563425671969282 |
| 53 | 6.1 | 6.72352715304443 | -0.623527153044434 |
| 54 | 6.5 | 6.64361217772902 | -0.143612177729019 |
| 55 | 7.7 | 7.40362314865606 | 0.296376851343938 |
| 56 | 7.9 | 7.5035710367526 | 0.396428963247394 |
| 57 | 7.5 | 7.36359023587493 | 0.136409764125068 |
| 58 | 6.9 | 7.0634942402633 | -0.163494240263303 |
| 59 | 6.6 | 6.86329950630828 | -0.263299506308284 |
| 60 | 6.9 | 7.00323368074602 | -0.103233680746024 |
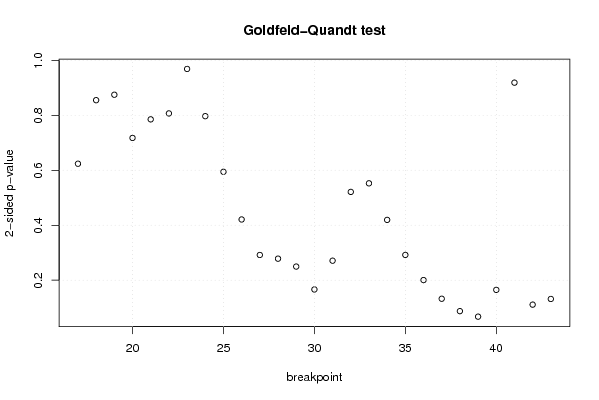
| Goldfeld-Quandt test for Heteroskedasticity | |||
| p-values | Alternative Hypothesis | ||
| breakpoint index | greater | 2-sided | less |
| 17 | 0.688070133470162 | 0.623859733059676 | 0.311929866529838 |
| 18 | 0.572405922469946 | 0.855188155060108 | 0.427594077530054 |
| 19 | 0.562495098404988 | 0.875009803190023 | 0.437504901595012 |
| 20 | 0.641104269302008 | 0.717791461395985 | 0.358895730697992 |
| 21 | 0.607277888991688 | 0.785444222016623 | 0.392722111008312 |
| 22 | 0.59650306443683 | 0.806993871126339 | 0.403496935563170 |
| 23 | 0.484423181635139 | 0.968846363270277 | 0.515576818364861 |
| 24 | 0.398487535553692 | 0.796975071107385 | 0.601512464446308 |
| 25 | 0.297267957390287 | 0.594535914780574 | 0.702732042609713 |
| 26 | 0.210529815800016 | 0.421059631600031 | 0.789470184199984 |
| 27 | 0.145906089205061 | 0.291812178410122 | 0.854093910794939 |
| 28 | 0.139210889518738 | 0.278421779037477 | 0.860789110481262 |
| 29 | 0.124816748630588 | 0.249633497261175 | 0.875183251369412 |
| 30 | 0.0832124738590364 | 0.166424947718073 | 0.916787526140964 |
| 31 | 0.135522197618633 | 0.271044395237266 | 0.864477802381367 |
| 32 | 0.260700427397851 | 0.521400854795701 | 0.73929957260215 |
| 33 | 0.276333078225325 | 0.55266615645065 | 0.723666921774675 |
| 34 | 0.209755043877191 | 0.419510087754383 | 0.790244956122809 |
| 35 | 0.146045670086540 | 0.292091340173081 | 0.85395432991346 |
| 36 | 0.100267645005011 | 0.200535290010023 | 0.899732354994989 |
| 37 | 0.0662616551663278 | 0.132523310332656 | 0.933738344833672 |
| 38 | 0.0437303559548941 | 0.0874607119097882 | 0.956269644045106 |
| 39 | 0.0336901280726572 | 0.0673802561453143 | 0.966309871927343 |
| 40 | 0.0824418524866806 | 0.164883704973361 | 0.91755814751332 |
| 41 | 0.54053215349516 | 0.91893569300968 | 0.45946784650484 |
| 42 | 0.944440499604316 | 0.111119000791368 | 0.0555595003956839 |
| 43 | 0.934142539843172 | 0.131714920313657 | 0.0658574601568284 |
| Meta Analysis of Goldfeld-Quandt test for Heteroskedasticity | |||
| Description | # significant tests | % significant tests | OK/NOK |
| 1% type I error level | 0 | 0 | OK |
| 5% type I error level | 0 | 0 | OK |
| 10% type I error level | 2 | 0.0740740740740741 | OK |