| Multiple Linear Regression - Estimated Regression Equation |
| USDOLLAR[t] = + 0.078110740623702 + 0.0139385911634161Amerikaanse_inflatie[t] + 1.12979723066344`Y[t-1]`[t] -0.264538499966401`Y[t-2]`[t] + 0.0327237110510389M1[t] + 0.0104818715294112M2[t] + 0.0407995808594032M3[t] + 0.0265051646608203M4[t] + 0.0222423674857073M5[t] + 0.0220179199741573M6[t] -0.00472949651591212M7[t] + 0.0249234761846346M8[t] + 0.00314997812565103M9[t] + 0.0173613481476963M10[t] + 0.0278331600231446M11[t] + 0.000283993595009668t + e[t] |
| Multiple Linear Regression - Ordinary Least Squares | |||||
| Variable | Parameter | S.D. | T-STAT H0: parameter = 0 | 2-tail p-value | 1-tail p-value |
| (Intercept) | 0.078110740623702 | 0.049263 | 1.5856 | 0.120907 | 0.060453 |
| Amerikaanse_inflatie | 0.0139385911634161 | 0.013959 | 0.9985 | 0.324179 | 0.162089 |
| `Y[t-1]` | 1.12979723066344 | 0.190769 | 5.9223 | 1e-06 | 0 |
| `Y[t-2]` | -0.264538499966401 | 0.177375 | -1.4914 | 0.1439 | 0.07195 |
| M1 | 0.0327237110510389 | 0.021919 | 1.493 | 0.143492 | 0.071746 |
| M2 | 0.0104818715294112 | 0.021916 | 0.4783 | 0.635127 | 0.317563 |
| M3 | 0.0407995808594032 | 0.0218 | 1.8715 | 0.068788 | 0.034394 |
| M4 | 0.0265051646608203 | 0.022263 | 1.1905 | 0.24103 | 0.120515 |
| M5 | 0.0222423674857073 | 0.021876 | 1.0167 | 0.315539 | 0.15777 |
| M6 | 0.0220179199741573 | 0.02193 | 1.004 | 0.321562 | 0.160781 |
| M7 | -0.00472949651591212 | 0.022003 | -0.215 | 0.830925 | 0.415462 |
| M8 | 0.0249234761846346 | 0.024081 | 1.035 | 0.307048 | 0.153524 |
| M9 | 0.00314997812565103 | 0.02402 | 0.1311 | 0.896339 | 0.448169 |
| M10 | 0.0173613481476963 | 0.023899 | 0.7264 | 0.471911 | 0.235956 |
| M11 | 0.0278331600231446 | 0.023248 | 1.1972 | 0.238445 | 0.119222 |
| t | 0.000283993595009668 | 0.000298 | 0.9524 | 0.346741 | 0.17337 |
| Multiple Linear Regression - Regression Statistics | |
| Multiple R | 0.939006435347887 |
| R-squared | 0.881733085624745 |
| Adjusted R-squared | 0.836245810865032 |
| F-TEST (value) | 19.3841704143083 |
| F-TEST (DF numerator) | 15 |
| F-TEST (DF denominator) | 39 |
| p-value | 1.52988732793347e-13 |
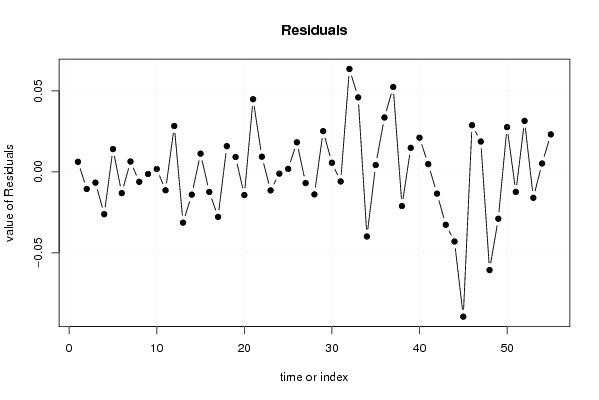
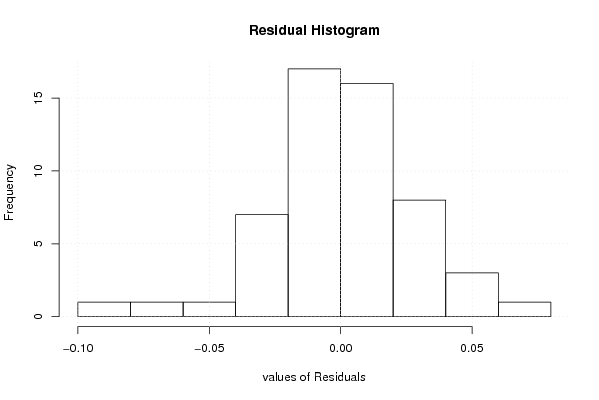
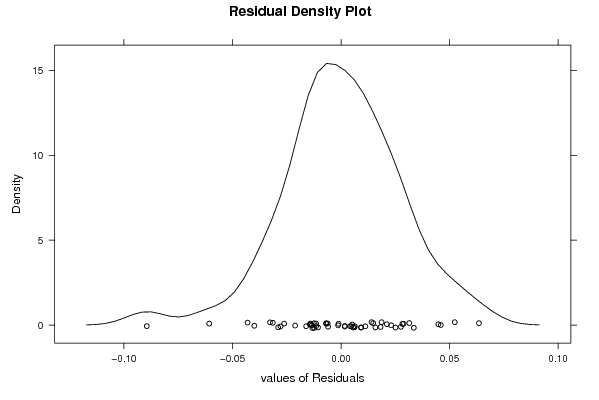
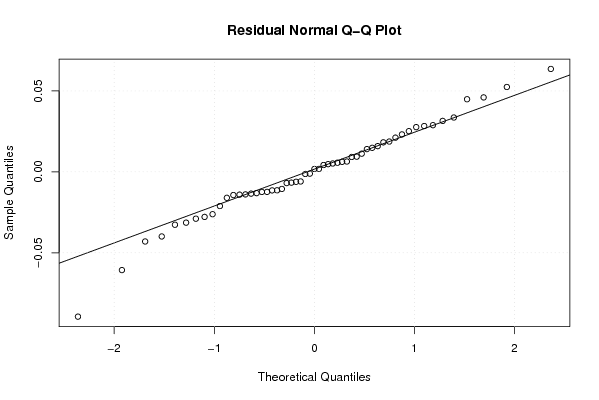
| Multiple Linear Regression - Residual Statistics | |
| Residual Standard Deviation | 0.0323693408415906 |
| Sum Squared Residuals | 0.0408631948342435 |
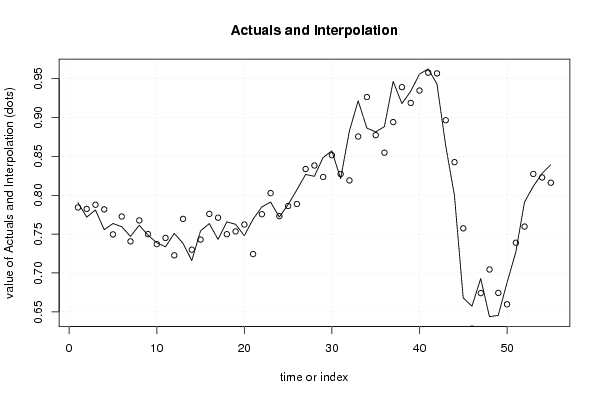
| Multiple Linear Regression - Actuals, Interpolation, and Residuals | |||
| Time or Index | Actuals | Interpolation Forecast | Residuals Prediction Error |
| 1 | 0.7905 | 0.784320708255845 | 0.00617929174415532 |
| 2 | 0.7719 | 0.782480342992086 | -0.0105803429920862 |
| 3 | 0.7811 | 0.787794808986126 | -0.00669480898612576 |
| 4 | 0.7557 | 0.781878746781381 | -0.0261787467813814 |
| 5 | 0.7637 | 0.749654627713563 | 0.0140453722864371 |
| 6 | 0.7595 | 0.7726641425818 | -0.0131641425817995 |
| 7 | 0.7471 | 0.740733122434564 | 0.00636687756543637 |
| 8 | 0.7615 | 0.767668064495778 | -0.00616806449577773 |
| 9 | 0.7487 | 0.750033063902934 | -0.00133306390293407 |
| 10 | 0.7389 | 0.737141829947107 | 0.00175817005289325 |
| 11 | 0.7337 | 0.745118099446155 | -0.0114180994461553 |
| 12 | 0.751 | 0.722719312372108 | 0.0282806876278919 |
| 13 | 0.7382 | 0.769609120770934 | -0.0314091207709344 |
| 14 | 0.7159 | 0.730007213358747 | -0.0141072133587470 |
| 15 | 0.7542 | 0.742982108188549 | 0.0112178918114513 |
| 16 | 0.7636 | 0.77603740080296 | -0.0124374008029603 |
| 17 | 0.7433 | 0.771153007526039 | -0.0278530075260385 |
| 18 | 0.7658 | 0.74993076950288 | 0.0158692304971194 |
| 19 | 0.7627 | 0.753533109106569 | 0.00916689089343125 |
| 20 | 0.748 | 0.762348986934045 | -0.0143489869340451 |
| 21 | 0.7692 | 0.72436066437988 | 0.0448393356201198 |
| 22 | 0.785 | 0.77564502076342 | 0.00935497923658063 |
| 23 | 0.7913 | 0.802769229263443 | -0.0114692292634433 |
| 24 | 0.772 | 0.773126245679026 | -0.00112624567902559 |
| 25 | 0.788 | 0.786216611970153 | 0.00178338802984743 |
| 26 | 0.807 | 0.788779219535189 | 0.0182207804648110 |
| 27 | 0.8268 | 0.83374310406367 | -0.00694310406367003 |
| 28 | 0.8244 | 0.838344846923742 | -0.0139448469237421 |
| 29 | 0.8487 | 0.823573195093375 | 0.025126804906625 |
| 30 | 0.8572 | 0.851582320370241 | 0.00561767962975856 |
| 31 | 0.8214 | 0.827346064187525 | -0.00594606418752503 |
| 32 | 0.8827 | 0.819145631686053 | 0.0635543683139471 |
| 33 | 0.9216 | 0.87563049183772 | 0.0459695081622792 |
| 34 | 0.8865 | 0.926430991245144 | -0.0399309912451441 |
| 35 | 0.8816 | 0.877413659500414 | 0.00418634049958623 |
| 36 | 0.8884 | 0.854854322604393 | 0.0335456773956071 |
| 37 | 0.9466 | 0.894192554747739 | 0.052407445252261 |
| 38 | 0.918 | 0.939145027172606 | -0.0211450271726060 |
| 39 | 0.9337 | 0.918874328408493 | 0.0148256715915067 |
| 40 | 0.9559 | 0.93479513569163 | 0.0211048643083707 |
| 41 | 0.9626 | 0.957863617703522 | 0.00473638229647842 |
| 42 | 0.9434 | 0.956874148073979 | -0.0134741480739792 |
| 43 | 0.8639 | 0.896603775757152 | -0.0327037757571517 |
| 44 | 0.7996 | 0.842637316884124 | -0.0430373168841243 |
| 45 | 0.668 | 0.757475779879465 | -0.089475779879465 |
| 46 | 0.6572 | 0.62838215804433 | 0.0288178419556702 |
| 47 | 0.6928 | 0.674099011789988 | 0.0187009882100123 |
| 48 | 0.6438 | 0.704500119344473 | -0.0607001193444734 |
| 49 | 0.6454 | 0.674361004255329 | -0.0289610042553293 |
| 50 | 0.6873 | 0.659688196941372 | 0.0276118030586283 |
| 51 | 0.7265 | 0.738905650353162 | -0.0124056503531622 |
| 52 | 0.7912 | 0.759743869800287 | 0.0314561301997131 |
| 53 | 0.8114 | 0.827455551963502 | -0.0160555519635019 |
| 54 | 0.8281 | 0.822948619471099 | 0.0051513805289008 |
| 55 | 0.8393 | 0.81618392851419 | 0.0231160714858091 |
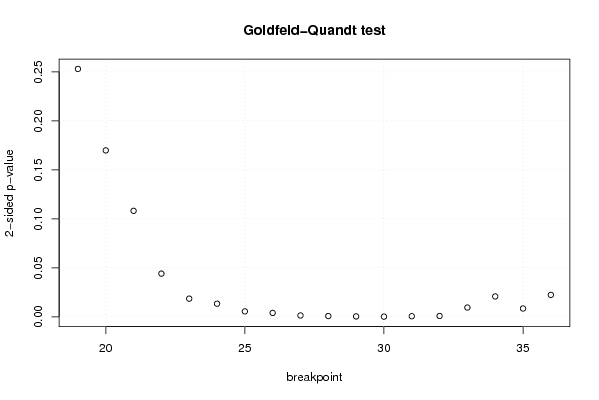
| Goldfeld-Quandt test for Heteroskedasticity | |||
| p-values | Alternative Hypothesis | ||
| breakpoint index | greater | 2-sided | less |
| 19 | 0.126501971539676 | 0.253003943079351 | 0.873498028460324 |
| 20 | 0.0849417189256796 | 0.169883437851359 | 0.91505828107432 |
| 21 | 0.0540909131146054 | 0.108181826229211 | 0.945909086885395 |
| 22 | 0.0220417854745803 | 0.0440835709491606 | 0.97795821452542 |
| 23 | 0.0092702140958118 | 0.0185404281916236 | 0.990729785904188 |
| 24 | 0.00669211979408875 | 0.0133842395881775 | 0.993307880205911 |
| 25 | 0.00275813405331584 | 0.00551626810663169 | 0.997241865946684 |
| 26 | 0.00198498362302671 | 0.00396996724605342 | 0.998015016376973 |
| 27 | 0.000688113100343025 | 0.00137622620068605 | 0.999311886899657 |
| 28 | 0.000375555719633507 | 0.000751111439267015 | 0.999624444280367 |
| 29 | 0.000196507053347839 | 0.000393014106695677 | 0.999803492946652 |
| 30 | 8.023256810656e-05 | 0.00016046513621312 | 0.999919767431893 |
| 31 | 0.000298580571521405 | 0.00059716114304281 | 0.999701419428479 |
| 32 | 0.000432307511843042 | 0.000864615023686085 | 0.999567692488157 |
| 33 | 0.00472423048433067 | 0.00944846096866135 | 0.99527576951567 |
| 34 | 0.0103989454442546 | 0.0207978908885092 | 0.989601054555745 |
| 35 | 0.00423961857140106 | 0.00847923714280212 | 0.9957603814286 |
| 36 | 0.0111835978162174 | 0.0223671956324348 | 0.988816402183783 |
| Meta Analysis of Goldfeld-Quandt test for Heteroskedasticity | |||
| Description | # significant tests | % significant tests | OK/NOK |
| 1% type I error level | 10 | 0.555555555555556 | NOK |
| 5% type I error level | 15 | 0.833333333333333 | NOK |
| 10% type I error level | 15 | 0.833333333333333 | NOK |