| Multiple Linear Regression - Estimated Regression Equation |
| Y(omzet)[t] = -2.97734126813718 + 1.15356403007296`X(prod)`[t] + e[t] |
| Multiple Linear Regression - Ordinary Least Squares | |||||
| Variable | Parameter | S.D. | T-STAT H0: parameter = 0 | 2-tail p-value | 1-tail p-value |
| (Intercept) | -2.97734126813718 | 8.183472 | -0.3638 | 0.717313 | 0.358656 |
| `X(prod)` | 1.15356403007296 | 0.077558 | 14.8737 | 0 | 0 |
| Multiple Linear Regression - Regression Statistics | |
| Multiple R | 0.890102564482754 |
| R-squared | 0.792282575298776 |
| Adjusted R-squared | 0.788701240390134 |
| F-TEST (value) | 221.225491474419 |
| F-TEST (DF numerator) | 1 |
| F-TEST (DF denominator) | 58 |
| p-value | 0 |
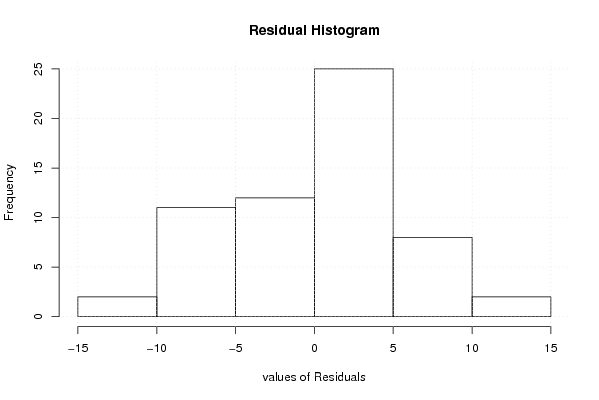
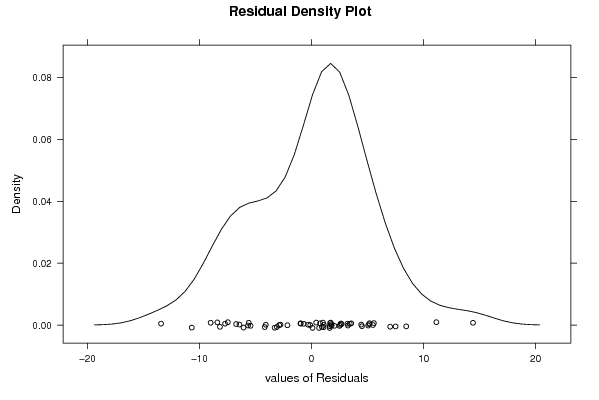
| Multiple Linear Regression - Residual Statistics | |
| Residual Standard Deviation | 5.43221752345103 |
| Sum Squared Residuals | 1711.52125888113 |
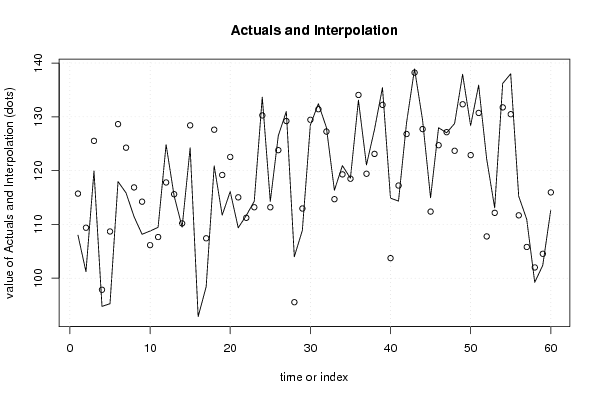
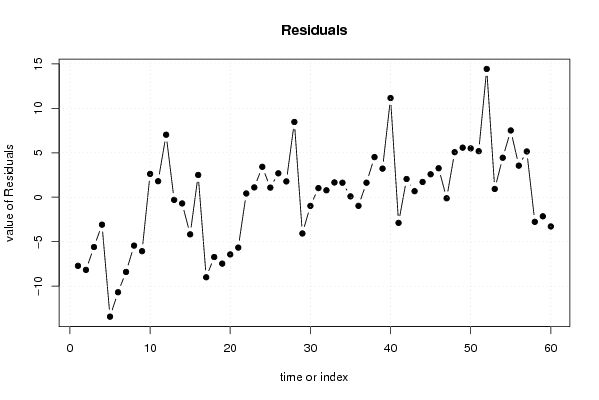
| Multiple Linear Regression - Actuals, Interpolation, and Residuals | |||
| Time or Index | Actuals | Interpolation Forecast | Residuals Prediction Error |
| 1 | 108.01 | 115.724397426371 | -7.71439742637102 |
| 2 | 101.21 | 109.379795260970 | -8.16979526096953 |
| 3 | 119.93 | 125.529691681991 | -5.59969168199106 |
| 4 | 94.76 | 97.8441549602399 | -3.08415496023991 |
| 5 | 95.26 | 108.687656842926 | -13.4276568429258 |
| 6 | 117.96 | 128.644314563188 | -10.6843145631881 |
| 7 | 115.86 | 124.260771248911 | -8.4007712489108 |
| 8 | 111.44 | 116.877961456444 | -5.43796145644384 |
| 9 | 108.16 | 114.224764187276 | -6.064764187276 |
| 10 | 108.77 | 106.149815976765 | 2.62018402323475 |
| 11 | 109.45 | 107.649449215860 | 1.80055078413989 |
| 12 | 124.83 | 117.800812680502 | 7.0291873194978 |
| 13 | 115.31 | 115.609041023364 | -0.299041023363559 |
| 14 | 109.49 | 110.187290082021 | -0.697290082020628 |
| 15 | 124.24 | 128.413601757173 | -4.17360175717349 |
| 16 | 92.85 | 90.3459887647657 | 2.50401123523435 |
| 17 | 98.42 | 107.418736409846 | -8.99873640984552 |
| 18 | 120.88 | 127.606106936122 | -6.72610693612241 |
| 19 | 111.72 | 119.185089516590 | -7.46508951658976 |
| 20 | 116.1 | 122.530425203801 | -6.43042520380136 |
| 21 | 109.37 | 115.032259008327 | -5.66225900832707 |
| 22 | 111.65 | 111.225497709086 | 0.424502290913707 |
| 23 | 114.29 | 113.186556560210 | 1.10344343978966 |
| 24 | 133.68 | 130.259304205290 | 3.42069579470979 |
| 25 | 114.27 | 113.186556560210 | 1.08344343978965 |
| 26 | 126.49 | 123.799345636882 | 2.69065436311837 |
| 27 | 131 | 129.221096578225 | 1.77890342177546 |
| 28 | 104 | 95.537026900094 | 8.46297309990602 |
| 29 | 108.88 | 112.955843754196 | -4.07584375419575 |
| 30 | 128.48 | 129.451809384239 | -0.971809384239152 |
| 31 | 132.44 | 131.412868235363 | 1.02713176463681 |
| 32 | 128.04 | 127.260037727101 | 0.779962272899475 |
| 33 | 116.35 | 114.686189799305 | 1.66381020069480 |
| 34 | 120.93 | 119.300445919597 | 1.62955408040295 |
| 35 | 118.59 | 118.492951098546 | 0.0970489014540293 |
| 36 | 133.1 | 134.066065504531 | -0.966065504531005 |
| 37 | 121.05 | 119.415802322604 | 1.63419767739565 |
| 38 | 127.62 | 123.107207218838 | 4.51279278116217 |
| 39 | 135.44 | 132.220363056414 | 3.21963694358573 |
| 40 | 114.88 | 103.727331513612 | 11.1526684863880 |
| 41 | 114.34 | 117.224030665466 | -2.88403066546572 |
| 42 | 128.85 | 126.798612115071 | 2.05138788492867 |
| 43 | 138.9 | 138.218896012794 | 0.681103987206322 |
| 44 | 129.44 | 127.721463339130 | 1.71853666087030 |
| 45 | 114.96 | 112.379061739159 | 2.58093826084073 |
| 46 | 127.98 | 124.72219686094 | 3.25780313906001 |
| 47 | 127.03 | 127.144681324093 | -0.114681324093209 |
| 48 | 128.75 | 123.683989233874 | 5.06601076612568 |
| 49 | 137.91 | 132.335719459422 | 5.57428054057844 |
| 50 | 128.37 | 122.876494412823 | 5.49350558717677 |
| 51 | 135.9 | 130.720729817319 | 5.17927018268059 |
| 52 | 122.19 | 107.764805618867 | 14.4251943811326 |
| 53 | 113.08 | 112.148348933145 | 0.931651066855332 |
| 54 | 136.2 | 131.758937444385 | 4.44106255561492 |
| 55 | 138 | 130.490017011305 | 7.50998298869519 |
| 56 | 115.24 | 111.686923321115 | 3.55307667888450 |
| 57 | 110.95 | 105.803746767743 | 5.14625323225664 |
| 58 | 99.23 | 101.996985468503 | -2.76698546850257 |
| 59 | 102.39 | 104.534826334663 | -2.14482633466311 |
| 60 | 112.67 | 115.955110232385 | -3.28511023238545 |
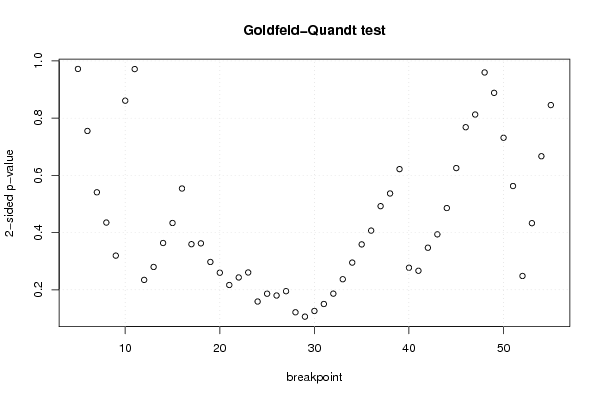
| Goldfeld-Quandt test for Heteroskedasticity | |||
| p-values | Alternative Hypothesis | ||
| breakpoint index | greater | 2-sided | less |
| 5 | 0.485985771177463 | 0.971971542354927 | 0.514014228822536 |
| 6 | 0.377578698406419 | 0.755157396812838 | 0.622421301593581 |
| 7 | 0.270396268695209 | 0.540792537390418 | 0.729603731304791 |
| 8 | 0.217503996674798 | 0.435007993349597 | 0.782496003325202 |
| 9 | 0.159714485110923 | 0.319428970221846 | 0.840285514889077 |
| 10 | 0.430499976119415 | 0.86099995223883 | 0.569500023880585 |
| 11 | 0.514243459977627 | 0.971513080044745 | 0.485756540022373 |
| 12 | 0.88272440394581 | 0.23455119210838 | 0.11727559605419 |
| 13 | 0.860071678969571 | 0.279856642060858 | 0.139928321030429 |
| 14 | 0.81822451274085 | 0.3635509745183 | 0.18177548725915 |
| 15 | 0.78323984358287 | 0.433520312834260 | 0.216760156417130 |
| 16 | 0.722993685985398 | 0.554012628029205 | 0.277006314014602 |
| 17 | 0.820301657979089 | 0.359396684041822 | 0.179698342020911 |
| 18 | 0.818843748305606 | 0.362312503388788 | 0.181156251694394 |
| 19 | 0.85134730928771 | 0.297305381424580 | 0.148652690712290 |
| 20 | 0.870164277501592 | 0.259671444996816 | 0.129835722498408 |
| 21 | 0.891620482484321 | 0.216759035031358 | 0.108379517515679 |
| 22 | 0.878420817846523 | 0.243158364306953 | 0.121579182153477 |
| 23 | 0.869760609562831 | 0.260478780874338 | 0.130239390437169 |
| 24 | 0.92051033569975 | 0.158979328600499 | 0.0794896643002496 |
| 25 | 0.906847512014291 | 0.186304975971418 | 0.093152487985709 |
| 26 | 0.909986706697002 | 0.180026586605996 | 0.0900132933029982 |
| 27 | 0.902415198453317 | 0.195169603093366 | 0.0975848015466832 |
| 28 | 0.939326274995042 | 0.121347450009916 | 0.0606737250049579 |
| 29 | 0.946944979919352 | 0.106110040161296 | 0.0530550200806481 |
| 30 | 0.936967909460527 | 0.126064181078947 | 0.0630320905394735 |
| 31 | 0.92483456543291 | 0.150330869134181 | 0.0751654345670905 |
| 32 | 0.906746890570845 | 0.186506218858309 | 0.0932531094291547 |
| 33 | 0.881502094345205 | 0.236995811309591 | 0.118497905654795 |
| 34 | 0.852452593427764 | 0.295094813144471 | 0.147547406572235 |
| 35 | 0.820645086357496 | 0.358709827285007 | 0.179354913642504 |
| 36 | 0.796543703783883 | 0.406912592432235 | 0.203456296216117 |
| 37 | 0.75384616793346 | 0.492307664133079 | 0.246153832066539 |
| 38 | 0.731645702031237 | 0.536708595937525 | 0.268354297968763 |
| 39 | 0.689099330698226 | 0.621801338603547 | 0.310900669301774 |
| 40 | 0.861478297421781 | 0.277043405156437 | 0.138521702578219 |
| 41 | 0.866728994678978 | 0.266542010642044 | 0.133271005321022 |
| 42 | 0.826477002221042 | 0.347045995557915 | 0.173522997778958 |
| 43 | 0.803121219186886 | 0.393757561626227 | 0.196878780813114 |
| 44 | 0.757134256438812 | 0.485731487122376 | 0.242865743561188 |
| 45 | 0.687257641589552 | 0.625484716820896 | 0.312742358410448 |
| 46 | 0.61584484058893 | 0.76831031882214 | 0.38415515941107 |
| 47 | 0.593689412645424 | 0.812621174709153 | 0.406310587354576 |
| 48 | 0.520146767195745 | 0.95970646560851 | 0.479853232804255 |
| 49 | 0.444200857936661 | 0.888401715873322 | 0.555799142063339 |
| 50 | 0.365709338617382 | 0.731418677234765 | 0.634290661382618 |
| 51 | 0.281372768206726 | 0.562745536413452 | 0.718627231793274 |
| 52 | 0.875835400226306 | 0.248329199547388 | 0.124164599773694 |
| 53 | 0.783558197403234 | 0.432883605193531 | 0.216441802596766 |
| 54 | 0.666578020264437 | 0.666843959471126 | 0.333421979735563 |
| 55 | 0.577128905821282 | 0.845742188357436 | 0.422871094178718 |
| Meta Analysis of Goldfeld-Quandt test for Heteroskedasticity | |||
| Description | # significant tests | % significant tests | OK/NOK |
| 1% type I error level | 0 | 0 | OK |
| 5% type I error level | 0 | 0 | OK |
| 10% type I error level | 0 | 0 | OK |