Free Statistics

of Irreproducible Research!

Author's title

Author*The author of this computation has been verified*
R Software Modulerwasp_multipleregression.wasp
Title produced by softwareMultiple Regression
Date of computationThu, 19 Nov 2009 11:59:06 -0700
Cite this page as followsStatistical Computations at FreeStatistics.org, Office for Research Development and Education, URL https://freestatistics.org/blog/index.php?v=date/2009/Nov/19/t1258657321ryako7a0bcm1mv8.htm/, Retrieved Tue, 23 Apr 2024 15:56:59 +0000
Statistical Computations at FreeStatistics.org, Office for Research Development and Education, URL https://freestatistics.org/blog/index.php?pk=57899, Retrieved Tue, 23 Apr 2024 15:56:59 +0000
QR Codes:

Original text written by user:
IsPrivate?No (this computation is public)
User-defined keywords
Estimated Impact122
Family? (F = Feedback message, R = changed R code, M = changed R Module, P = changed Parameters, D = changed Data)
-     [Multiple Regression] [Q1 The Seatbeltlaw] [2007-11-14 19:27:43] [8cd6641b921d30ebe00b648d1481bba0]
- RMPD  [Multiple Regression] [Seatbelt] [2009-11-12 14:03:14] [b98453cac15ba1066b407e146608df68]
-    D      [Multiple Regression] [workshop7] [2009-11-19 18:59:06] [307139c5e328127f586f26d5bcc435d8] [Current]
Feedback Forum

Post a new message
Dataseries X:
5.4	2.7
5.4	2.5
5.6	2.2
5.7	2.9
5.8	3.1
5.8	3
5.8	2.8
5.9	2.5
6.1	1.9
6.4	1.9
6.4	1.8
6.3	2
6.2	2.6
6.2	2.5
6.3	2.5
6.4	1.6
6.5	1.4
6.6	0.8
6.6	1.1
6.6	1.3
6.8	1.2
7	1.3
7.2	1.1
7.3	1.3
7.5	1.2
7.6	1.6
7.6	1.7
7.7	1.5
7.7	0.9
7.7	1.5
7.7	1.4
7.6	1.6
7.7	1.7
7.9	1.4
7.9	1.8
7.9	1.7
7.8	1.4
7.6	1.2
7.4	1
7	1.7
7	2.4
7.2	2
7.5	2.1
7.8	2
7.8	1.8
7.7	2.7
7.6	2.3
7.6	1.9
7.5	2
7.5	2.3
7.6	2.8
7.6	2.4
7.9	2.3
7.6	2.7
7.5	2.7
7.5	2.9
7.6	3
7.7	2.2
7.8	2.3
7.9	2.8
7.9	2.8


Summary of computational transaction
Raw Inputview raw input (R code)
Raw Outputview raw output of R engine
Computing time3 seconds
R Server'Gwilym Jenkins' @ 72.249.127.135

\begin{tabular}{lllllllll}
\hline
Summary of computational transaction \tabularnewline
Raw Input & view raw input (R code)  \tabularnewline
Raw Output & view raw output of R engine  \tabularnewline
Computing time & 3 seconds \tabularnewline
R Server & 'Gwilym Jenkins' @ 72.249.127.135 \tabularnewline
\hline
\end{tabular}
%Source: https://freestatistics.org/blog/index.php?pk=57899&T=0

[TABLE]
[ROW][C]Summary of computational transaction[/C][/ROW]
[ROW][C]Raw Input[/C][C]view raw input (R code) [/C][/ROW]
[ROW][C]Raw Output[/C][C]view raw output of R engine [/C][/ROW]
[ROW][C]Computing time[/C][C]3 seconds[/C][/ROW]
[ROW][C]R Server[/C][C]'Gwilym Jenkins' @ 72.249.127.135[/C][/ROW]
[/TABLE]
Source: https://freestatistics.org/blog/index.php?pk=57899&T=0

Globally Unique Identifier (entire table): ba.freestatistics.org/blog/index.php?pk=57899&T=0

As an alternative you can also use a QR Code:  

The GUIDs for individual cells are displayed in the table below:

Summary of computational transaction
Raw Inputview raw input (R code)
Raw Outputview raw output of R engine
Computing time3 seconds
R Server'Gwilym Jenkins' @ 72.249.127.135


Multiple Linear Regression - Estimated Regression Equation
Y[t] = + 7.9572857373039 -0.287260689331907X[t] -0.299250611551363M1[t] -0.517019144853447M2[t] -0.47127393106681M3[t] -0.497019144853447M4[t] -0.397019144853448M5[t] -0.402764358640086M6[t] -0.357019144853448M7[t] -0.285528717280171M8[t] -0.205745213786639M9[t] -0.0714904275732762M10[t] -0.0429808551465527M11[t] + e[t]

\begin{tabular}{lllllllll}
\hline
Multiple Linear Regression - Estimated Regression Equation \tabularnewline
Y[t] =  +  7.9572857373039 -0.287260689331907X[t] -0.299250611551363M1[t] -0.517019144853447M2[t] -0.47127393106681M3[t] -0.497019144853447M4[t] -0.397019144853448M5[t] -0.402764358640086M6[t] -0.357019144853448M7[t] -0.285528717280171M8[t] -0.205745213786639M9[t] -0.0714904275732762M10[t] -0.0429808551465527M11[t]  + e[t] \tabularnewline
\hline
\end{tabular}
%Source: https://freestatistics.org/blog/index.php?pk=57899&T=1

[TABLE]
[ROW][C]Multiple Linear Regression - Estimated Regression Equation[/C][/ROW]
[ROW][C]Y[t] =  +  7.9572857373039 -0.287260689331907X[t] -0.299250611551363M1[t] -0.517019144853447M2[t] -0.47127393106681M3[t] -0.497019144853447M4[t] -0.397019144853448M5[t] -0.402764358640086M6[t] -0.357019144853448M7[t] -0.285528717280171M8[t] -0.205745213786639M9[t] -0.0714904275732762M10[t] -0.0429808551465527M11[t]  + e[t][/C][/ROW]
[/TABLE]
Source: https://freestatistics.org/blog/index.php?pk=57899&T=1

Globally Unique Identifier (entire table): ba.freestatistics.org/blog/index.php?pk=57899&T=1

As an alternative you can also use a QR Code:  

The GUIDs for individual cells are displayed in the table below:

Multiple Linear Regression - Estimated Regression Equation
Y[t] = + 7.9572857373039 -0.287260689331907X[t] -0.299250611551363M1[t] -0.517019144853447M2[t] -0.47127393106681M3[t] -0.497019144853447M4[t] -0.397019144853448M5[t] -0.402764358640086M6[t] -0.357019144853448M7[t] -0.285528717280171M8[t] -0.205745213786639M9[t] -0.0714904275732762M10[t] -0.0429808551465527M11[t] + e[t]


Multiple Linear Regression - Ordinary Least Squares
VariableParameterS.D.T-STATH0: parameter = 02-tail p-value1-tail p-value
(Intercept)7.95728573730390.48616216.367600
X-0.2872606893319070.168598-1.70380.0948820.047441
M1-0.2992506115513630.487923-0.61330.5425630.271282
M2-0.5170191448534470.508847-1.01610.3146950.157347
M3-0.471273931066810.508947-0.9260.359090.179545
M4-0.4970191448534470.508847-0.97680.3335870.166794
M5-0.3970191448534480.508847-0.78020.4390840.219542
M6-0.4027643586400860.508769-0.79160.4324620.216231
M7-0.3570191448534480.508847-0.70160.4863020.243151
M8-0.2855287172801710.50907-0.56090.5774860.288743
M9-0.2057452137866390.508679-0.40450.6876640.343832
M10-0.07149042757327620.508713-0.14050.8888280.444414
M11-0.04298085514655270.508847-0.08450.9330360.466518

\begin{tabular}{lllllllll}
\hline
Multiple Linear Regression - Ordinary Least Squares \tabularnewline
Variable & Parameter & S.D. & T-STATH0: parameter = 0 & 2-tail p-value & 1-tail p-value \tabularnewline
(Intercept) & 7.9572857373039 & 0.486162 & 16.3676 & 0 & 0 \tabularnewline
X & -0.287260689331907 & 0.168598 & -1.7038 & 0.094882 & 0.047441 \tabularnewline
M1 & -0.299250611551363 & 0.487923 & -0.6133 & 0.542563 & 0.271282 \tabularnewline
M2 & -0.517019144853447 & 0.508847 & -1.0161 & 0.314695 & 0.157347 \tabularnewline
M3 & -0.47127393106681 & 0.508947 & -0.926 & 0.35909 & 0.179545 \tabularnewline
M4 & -0.497019144853447 & 0.508847 & -0.9768 & 0.333587 & 0.166794 \tabularnewline
M5 & -0.397019144853448 & 0.508847 & -0.7802 & 0.439084 & 0.219542 \tabularnewline
M6 & -0.402764358640086 & 0.508769 & -0.7916 & 0.432462 & 0.216231 \tabularnewline
M7 & -0.357019144853448 & 0.508847 & -0.7016 & 0.486302 & 0.243151 \tabularnewline
M8 & -0.285528717280171 & 0.50907 & -0.5609 & 0.577486 & 0.288743 \tabularnewline
M9 & -0.205745213786639 & 0.508679 & -0.4045 & 0.687664 & 0.343832 \tabularnewline
M10 & -0.0714904275732762 & 0.508713 & -0.1405 & 0.888828 & 0.444414 \tabularnewline
M11 & -0.0429808551465527 & 0.508847 & -0.0845 & 0.933036 & 0.466518 \tabularnewline
\hline
\end{tabular}
%Source: https://freestatistics.org/blog/index.php?pk=57899&T=2

[TABLE]
[ROW][C]Multiple Linear Regression - Ordinary Least Squares[/C][/ROW]
[ROW][C]Variable[/C][C]Parameter[/C][C]S.D.[/C][C]T-STATH0: parameter = 0[/C][C]2-tail p-value[/C][C]1-tail p-value[/C][/ROW]
[ROW][C](Intercept)[/C][C]7.9572857373039[/C][C]0.486162[/C][C]16.3676[/C][C]0[/C][C]0[/C][/ROW]
[ROW][C]X[/C][C]-0.287260689331907[/C][C]0.168598[/C][C]-1.7038[/C][C]0.094882[/C][C]0.047441[/C][/ROW]
[ROW][C]M1[/C][C]-0.299250611551363[/C][C]0.487923[/C][C]-0.6133[/C][C]0.542563[/C][C]0.271282[/C][/ROW]
[ROW][C]M2[/C][C]-0.517019144853447[/C][C]0.508847[/C][C]-1.0161[/C][C]0.314695[/C][C]0.157347[/C][/ROW]
[ROW][C]M3[/C][C]-0.47127393106681[/C][C]0.508947[/C][C]-0.926[/C][C]0.35909[/C][C]0.179545[/C][/ROW]
[ROW][C]M4[/C][C]-0.497019144853447[/C][C]0.508847[/C][C]-0.9768[/C][C]0.333587[/C][C]0.166794[/C][/ROW]
[ROW][C]M5[/C][C]-0.397019144853448[/C][C]0.508847[/C][C]-0.7802[/C][C]0.439084[/C][C]0.219542[/C][/ROW]
[ROW][C]M6[/C][C]-0.402764358640086[/C][C]0.508769[/C][C]-0.7916[/C][C]0.432462[/C][C]0.216231[/C][/ROW]
[ROW][C]M7[/C][C]-0.357019144853448[/C][C]0.508847[/C][C]-0.7016[/C][C]0.486302[/C][C]0.243151[/C][/ROW]
[ROW][C]M8[/C][C]-0.285528717280171[/C][C]0.50907[/C][C]-0.5609[/C][C]0.577486[/C][C]0.288743[/C][/ROW]
[ROW][C]M9[/C][C]-0.205745213786639[/C][C]0.508679[/C][C]-0.4045[/C][C]0.687664[/C][C]0.343832[/C][/ROW]
[ROW][C]M10[/C][C]-0.0714904275732762[/C][C]0.508713[/C][C]-0.1405[/C][C]0.888828[/C][C]0.444414[/C][/ROW]
[ROW][C]M11[/C][C]-0.0429808551465527[/C][C]0.508847[/C][C]-0.0845[/C][C]0.933036[/C][C]0.466518[/C][/ROW]
[/TABLE]
Source: https://freestatistics.org/blog/index.php?pk=57899&T=2

Globally Unique Identifier (entire table): ba.freestatistics.org/blog/index.php?pk=57899&T=2

As an alternative you can also use a QR Code:  

The GUIDs for individual cells are displayed in the table below:

Multiple Linear Regression - Ordinary Least Squares
VariableParameterS.D.T-STATH0: parameter = 02-tail p-value1-tail p-value
(Intercept)7.95728573730390.48616216.367600
X-0.2872606893319070.168598-1.70380.0948820.047441
M1-0.2992506115513630.487923-0.61330.5425630.271282
M2-0.5170191448534470.508847-1.01610.3146950.157347
M3-0.471273931066810.508947-0.9260.359090.179545
M4-0.4970191448534470.508847-0.97680.3335870.166794
M5-0.3970191448534480.508847-0.78020.4390840.219542
M6-0.4027643586400860.508769-0.79160.4324620.216231
M7-0.3570191448534480.508847-0.70160.4863020.243151
M8-0.2855287172801710.50907-0.56090.5774860.288743
M9-0.2057452137866390.508679-0.40450.6876640.343832
M10-0.07149042757327620.508713-0.14050.8888280.444414
M11-0.04298085514655270.508847-0.08450.9330360.466518


Multiple Linear Regression - Regression Statistics
Multiple R0.336804243371758
R-squared0.113437098353223
Adjusted R-squared-0.108203627058472
F-TEST (value)0.511806204128393
F-TEST (DF numerator)12
F-TEST (DF denominator)48
p-value0.896743475231945
Multiple Linear Regression - Residual Statistics
Residual Standard Deviation0.80427473635461
Sum Squared Residuals31.0491768738373

\begin{tabular}{lllllllll}
\hline
Multiple Linear Regression - Regression Statistics \tabularnewline
Multiple R & 0.336804243371758 \tabularnewline
R-squared & 0.113437098353223 \tabularnewline
Adjusted R-squared & -0.108203627058472 \tabularnewline
F-TEST (value) & 0.511806204128393 \tabularnewline
F-TEST (DF numerator) & 12 \tabularnewline
F-TEST (DF denominator) & 48 \tabularnewline
p-value & 0.896743475231945 \tabularnewline
Multiple Linear Regression - Residual Statistics \tabularnewline
Residual Standard Deviation & 0.80427473635461 \tabularnewline
Sum Squared Residuals & 31.0491768738373 \tabularnewline
\hline
\end{tabular}
%Source: https://freestatistics.org/blog/index.php?pk=57899&T=3

[TABLE]
[ROW][C]Multiple Linear Regression - Regression Statistics[/C][/ROW]
[ROW][C]Multiple R[/C][C]0.336804243371758[/C][/ROW]
[ROW][C]R-squared[/C][C]0.113437098353223[/C][/ROW]
[ROW][C]Adjusted R-squared[/C][C]-0.108203627058472[/C][/ROW]
[ROW][C]F-TEST (value)[/C][C]0.511806204128393[/C][/ROW]
[ROW][C]F-TEST (DF numerator)[/C][C]12[/C][/ROW]
[ROW][C]F-TEST (DF denominator)[/C][C]48[/C][/ROW]
[ROW][C]p-value[/C][C]0.896743475231945[/C][/ROW]
[ROW][C]Multiple Linear Regression - Residual Statistics[/C][/ROW]
[ROW][C]Residual Standard Deviation[/C][C]0.80427473635461[/C][/ROW]
[ROW][C]Sum Squared Residuals[/C][C]31.0491768738373[/C][/ROW]
[/TABLE]
Source: https://freestatistics.org/blog/index.php?pk=57899&T=3

Globally Unique Identifier (entire table): ba.freestatistics.org/blog/index.php?pk=57899&T=3

As an alternative you can also use a QR Code:  

The GUIDs for individual cells are displayed in the table below:

Multiple Linear Regression - Regression Statistics
Multiple R0.336804243371758
R-squared0.113437098353223
Adjusted R-squared-0.108203627058472
F-TEST (value)0.511806204128393
F-TEST (DF numerator)12
F-TEST (DF denominator)48
p-value0.896743475231945
Multiple Linear Regression - Residual Statistics
Residual Standard Deviation0.80427473635461
Sum Squared Residuals31.0491768738373


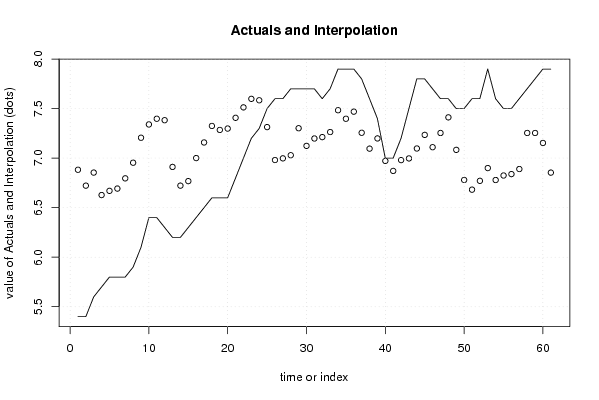
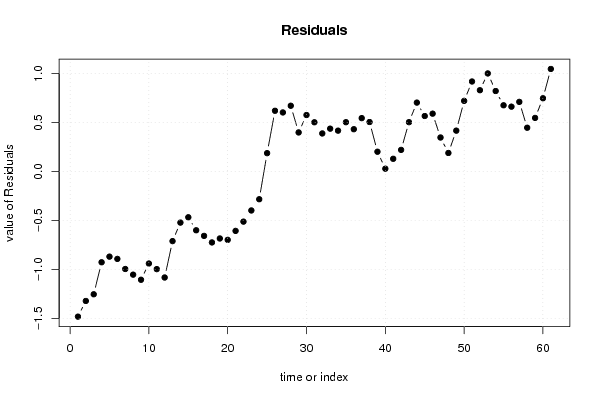
Multiple Linear Regression - Actuals, Interpolation, and Residuals
Time or IndexActualsInterpolationForecastResidualsPrediction Error
15.46.88243126455639-1.48243126455639
25.46.72211486912068-1.32211486912068
35.66.8540382897069-1.25403828970690
45.76.62721059338792-0.92721059338792
55.86.66975845552154-0.869758455521539
65.86.69273931066809-0.892739310668092
75.86.79593666232111-0.995936662321112
85.96.95360529669396-1.05360529669396
96.17.20574521378664-1.10574521378664
106.47.34-0.94
116.47.39723564135991-0.997235641359914
126.37.38276435864009-1.08276435864009
136.26.91115733348958-0.711157333489578
146.26.72211486912068-0.522114869120684
156.36.76786008290732-0.467860082907322
166.47.0006494895194-0.600649489519401
176.57.15810162738578-0.658101627385783
186.67.32471282719829-0.724712827198289
196.67.28427983418536-0.684279834185355
206.67.29831812389225-0.69831812389225
216.87.40682769631897-0.606827696318973
2277.51235641359914-0.512356413599145
237.27.59831812389225-0.39831812389225
247.37.58384684117242-0.283846841172421
257.57.313322298554250.186677701445751
267.66.98064948951940.619350510480598
277.66.997668634372850.602331365627151
287.77.029375558452590.670624441547408
297.77.301731972051740.398268027948263
307.77.123630344665950.576369655334047
317.77.198101627385780.501898372614217
327.67.212139917092680.387860082907322
337.77.263197351653020.436802648346980
347.97.483630344665950.416369655334046
357.97.397235641359910.502764358640086
367.97.468942565439660.431057434560342
377.87.255870160687870.544129839312133
387.67.095553765252160.504446234747835
397.47.198751116905180.201248883094816
4076.971923420586210.0280765794137894
4176.870840938053870.129159061946125
427.26.980.220000000000001
437.56.997019144853450.502980855146553
447.87.097235641359910.702764358640085
457.87.234471282719830.565528717280171
467.77.110191448534470.589808551465526
477.67.253605296693960.346394703306039
487.67.411490427573280.188509572426723
497.57.083513747088720.416486252911278
507.56.779567006987070.720432993012934
517.66.681681876107750.91831812389225
527.66.770840938053880.829159061946125
537.96.899567006987071.00043299301293
547.66.778917517467670.821082482532335
557.56.82466273125430.675337268745697
567.56.83870102096120.661298979038803
577.66.889758455521540.71024154447846
587.77.253821793200430.446178206799573
597.87.253605296693960.546394703306039
607.97.152955807174560.747044192825441
617.96.85370519562321.04629480437680

\begin{tabular}{lllllllll}
\hline
Multiple Linear Regression - Actuals, Interpolation, and Residuals \tabularnewline
Time or Index & Actuals & InterpolationForecast & ResidualsPrediction Error \tabularnewline
1 & 5.4 & 6.88243126455639 & -1.48243126455639 \tabularnewline
2 & 5.4 & 6.72211486912068 & -1.32211486912068 \tabularnewline
3 & 5.6 & 6.8540382897069 & -1.25403828970690 \tabularnewline
4 & 5.7 & 6.62721059338792 & -0.92721059338792 \tabularnewline
5 & 5.8 & 6.66975845552154 & -0.869758455521539 \tabularnewline
6 & 5.8 & 6.69273931066809 & -0.892739310668092 \tabularnewline
7 & 5.8 & 6.79593666232111 & -0.995936662321112 \tabularnewline
8 & 5.9 & 6.95360529669396 & -1.05360529669396 \tabularnewline
9 & 6.1 & 7.20574521378664 & -1.10574521378664 \tabularnewline
10 & 6.4 & 7.34 & -0.94 \tabularnewline
11 & 6.4 & 7.39723564135991 & -0.997235641359914 \tabularnewline
12 & 6.3 & 7.38276435864009 & -1.08276435864009 \tabularnewline
13 & 6.2 & 6.91115733348958 & -0.711157333489578 \tabularnewline
14 & 6.2 & 6.72211486912068 & -0.522114869120684 \tabularnewline
15 & 6.3 & 6.76786008290732 & -0.467860082907322 \tabularnewline
16 & 6.4 & 7.0006494895194 & -0.600649489519401 \tabularnewline
17 & 6.5 & 7.15810162738578 & -0.658101627385783 \tabularnewline
18 & 6.6 & 7.32471282719829 & -0.724712827198289 \tabularnewline
19 & 6.6 & 7.28427983418536 & -0.684279834185355 \tabularnewline
20 & 6.6 & 7.29831812389225 & -0.69831812389225 \tabularnewline
21 & 6.8 & 7.40682769631897 & -0.606827696318973 \tabularnewline
22 & 7 & 7.51235641359914 & -0.512356413599145 \tabularnewline
23 & 7.2 & 7.59831812389225 & -0.39831812389225 \tabularnewline
24 & 7.3 & 7.58384684117242 & -0.283846841172421 \tabularnewline
25 & 7.5 & 7.31332229855425 & 0.186677701445751 \tabularnewline
26 & 7.6 & 6.9806494895194 & 0.619350510480598 \tabularnewline
27 & 7.6 & 6.99766863437285 & 0.602331365627151 \tabularnewline
28 & 7.7 & 7.02937555845259 & 0.670624441547408 \tabularnewline
29 & 7.7 & 7.30173197205174 & 0.398268027948263 \tabularnewline
30 & 7.7 & 7.12363034466595 & 0.576369655334047 \tabularnewline
31 & 7.7 & 7.19810162738578 & 0.501898372614217 \tabularnewline
32 & 7.6 & 7.21213991709268 & 0.387860082907322 \tabularnewline
33 & 7.7 & 7.26319735165302 & 0.436802648346980 \tabularnewline
34 & 7.9 & 7.48363034466595 & 0.416369655334046 \tabularnewline
35 & 7.9 & 7.39723564135991 & 0.502764358640086 \tabularnewline
36 & 7.9 & 7.46894256543966 & 0.431057434560342 \tabularnewline
37 & 7.8 & 7.25587016068787 & 0.544129839312133 \tabularnewline
38 & 7.6 & 7.09555376525216 & 0.504446234747835 \tabularnewline
39 & 7.4 & 7.19875111690518 & 0.201248883094816 \tabularnewline
40 & 7 & 6.97192342058621 & 0.0280765794137894 \tabularnewline
41 & 7 & 6.87084093805387 & 0.129159061946125 \tabularnewline
42 & 7.2 & 6.98 & 0.220000000000001 \tabularnewline
43 & 7.5 & 6.99701914485345 & 0.502980855146553 \tabularnewline
44 & 7.8 & 7.09723564135991 & 0.702764358640085 \tabularnewline
45 & 7.8 & 7.23447128271983 & 0.565528717280171 \tabularnewline
46 & 7.7 & 7.11019144853447 & 0.589808551465526 \tabularnewline
47 & 7.6 & 7.25360529669396 & 0.346394703306039 \tabularnewline
48 & 7.6 & 7.41149042757328 & 0.188509572426723 \tabularnewline
49 & 7.5 & 7.08351374708872 & 0.416486252911278 \tabularnewline
50 & 7.5 & 6.77956700698707 & 0.720432993012934 \tabularnewline
51 & 7.6 & 6.68168187610775 & 0.91831812389225 \tabularnewline
52 & 7.6 & 6.77084093805388 & 0.829159061946125 \tabularnewline
53 & 7.9 & 6.89956700698707 & 1.00043299301293 \tabularnewline
54 & 7.6 & 6.77891751746767 & 0.821082482532335 \tabularnewline
55 & 7.5 & 6.8246627312543 & 0.675337268745697 \tabularnewline
56 & 7.5 & 6.8387010209612 & 0.661298979038803 \tabularnewline
57 & 7.6 & 6.88975845552154 & 0.71024154447846 \tabularnewline
58 & 7.7 & 7.25382179320043 & 0.446178206799573 \tabularnewline
59 & 7.8 & 7.25360529669396 & 0.546394703306039 \tabularnewline
60 & 7.9 & 7.15295580717456 & 0.747044192825441 \tabularnewline
61 & 7.9 & 6.8537051956232 & 1.04629480437680 \tabularnewline
\hline
\end{tabular}
%Source: https://freestatistics.org/blog/index.php?pk=57899&T=4

[TABLE]
[ROW][C]Multiple Linear Regression - Actuals, Interpolation, and Residuals[/C][/ROW]
[ROW][C]Time or Index[/C][C]Actuals[/C][C]InterpolationForecast[/C][C]ResidualsPrediction Error[/C][/ROW]
[ROW][C]1[/C][C]5.4[/C][C]6.88243126455639[/C][C]-1.48243126455639[/C][/ROW]
[ROW][C]2[/C][C]5.4[/C][C]6.72211486912068[/C][C]-1.32211486912068[/C][/ROW]
[ROW][C]3[/C][C]5.6[/C][C]6.8540382897069[/C][C]-1.25403828970690[/C][/ROW]
[ROW][C]4[/C][C]5.7[/C][C]6.62721059338792[/C][C]-0.92721059338792[/C][/ROW]
[ROW][C]5[/C][C]5.8[/C][C]6.66975845552154[/C][C]-0.869758455521539[/C][/ROW]
[ROW][C]6[/C][C]5.8[/C][C]6.69273931066809[/C][C]-0.892739310668092[/C][/ROW]
[ROW][C]7[/C][C]5.8[/C][C]6.79593666232111[/C][C]-0.995936662321112[/C][/ROW]
[ROW][C]8[/C][C]5.9[/C][C]6.95360529669396[/C][C]-1.05360529669396[/C][/ROW]
[ROW][C]9[/C][C]6.1[/C][C]7.20574521378664[/C][C]-1.10574521378664[/C][/ROW]
[ROW][C]10[/C][C]6.4[/C][C]7.34[/C][C]-0.94[/C][/ROW]
[ROW][C]11[/C][C]6.4[/C][C]7.39723564135991[/C][C]-0.997235641359914[/C][/ROW]
[ROW][C]12[/C][C]6.3[/C][C]7.38276435864009[/C][C]-1.08276435864009[/C][/ROW]
[ROW][C]13[/C][C]6.2[/C][C]6.91115733348958[/C][C]-0.711157333489578[/C][/ROW]
[ROW][C]14[/C][C]6.2[/C][C]6.72211486912068[/C][C]-0.522114869120684[/C][/ROW]
[ROW][C]15[/C][C]6.3[/C][C]6.76786008290732[/C][C]-0.467860082907322[/C][/ROW]
[ROW][C]16[/C][C]6.4[/C][C]7.0006494895194[/C][C]-0.600649489519401[/C][/ROW]
[ROW][C]17[/C][C]6.5[/C][C]7.15810162738578[/C][C]-0.658101627385783[/C][/ROW]
[ROW][C]18[/C][C]6.6[/C][C]7.32471282719829[/C][C]-0.724712827198289[/C][/ROW]
[ROW][C]19[/C][C]6.6[/C][C]7.28427983418536[/C][C]-0.684279834185355[/C][/ROW]
[ROW][C]20[/C][C]6.6[/C][C]7.29831812389225[/C][C]-0.69831812389225[/C][/ROW]
[ROW][C]21[/C][C]6.8[/C][C]7.40682769631897[/C][C]-0.606827696318973[/C][/ROW]
[ROW][C]22[/C][C]7[/C][C]7.51235641359914[/C][C]-0.512356413599145[/C][/ROW]
[ROW][C]23[/C][C]7.2[/C][C]7.59831812389225[/C][C]-0.39831812389225[/C][/ROW]
[ROW][C]24[/C][C]7.3[/C][C]7.58384684117242[/C][C]-0.283846841172421[/C][/ROW]
[ROW][C]25[/C][C]7.5[/C][C]7.31332229855425[/C][C]0.186677701445751[/C][/ROW]
[ROW][C]26[/C][C]7.6[/C][C]6.9806494895194[/C][C]0.619350510480598[/C][/ROW]
[ROW][C]27[/C][C]7.6[/C][C]6.99766863437285[/C][C]0.602331365627151[/C][/ROW]
[ROW][C]28[/C][C]7.7[/C][C]7.02937555845259[/C][C]0.670624441547408[/C][/ROW]
[ROW][C]29[/C][C]7.7[/C][C]7.30173197205174[/C][C]0.398268027948263[/C][/ROW]
[ROW][C]30[/C][C]7.7[/C][C]7.12363034466595[/C][C]0.576369655334047[/C][/ROW]
[ROW][C]31[/C][C]7.7[/C][C]7.19810162738578[/C][C]0.501898372614217[/C][/ROW]
[ROW][C]32[/C][C]7.6[/C][C]7.21213991709268[/C][C]0.387860082907322[/C][/ROW]
[ROW][C]33[/C][C]7.7[/C][C]7.26319735165302[/C][C]0.436802648346980[/C][/ROW]
[ROW][C]34[/C][C]7.9[/C][C]7.48363034466595[/C][C]0.416369655334046[/C][/ROW]
[ROW][C]35[/C][C]7.9[/C][C]7.39723564135991[/C][C]0.502764358640086[/C][/ROW]
[ROW][C]36[/C][C]7.9[/C][C]7.46894256543966[/C][C]0.431057434560342[/C][/ROW]
[ROW][C]37[/C][C]7.8[/C][C]7.25587016068787[/C][C]0.544129839312133[/C][/ROW]
[ROW][C]38[/C][C]7.6[/C][C]7.09555376525216[/C][C]0.504446234747835[/C][/ROW]
[ROW][C]39[/C][C]7.4[/C][C]7.19875111690518[/C][C]0.201248883094816[/C][/ROW]
[ROW][C]40[/C][C]7[/C][C]6.97192342058621[/C][C]0.0280765794137894[/C][/ROW]
[ROW][C]41[/C][C]7[/C][C]6.87084093805387[/C][C]0.129159061946125[/C][/ROW]
[ROW][C]42[/C][C]7.2[/C][C]6.98[/C][C]0.220000000000001[/C][/ROW]
[ROW][C]43[/C][C]7.5[/C][C]6.99701914485345[/C][C]0.502980855146553[/C][/ROW]
[ROW][C]44[/C][C]7.8[/C][C]7.09723564135991[/C][C]0.702764358640085[/C][/ROW]
[ROW][C]45[/C][C]7.8[/C][C]7.23447128271983[/C][C]0.565528717280171[/C][/ROW]
[ROW][C]46[/C][C]7.7[/C][C]7.11019144853447[/C][C]0.589808551465526[/C][/ROW]
[ROW][C]47[/C][C]7.6[/C][C]7.25360529669396[/C][C]0.346394703306039[/C][/ROW]
[ROW][C]48[/C][C]7.6[/C][C]7.41149042757328[/C][C]0.188509572426723[/C][/ROW]
[ROW][C]49[/C][C]7.5[/C][C]7.08351374708872[/C][C]0.416486252911278[/C][/ROW]
[ROW][C]50[/C][C]7.5[/C][C]6.77956700698707[/C][C]0.720432993012934[/C][/ROW]
[ROW][C]51[/C][C]7.6[/C][C]6.68168187610775[/C][C]0.91831812389225[/C][/ROW]
[ROW][C]52[/C][C]7.6[/C][C]6.77084093805388[/C][C]0.829159061946125[/C][/ROW]
[ROW][C]53[/C][C]7.9[/C][C]6.89956700698707[/C][C]1.00043299301293[/C][/ROW]
[ROW][C]54[/C][C]7.6[/C][C]6.77891751746767[/C][C]0.821082482532335[/C][/ROW]
[ROW][C]55[/C][C]7.5[/C][C]6.8246627312543[/C][C]0.675337268745697[/C][/ROW]
[ROW][C]56[/C][C]7.5[/C][C]6.8387010209612[/C][C]0.661298979038803[/C][/ROW]
[ROW][C]57[/C][C]7.6[/C][C]6.88975845552154[/C][C]0.71024154447846[/C][/ROW]
[ROW][C]58[/C][C]7.7[/C][C]7.25382179320043[/C][C]0.446178206799573[/C][/ROW]
[ROW][C]59[/C][C]7.8[/C][C]7.25360529669396[/C][C]0.546394703306039[/C][/ROW]
[ROW][C]60[/C][C]7.9[/C][C]7.15295580717456[/C][C]0.747044192825441[/C][/ROW]
[ROW][C]61[/C][C]7.9[/C][C]6.8537051956232[/C][C]1.04629480437680[/C][/ROW]
[/TABLE]
Source: https://freestatistics.org/blog/index.php?pk=57899&T=4

Globally Unique Identifier (entire table): ba.freestatistics.org/blog/index.php?pk=57899&T=4

As an alternative you can also use a QR Code:  

The GUIDs for individual cells are displayed in the table below:

Multiple Linear Regression - Actuals, Interpolation, and Residuals
Time or IndexActualsInterpolationForecastResidualsPrediction Error
15.46.88243126455639-1.48243126455639
25.46.72211486912068-1.32211486912068
35.66.8540382897069-1.25403828970690
45.76.62721059338792-0.92721059338792
55.86.66975845552154-0.869758455521539
65.86.69273931066809-0.892739310668092
75.86.79593666232111-0.995936662321112
85.96.95360529669396-1.05360529669396
96.17.20574521378664-1.10574521378664
106.47.34-0.94
116.47.39723564135991-0.997235641359914
126.37.38276435864009-1.08276435864009
136.26.91115733348958-0.711157333489578
146.26.72211486912068-0.522114869120684
156.36.76786008290732-0.467860082907322
166.47.0006494895194-0.600649489519401
176.57.15810162738578-0.658101627385783
186.67.32471282719829-0.724712827198289
196.67.28427983418536-0.684279834185355
206.67.29831812389225-0.69831812389225
216.87.40682769631897-0.606827696318973
2277.51235641359914-0.512356413599145
237.27.59831812389225-0.39831812389225
247.37.58384684117242-0.283846841172421
257.57.313322298554250.186677701445751
267.66.98064948951940.619350510480598
277.66.997668634372850.602331365627151
287.77.029375558452590.670624441547408
297.77.301731972051740.398268027948263
307.77.123630344665950.576369655334047
317.77.198101627385780.501898372614217
327.67.212139917092680.387860082907322
337.77.263197351653020.436802648346980
347.97.483630344665950.416369655334046
357.97.397235641359910.502764358640086
367.97.468942565439660.431057434560342
377.87.255870160687870.544129839312133
387.67.095553765252160.504446234747835
397.47.198751116905180.201248883094816
4076.971923420586210.0280765794137894
4176.870840938053870.129159061946125
427.26.980.220000000000001
437.56.997019144853450.502980855146553
447.87.097235641359910.702764358640085
457.87.234471282719830.565528717280171
467.77.110191448534470.589808551465526
477.67.253605296693960.346394703306039
487.67.411490427573280.188509572426723
497.57.083513747088720.416486252911278
507.56.779567006987070.720432993012934
517.66.681681876107750.91831812389225
527.66.770840938053880.829159061946125
537.96.899567006987071.00043299301293
547.66.778917517467670.821082482532335
557.56.82466273125430.675337268745697
567.56.83870102096120.661298979038803
577.66.889758455521540.71024154447846
587.77.253821793200430.446178206799573
597.87.253605296693960.546394703306039
607.97.152955807174560.747044192825441
617.96.85370519562321.04629480437680


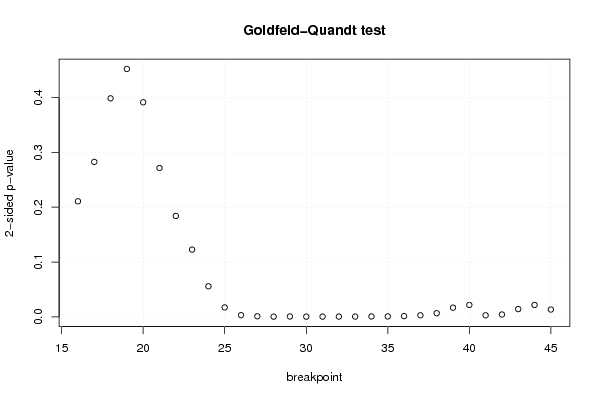
Goldfeld-Quandt test for Heteroskedasticity
p-valuesAlternative Hypothesis
breakpoint indexgreater2-sidedless
160.8946316579144020.2107366841711970.105368342085598
170.85870721293180.2825855741364010.141292787068200
180.8007832883484140.3984334233031720.199216711651586
190.7739987844289650.4520024311420710.226001215571035
200.8043854250938140.3912291498123730.195614574906186
210.8643026244013510.2713947511972970.135697375598649
220.907962505000020.184074989999960.09203749499998
230.9386689582573120.1226620834853760.0613310417426881
240.972116140891310.055767718217380.02788385910869
250.9913576503040170.01728469939196580.00864234969598292
260.998427917139020.003144165721961860.00157208286098093
270.9994349051898850.001130189620230320.000565094810115158
280.999773147044760.0004537059104808660.000226852955240433
290.999608414585090.000783170829818550.000391585414909275
300.9997810844040760.0004378311918470820.000218915595923541
310.9997760412918350.0004479174163300210.000223958708165010
320.9997114204850920.0005771590298160130.000288579514908006
330.999710716422430.0005785671551418840.000289283577570942
340.9995956435257940.0008087129484127540.000404356474206377
350.9995620704112620.0008758591774753760.000437929588737688
360.999291260518110.001417478963780930.000708739481890466
370.9985421182785840.002915763442831290.00145788172141565
380.9966421601525450.006715679694909410.00335783984745470
390.9915918615766670.01681627684666610.00840813842333303
400.9891378547549360.02172429049012840.0108621452450642
410.9985538753694520.002892249261096420.00144612463054821
420.9978108272581850.00437834548362940.0021891727418147
430.9929278978012770.01414420439744640.00707210219872318
440.9891055565545760.02178888689084830.0108944434454242
450.9932980050568910.01340398988621720.0067019949431086

\begin{tabular}{lllllllll}
\hline
Goldfeld-Quandt test for Heteroskedasticity \tabularnewline
p-values & Alternative Hypothesis \tabularnewline
breakpoint index & greater & 2-sided & less \tabularnewline
16 & 0.894631657914402 & 0.210736684171197 & 0.105368342085598 \tabularnewline
17 & 0.8587072129318 & 0.282585574136401 & 0.141292787068200 \tabularnewline
18 & 0.800783288348414 & 0.398433423303172 & 0.199216711651586 \tabularnewline
19 & 0.773998784428965 & 0.452002431142071 & 0.226001215571035 \tabularnewline
20 & 0.804385425093814 & 0.391229149812373 & 0.195614574906186 \tabularnewline
21 & 0.864302624401351 & 0.271394751197297 & 0.135697375598649 \tabularnewline
22 & 0.90796250500002 & 0.18407498999996 & 0.09203749499998 \tabularnewline
23 & 0.938668958257312 & 0.122662083485376 & 0.0613310417426881 \tabularnewline
24 & 0.97211614089131 & 0.05576771821738 & 0.02788385910869 \tabularnewline
25 & 0.991357650304017 & 0.0172846993919658 & 0.00864234969598292 \tabularnewline
26 & 0.99842791713902 & 0.00314416572196186 & 0.00157208286098093 \tabularnewline
27 & 0.999434905189885 & 0.00113018962023032 & 0.000565094810115158 \tabularnewline
28 & 0.99977314704476 & 0.000453705910480866 & 0.000226852955240433 \tabularnewline
29 & 0.99960841458509 & 0.00078317082981855 & 0.000391585414909275 \tabularnewline
30 & 0.999781084404076 & 0.000437831191847082 & 0.000218915595923541 \tabularnewline
31 & 0.999776041291835 & 0.000447917416330021 & 0.000223958708165010 \tabularnewline
32 & 0.999711420485092 & 0.000577159029816013 & 0.000288579514908006 \tabularnewline
33 & 0.99971071642243 & 0.000578567155141884 & 0.000289283577570942 \tabularnewline
34 & 0.999595643525794 & 0.000808712948412754 & 0.000404356474206377 \tabularnewline
35 & 0.999562070411262 & 0.000875859177475376 & 0.000437929588737688 \tabularnewline
36 & 0.99929126051811 & 0.00141747896378093 & 0.000708739481890466 \tabularnewline
37 & 0.998542118278584 & 0.00291576344283129 & 0.00145788172141565 \tabularnewline
38 & 0.996642160152545 & 0.00671567969490941 & 0.00335783984745470 \tabularnewline
39 & 0.991591861576667 & 0.0168162768466661 & 0.00840813842333303 \tabularnewline
40 & 0.989137854754936 & 0.0217242904901284 & 0.0108621452450642 \tabularnewline
41 & 0.998553875369452 & 0.00289224926109642 & 0.00144612463054821 \tabularnewline
42 & 0.997810827258185 & 0.0043783454836294 & 0.0021891727418147 \tabularnewline
43 & 0.992927897801277 & 0.0141442043974464 & 0.00707210219872318 \tabularnewline
44 & 0.989105556554576 & 0.0217888868908483 & 0.0108944434454242 \tabularnewline
45 & 0.993298005056891 & 0.0134039898862172 & 0.0067019949431086 \tabularnewline
\hline
\end{tabular}
%Source: https://freestatistics.org/blog/index.php?pk=57899&T=5

[TABLE]
[ROW][C]Goldfeld-Quandt test for Heteroskedasticity[/C][/ROW]
[ROW][C]p-values[/C][C]Alternative Hypothesis[/C][/ROW]
[ROW][C]breakpoint index[/C][C]greater[/C][C]2-sided[/C][C]less[/C][/ROW]
[ROW][C]16[/C][C]0.894631657914402[/C][C]0.210736684171197[/C][C]0.105368342085598[/C][/ROW]
[ROW][C]17[/C][C]0.8587072129318[/C][C]0.282585574136401[/C][C]0.141292787068200[/C][/ROW]
[ROW][C]18[/C][C]0.800783288348414[/C][C]0.398433423303172[/C][C]0.199216711651586[/C][/ROW]
[ROW][C]19[/C][C]0.773998784428965[/C][C]0.452002431142071[/C][C]0.226001215571035[/C][/ROW]
[ROW][C]20[/C][C]0.804385425093814[/C][C]0.391229149812373[/C][C]0.195614574906186[/C][/ROW]
[ROW][C]21[/C][C]0.864302624401351[/C][C]0.271394751197297[/C][C]0.135697375598649[/C][/ROW]
[ROW][C]22[/C][C]0.90796250500002[/C][C]0.18407498999996[/C][C]0.09203749499998[/C][/ROW]
[ROW][C]23[/C][C]0.938668958257312[/C][C]0.122662083485376[/C][C]0.0613310417426881[/C][/ROW]
[ROW][C]24[/C][C]0.97211614089131[/C][C]0.05576771821738[/C][C]0.02788385910869[/C][/ROW]
[ROW][C]25[/C][C]0.991357650304017[/C][C]0.0172846993919658[/C][C]0.00864234969598292[/C][/ROW]
[ROW][C]26[/C][C]0.99842791713902[/C][C]0.00314416572196186[/C][C]0.00157208286098093[/C][/ROW]
[ROW][C]27[/C][C]0.999434905189885[/C][C]0.00113018962023032[/C][C]0.000565094810115158[/C][/ROW]
[ROW][C]28[/C][C]0.99977314704476[/C][C]0.000453705910480866[/C][C]0.000226852955240433[/C][/ROW]
[ROW][C]29[/C][C]0.99960841458509[/C][C]0.00078317082981855[/C][C]0.000391585414909275[/C][/ROW]
[ROW][C]30[/C][C]0.999781084404076[/C][C]0.000437831191847082[/C][C]0.000218915595923541[/C][/ROW]
[ROW][C]31[/C][C]0.999776041291835[/C][C]0.000447917416330021[/C][C]0.000223958708165010[/C][/ROW]
[ROW][C]32[/C][C]0.999711420485092[/C][C]0.000577159029816013[/C][C]0.000288579514908006[/C][/ROW]
[ROW][C]33[/C][C]0.99971071642243[/C][C]0.000578567155141884[/C][C]0.000289283577570942[/C][/ROW]
[ROW][C]34[/C][C]0.999595643525794[/C][C]0.000808712948412754[/C][C]0.000404356474206377[/C][/ROW]
[ROW][C]35[/C][C]0.999562070411262[/C][C]0.000875859177475376[/C][C]0.000437929588737688[/C][/ROW]
[ROW][C]36[/C][C]0.99929126051811[/C][C]0.00141747896378093[/C][C]0.000708739481890466[/C][/ROW]
[ROW][C]37[/C][C]0.998542118278584[/C][C]0.00291576344283129[/C][C]0.00145788172141565[/C][/ROW]
[ROW][C]38[/C][C]0.996642160152545[/C][C]0.00671567969490941[/C][C]0.00335783984745470[/C][/ROW]
[ROW][C]39[/C][C]0.991591861576667[/C][C]0.0168162768466661[/C][C]0.00840813842333303[/C][/ROW]
[ROW][C]40[/C][C]0.989137854754936[/C][C]0.0217242904901284[/C][C]0.0108621452450642[/C][/ROW]
[ROW][C]41[/C][C]0.998553875369452[/C][C]0.00289224926109642[/C][C]0.00144612463054821[/C][/ROW]
[ROW][C]42[/C][C]0.997810827258185[/C][C]0.0043783454836294[/C][C]0.0021891727418147[/C][/ROW]
[ROW][C]43[/C][C]0.992927897801277[/C][C]0.0141442043974464[/C][C]0.00707210219872318[/C][/ROW]
[ROW][C]44[/C][C]0.989105556554576[/C][C]0.0217888868908483[/C][C]0.0108944434454242[/C][/ROW]
[ROW][C]45[/C][C]0.993298005056891[/C][C]0.0134039898862172[/C][C]0.0067019949431086[/C][/ROW]
[/TABLE]
Source: https://freestatistics.org/blog/index.php?pk=57899&T=5

Globally Unique Identifier (entire table): ba.freestatistics.org/blog/index.php?pk=57899&T=5

As an alternative you can also use a QR Code:  

The GUIDs for individual cells are displayed in the table below:

Goldfeld-Quandt test for Heteroskedasticity
p-valuesAlternative Hypothesis
breakpoint indexgreater2-sidedless
160.8946316579144020.2107366841711970.105368342085598
170.85870721293180.2825855741364010.141292787068200
180.8007832883484140.3984334233031720.199216711651586
190.7739987844289650.4520024311420710.226001215571035
200.8043854250938140.3912291498123730.195614574906186
210.8643026244013510.2713947511972970.135697375598649
220.907962505000020.184074989999960.09203749499998
230.9386689582573120.1226620834853760.0613310417426881
240.972116140891310.055767718217380.02788385910869
250.9913576503040170.01728469939196580.00864234969598292
260.998427917139020.003144165721961860.00157208286098093
270.9994349051898850.001130189620230320.000565094810115158
280.999773147044760.0004537059104808660.000226852955240433
290.999608414585090.000783170829818550.000391585414909275
300.9997810844040760.0004378311918470820.000218915595923541
310.9997760412918350.0004479174163300210.000223958708165010
320.9997114204850920.0005771590298160130.000288579514908006
330.999710716422430.0005785671551418840.000289283577570942
340.9995956435257940.0008087129484127540.000404356474206377
350.9995620704112620.0008758591774753760.000437929588737688
360.999291260518110.001417478963780930.000708739481890466
370.9985421182785840.002915763442831290.00145788172141565
380.9966421601525450.006715679694909410.00335783984745470
390.9915918615766670.01681627684666610.00840813842333303
400.9891378547549360.02172429049012840.0108621452450642
410.9985538753694520.002892249261096420.00144612463054821
420.9978108272581850.00437834548362940.0021891727418147
430.9929278978012770.01414420439744640.00707210219872318
440.9891055565545760.02178888689084830.0108944434454242
450.9932980050568910.01340398988621720.0067019949431086


Meta Analysis of Goldfeld-Quandt test for Heteroskedasticity
Description# significant tests% significant testsOK/NOK
1% type I error level150.5NOK
5% type I error level210.7NOK
10% type I error level220.733333333333333NOK

\begin{tabular}{lllllllll}
\hline
Meta Analysis of Goldfeld-Quandt test for Heteroskedasticity \tabularnewline
Description & # significant tests & % significant tests & OK/NOK \tabularnewline
1% type I error level & 15 & 0.5 & NOK \tabularnewline
5% type I error level & 21 & 0.7 & NOK \tabularnewline
10% type I error level & 22 & 0.733333333333333 & NOK \tabularnewline
\hline
\end{tabular}
%Source: https://freestatistics.org/blog/index.php?pk=57899&T=6

[TABLE]
[ROW][C]Meta Analysis of Goldfeld-Quandt test for Heteroskedasticity[/C][/ROW]
[ROW][C]Description[/C][C]# significant tests[/C][C]% significant tests[/C][C]OK/NOK[/C][/ROW]
[ROW][C]1% type I error level[/C][C]15[/C][C]0.5[/C][C]NOK[/C][/ROW]
[ROW][C]5% type I error level[/C][C]21[/C][C]0.7[/C][C]NOK[/C][/ROW]
[ROW][C]10% type I error level[/C][C]22[/C][C]0.733333333333333[/C][C]NOK[/C][/ROW]
[/TABLE]
Source: https://freestatistics.org/blog/index.php?pk=57899&T=6

Globally Unique Identifier (entire table): ba.freestatistics.org/blog/index.php?pk=57899&T=6

As an alternative you can also use a QR Code:  

The GUIDs for individual cells are displayed in the table below:

Meta Analysis of Goldfeld-Quandt test for Heteroskedasticity
Description# significant tests% significant testsOK/NOK
1% type I error level150.5NOK
5% type I error level210.7NOK
10% type I error level220.733333333333333NOK


Parameters (Session):
par1 = 1 ; par2 = Include Monthly Dummies ; par3 = No Linear Trend ;
Parameters (R input):
par1 = 1 ; par2 = Include Monthly Dummies ; par3 = No Linear Trend ;
R code (references can be found in the software module):
library(lattice)
library(lmtest)
n25 <- 25 #minimum number of obs. for Goldfeld-Quandt test
par1 <- as.numeric(par1)
x <- t(y)
k <- length(x[1,])
n <- length(x[,1])
x1 <- cbind(x[,par1], x[,1:k!=par1])
mycolnames <- c(colnames(x)[par1], colnames(x)[1:k!=par1])
colnames(x1) <- mycolnames #colnames(x)[par1]
x <- x1
if (par3 == 'First Differences'){
x2 <- array(0, dim=c(n-1,k), dimnames=list(1:(n-1), paste('(1-B)',colnames(x),sep='')))
for (i in 1:n-1) {
for (j in 1:k) {
x2[i,j] <- x[i+1,j] - x[i,j]
}
}
x <- x2
}
if (par2 == 'Include Monthly Dummies'){
x2 <- array(0, dim=c(n,11), dimnames=list(1:n, paste('M', seq(1:11), sep ='')))
for (i in 1:11){
x2[seq(i,n,12),i] <- 1
}
x <- cbind(x, x2)
}
if (par2 == 'Include Quarterly Dummies'){
x2 <- array(0, dim=c(n,3), dimnames=list(1:n, paste('Q', seq(1:3), sep ='')))
for (i in 1:3){
x2[seq(i,n,4),i] <- 1
}
x <- cbind(x, x2)
}
k <- length(x[1,])
if (par3 == 'Linear Trend'){
x <- cbind(x, c(1:n))
colnames(x)[k+1] <- 't'
}
x
k <- length(x[1,])
df <- as.data.frame(x)
(mylm <- lm(df))
(mysum <- summary(mylm))
if (n > n25) {
kp3 <- k + 3
nmkm3 <- n - k - 3
gqarr <- array(NA, dim=c(nmkm3-kp3+1,3))
numgqtests <- 0
numsignificant1 <- 0
numsignificant5 <- 0
numsignificant10 <- 0
for (mypoint in kp3:nmkm3) {
j <- 0
numgqtests <- numgqtests + 1
for (myalt in c('greater', 'two.sided', 'less')) {
j <- j + 1
gqarr[mypoint-kp3+1,j] <- gqtest(mylm, point=mypoint, alternative=myalt)$p.value
}
if (gqarr[mypoint-kp3+1,2] < 0.01) numsignificant1 <- numsignificant1 + 1
if (gqarr[mypoint-kp3+1,2] < 0.05) numsignificant5 <- numsignificant5 + 1
if (gqarr[mypoint-kp3+1,2] < 0.10) numsignificant10 <- numsignificant10 + 1
}
gqarr
}
bitmap(file='test0.png')
plot(x[,1], type='l', main='Actuals and Interpolation', ylab='value of Actuals and Interpolation (dots)', xlab='time or index')
points(x[,1]-mysum$resid)
grid()
dev.off()
bitmap(file='test1.png')
plot(mysum$resid, type='b', pch=19, main='Residuals', ylab='value of Residuals', xlab='time or index')
grid()
dev.off()
bitmap(file='test2.png')
hist(mysum$resid, main='Residual Histogram', xlab='values of Residuals')
grid()
dev.off()
bitmap(file='test3.png')
densityplot(~mysum$resid,col='black',main='Residual Density Plot', xlab='values of Residuals')
dev.off()
bitmap(file='test4.png')
qqnorm(mysum$resid, main='Residual Normal Q-Q Plot')
qqline(mysum$resid)
grid()
dev.off()
(myerror <- as.ts(mysum$resid))
bitmap(file='test5.png')
dum <- cbind(lag(myerror,k=1),myerror)
dum
dum1 <- dum[2:length(myerror),]
dum1
z <- as.data.frame(dum1)
z
plot(z,main=paste('Residual Lag plot, lowess, and regression line'), ylab='values of Residuals', xlab='lagged values of Residuals')
lines(lowess(z))
abline(lm(z))
grid()
dev.off()
bitmap(file='test6.png')
acf(mysum$resid, lag.max=length(mysum$resid)/2, main='Residual Autocorrelation Function')
grid()
dev.off()
bitmap(file='test7.png')
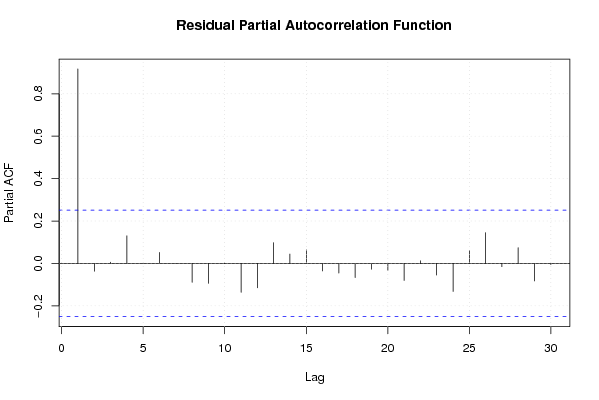
pacf(mysum$resid, lag.max=length(mysum$resid)/2, main='Residual Partial Autocorrelation Function')
grid()
dev.off()
bitmap(file='test8.png')
opar <- par(mfrow = c(2,2), oma = c(0, 0, 1.1, 0))
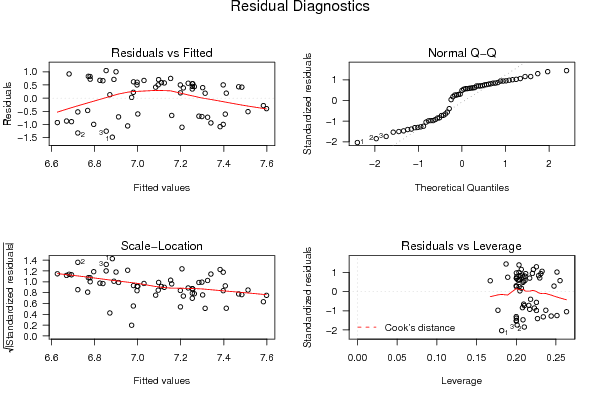
plot(mylm, las = 1, sub='Residual Diagnostics')
par(opar)
dev.off()
if (n > n25) {
bitmap(file='test9.png')
plot(kp3:nmkm3,gqarr[,2], main='Goldfeld-Quandt test',ylab='2-sided p-value',xlab='breakpoint')
grid()
dev.off()
}
load(file='createtable')
a<-table.start()
a<-table.row.start(a)
a<-table.element(a, 'Multiple Linear Regression - Estimated Regression Equation', 1, TRUE)
a<-table.row.end(a)
myeq <- colnames(x)[1]
myeq <- paste(myeq, '[t] = ', sep='')
for (i in 1:k){
if (mysum$coefficients[i,1] > 0) myeq <- paste(myeq, '+', '')
myeq <- paste(myeq, mysum$coefficients[i,1], sep=' ')
if (rownames(mysum$coefficients)[i] != '(Intercept)') {
myeq <- paste(myeq, rownames(mysum$coefficients)[i], sep='')
if (rownames(mysum$coefficients)[i] != 't') myeq <- paste(myeq, '[t]', sep='')
}
}
myeq <- paste(myeq, ' + e[t]')
a<-table.row.start(a)
a<-table.element(a, myeq)
a<-table.row.end(a)
a<-table.end(a)
table.save(a,file='mytable1.tab')
a<-table.start()
a<-table.row.start(a)
a<-table.element(a,hyperlink('ols1.htm','Multiple Linear Regression - Ordinary Least Squares',''), 6, TRUE)
a<-table.row.end(a)
a<-table.row.start(a)
a<-table.element(a,'Variable',header=TRUE)
a<-table.element(a,'Parameter',header=TRUE)
a<-table.element(a,'S.D.',header=TRUE)
a<-table.element(a,'T-STAT
H0: parameter = 0',header=TRUE)
a<-table.element(a,'2-tail p-value',header=TRUE)
a<-table.element(a,'1-tail p-value',header=TRUE)
a<-table.row.end(a)
for (i in 1:k){
a<-table.row.start(a)
a<-table.element(a,rownames(mysum$coefficients)[i],header=TRUE)
a<-table.element(a,mysum$coefficients[i,1])
a<-table.element(a, round(mysum$coefficients[i,2],6))
a<-table.element(a, round(mysum$coefficients[i,3],4))
a<-table.element(a, round(mysum$coefficients[i,4],6))
a<-table.element(a, round(mysum$coefficients[i,4]/2,6))
a<-table.row.end(a)
}
a<-table.end(a)
table.save(a,file='mytable2.tab')
a<-table.start()
a<-table.row.start(a)
a<-table.element(a, 'Multiple Linear Regression - Regression Statistics', 2, TRUE)
a<-table.row.end(a)
a<-table.row.start(a)
a<-table.element(a, 'Multiple R',1,TRUE)
a<-table.element(a, sqrt(mysum$r.squared))
a<-table.row.end(a)
a<-table.row.start(a)
a<-table.element(a, 'R-squared',1,TRUE)
a<-table.element(a, mysum$r.squared)
a<-table.row.end(a)
a<-table.row.start(a)
a<-table.element(a, 'Adjusted R-squared',1,TRUE)
a<-table.element(a, mysum$adj.r.squared)
a<-table.row.end(a)
a<-table.row.start(a)
a<-table.element(a, 'F-TEST (value)',1,TRUE)
a<-table.element(a, mysum$fstatistic[1])
a<-table.row.end(a)
a<-table.row.start(a)
a<-table.element(a, 'F-TEST (DF numerator)',1,TRUE)
a<-table.element(a, mysum$fstatistic[2])
a<-table.row.end(a)
a<-table.row.start(a)
a<-table.element(a, 'F-TEST (DF denominator)',1,TRUE)
a<-table.element(a, mysum$fstatistic[3])
a<-table.row.end(a)
a<-table.row.start(a)
a<-table.element(a, 'p-value',1,TRUE)
a<-table.element(a, 1-pf(mysum$fstatistic[1],mysum$fstatistic[2],mysum$fstatistic[3]))
a<-table.row.end(a)
a<-table.row.start(a)
a<-table.element(a, 'Multiple Linear Regression - Residual Statistics', 2, TRUE)
a<-table.row.end(a)
a<-table.row.start(a)
a<-table.element(a, 'Residual Standard Deviation',1,TRUE)
a<-table.element(a, mysum$sigma)
a<-table.row.end(a)
a<-table.row.start(a)
a<-table.element(a, 'Sum Squared Residuals',1,TRUE)
a<-table.element(a, sum(myerror*myerror))
a<-table.row.end(a)
a<-table.end(a)
table.save(a,file='mytable3.tab')
a<-table.start()
a<-table.row.start(a)
a<-table.element(a, 'Multiple Linear Regression - Actuals, Interpolation, and Residuals', 4, TRUE)
a<-table.row.end(a)
a<-table.row.start(a)
a<-table.element(a, 'Time or Index', 1, TRUE)
a<-table.element(a, 'Actuals', 1, TRUE)
a<-table.element(a, 'Interpolation
Forecast', 1, TRUE)
a<-table.element(a, 'Residuals
Prediction Error', 1, TRUE)
a<-table.row.end(a)
for (i in 1:n) {
a<-table.row.start(a)
a<-table.element(a,i, 1, TRUE)
a<-table.element(a,x[i])
a<-table.element(a,x[i]-mysum$resid[i])
a<-table.element(a,mysum$resid[i])
a<-table.row.end(a)
}
a<-table.end(a)
table.save(a,file='mytable4.tab')
if (n > n25) {
a<-table.start()
a<-table.row.start(a)
a<-table.element(a,'Goldfeld-Quandt test for Heteroskedasticity',4,TRUE)
a<-table.row.end(a)
a<-table.row.start(a)
a<-table.element(a,'p-values',header=TRUE)
a<-table.element(a,'Alternative Hypothesis',3,header=TRUE)
a<-table.row.end(a)
a<-table.row.start(a)
a<-table.element(a,'breakpoint index',header=TRUE)
a<-table.element(a,'greater',header=TRUE)
a<-table.element(a,'2-sided',header=TRUE)
a<-table.element(a,'less',header=TRUE)
a<-table.row.end(a)
for (mypoint in kp3:nmkm3) {
a<-table.row.start(a)
a<-table.element(a,mypoint,header=TRUE)
a<-table.element(a,gqarr[mypoint-kp3+1,1])
a<-table.element(a,gqarr[mypoint-kp3+1,2])
a<-table.element(a,gqarr[mypoint-kp3+1,3])
a<-table.row.end(a)
}
a<-table.end(a)
table.save(a,file='mytable5.tab')
a<-table.start()
a<-table.row.start(a)
a<-table.element(a,'Meta Analysis of Goldfeld-Quandt test for Heteroskedasticity',4,TRUE)
a<-table.row.end(a)
a<-table.row.start(a)
a<-table.element(a,'Description',header=TRUE)
a<-table.element(a,'# significant tests',header=TRUE)
a<-table.element(a,'% significant tests',header=TRUE)
a<-table.element(a,'OK/NOK',header=TRUE)
a<-table.row.end(a)
a<-table.row.start(a)
a<-table.element(a,'1% type I error level',header=TRUE)
a<-table.element(a,numsignificant1)
a<-table.element(a,numsignificant1/numgqtests)
if (numsignificant1/numgqtests < 0.01) dum <- 'OK' else dum <- 'NOK'
a<-table.element(a,dum)
a<-table.row.end(a)
a<-table.row.start(a)
a<-table.element(a,'5% type I error level',header=TRUE)
a<-table.element(a,numsignificant5)
a<-table.element(a,numsignificant5/numgqtests)
if (numsignificant5/numgqtests < 0.05) dum <- 'OK' else dum <- 'NOK'
a<-table.element(a,dum)
a<-table.row.end(a)
a<-table.row.start(a)
a<-table.element(a,'10% type I error level',header=TRUE)
a<-table.element(a,numsignificant10)
a<-table.element(a,numsignificant10/numgqtests)
if (numsignificant10/numgqtests < 0.1) dum <- 'OK' else dum <- 'NOK'
a<-table.element(a,dum)
a<-table.row.end(a)
a<-table.end(a)
table.save(a,file='mytable6.tab')
}