| Multiple Linear Regression - Estimated Regression Equation |
| Y[t] = + 7.9572857373039 -0.287260689331907X[t] -0.299250611551363M1[t] -0.517019144853447M2[t] -0.47127393106681M3[t] -0.497019144853447M4[t] -0.397019144853448M5[t] -0.402764358640086M6[t] -0.357019144853448M7[t] -0.285528717280171M8[t] -0.205745213786639M9[t] -0.0714904275732762M10[t] -0.0429808551465527M11[t] + e[t] |
| Multiple Linear Regression - Ordinary Least Squares | |||||
| Variable | Parameter | S.D. | T-STAT H0: parameter = 0 | 2-tail p-value | 1-tail p-value |
| (Intercept) | 7.9572857373039 | 0.486162 | 16.3676 | 0 | 0 |
| X | -0.287260689331907 | 0.168598 | -1.7038 | 0.094882 | 0.047441 |
| M1 | -0.299250611551363 | 0.487923 | -0.6133 | 0.542563 | 0.271282 |
| M2 | -0.517019144853447 | 0.508847 | -1.0161 | 0.314695 | 0.157347 |
| M3 | -0.47127393106681 | 0.508947 | -0.926 | 0.35909 | 0.179545 |
| M4 | -0.497019144853447 | 0.508847 | -0.9768 | 0.333587 | 0.166794 |
| M5 | -0.397019144853448 | 0.508847 | -0.7802 | 0.439084 | 0.219542 |
| M6 | -0.402764358640086 | 0.508769 | -0.7916 | 0.432462 | 0.216231 |
| M7 | -0.357019144853448 | 0.508847 | -0.7016 | 0.486302 | 0.243151 |
| M8 | -0.285528717280171 | 0.50907 | -0.5609 | 0.577486 | 0.288743 |
| M9 | -0.205745213786639 | 0.508679 | -0.4045 | 0.687664 | 0.343832 |
| M10 | -0.0714904275732762 | 0.508713 | -0.1405 | 0.888828 | 0.444414 |
| M11 | -0.0429808551465527 | 0.508847 | -0.0845 | 0.933036 | 0.466518 |
| Multiple Linear Regression - Regression Statistics | |
| Multiple R | 0.336804243371758 |
| R-squared | 0.113437098353223 |
| Adjusted R-squared | -0.108203627058472 |
| F-TEST (value) | 0.511806204128393 |
| F-TEST (DF numerator) | 12 |
| F-TEST (DF denominator) | 48 |
| p-value | 0.896743475231945 |
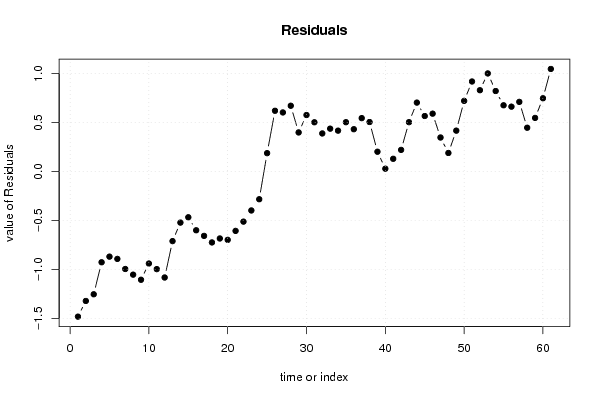
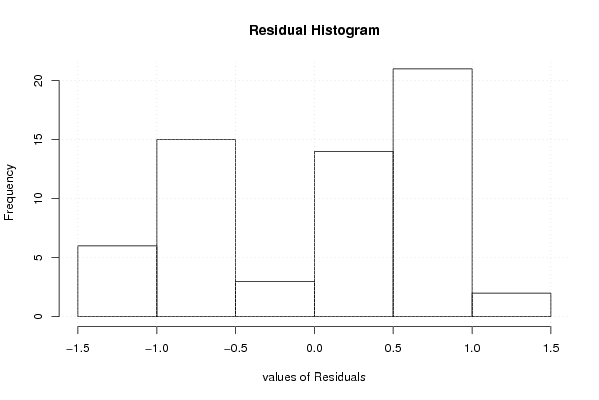
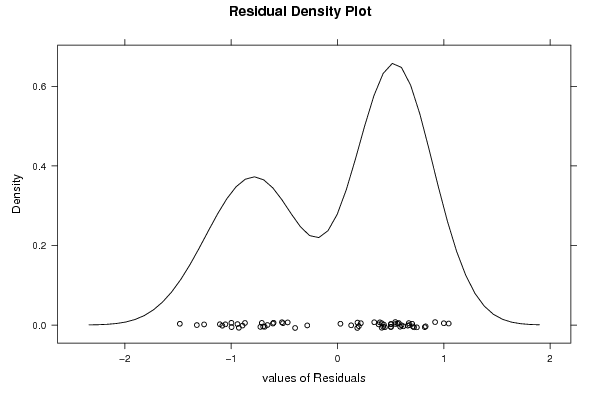
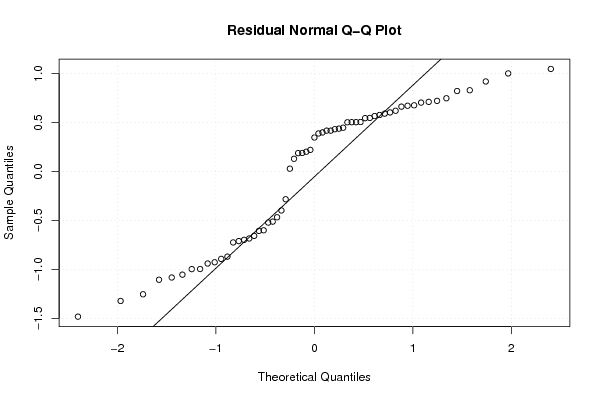
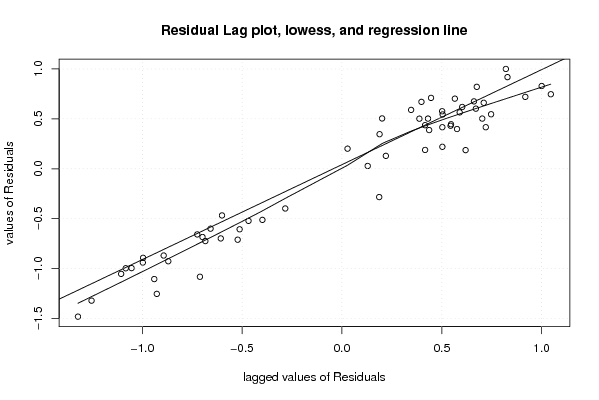
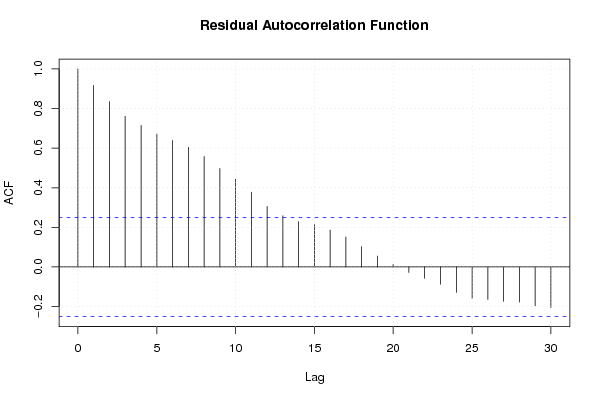
| Multiple Linear Regression - Residual Statistics | |
| Residual Standard Deviation | 0.80427473635461 |
| Sum Squared Residuals | 31.0491768738373 |
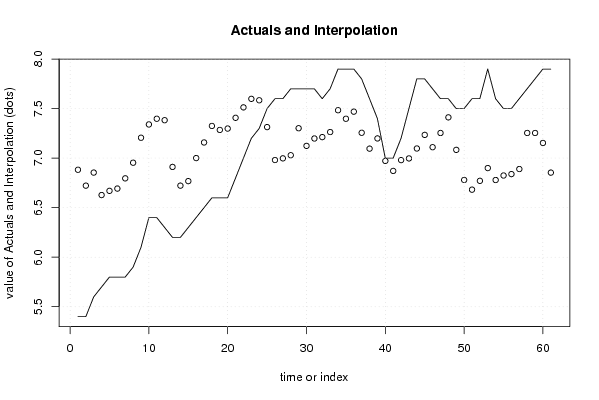
| Multiple Linear Regression - Actuals, Interpolation, and Residuals | |||
| Time or Index | Actuals | Interpolation Forecast | Residuals Prediction Error |
| 1 | 5.4 | 6.88243126455639 | -1.48243126455639 |
| 2 | 5.4 | 6.72211486912068 | -1.32211486912068 |
| 3 | 5.6 | 6.8540382897069 | -1.25403828970690 |
| 4 | 5.7 | 6.62721059338792 | -0.92721059338792 |
| 5 | 5.8 | 6.66975845552154 | -0.869758455521539 |
| 6 | 5.8 | 6.69273931066809 | -0.892739310668092 |
| 7 | 5.8 | 6.79593666232111 | -0.995936662321112 |
| 8 | 5.9 | 6.95360529669396 | -1.05360529669396 |
| 9 | 6.1 | 7.20574521378664 | -1.10574521378664 |
| 10 | 6.4 | 7.34 | -0.94 |
| 11 | 6.4 | 7.39723564135991 | -0.997235641359914 |
| 12 | 6.3 | 7.38276435864009 | -1.08276435864009 |
| 13 | 6.2 | 6.91115733348958 | -0.711157333489578 |
| 14 | 6.2 | 6.72211486912068 | -0.522114869120684 |
| 15 | 6.3 | 6.76786008290732 | -0.467860082907322 |
| 16 | 6.4 | 7.0006494895194 | -0.600649489519401 |
| 17 | 6.5 | 7.15810162738578 | -0.658101627385783 |
| 18 | 6.6 | 7.32471282719829 | -0.724712827198289 |
| 19 | 6.6 | 7.28427983418536 | -0.684279834185355 |
| 20 | 6.6 | 7.29831812389225 | -0.69831812389225 |
| 21 | 6.8 | 7.40682769631897 | -0.606827696318973 |
| 22 | 7 | 7.51235641359914 | -0.512356413599145 |
| 23 | 7.2 | 7.59831812389225 | -0.39831812389225 |
| 24 | 7.3 | 7.58384684117242 | -0.283846841172421 |
| 25 | 7.5 | 7.31332229855425 | 0.186677701445751 |
| 26 | 7.6 | 6.9806494895194 | 0.619350510480598 |
| 27 | 7.6 | 6.99766863437285 | 0.602331365627151 |
| 28 | 7.7 | 7.02937555845259 | 0.670624441547408 |
| 29 | 7.7 | 7.30173197205174 | 0.398268027948263 |
| 30 | 7.7 | 7.12363034466595 | 0.576369655334047 |
| 31 | 7.7 | 7.19810162738578 | 0.501898372614217 |
| 32 | 7.6 | 7.21213991709268 | 0.387860082907322 |
| 33 | 7.7 | 7.26319735165302 | 0.436802648346980 |
| 34 | 7.9 | 7.48363034466595 | 0.416369655334046 |
| 35 | 7.9 | 7.39723564135991 | 0.502764358640086 |
| 36 | 7.9 | 7.46894256543966 | 0.431057434560342 |
| 37 | 7.8 | 7.25587016068787 | 0.544129839312133 |
| 38 | 7.6 | 7.09555376525216 | 0.504446234747835 |
| 39 | 7.4 | 7.19875111690518 | 0.201248883094816 |
| 40 | 7 | 6.97192342058621 | 0.0280765794137894 |
| 41 | 7 | 6.87084093805387 | 0.129159061946125 |
| 42 | 7.2 | 6.98 | 0.220000000000001 |
| 43 | 7.5 | 6.99701914485345 | 0.502980855146553 |
| 44 | 7.8 | 7.09723564135991 | 0.702764358640085 |
| 45 | 7.8 | 7.23447128271983 | 0.565528717280171 |
| 46 | 7.7 | 7.11019144853447 | 0.589808551465526 |
| 47 | 7.6 | 7.25360529669396 | 0.346394703306039 |
| 48 | 7.6 | 7.41149042757328 | 0.188509572426723 |
| 49 | 7.5 | 7.08351374708872 | 0.416486252911278 |
| 50 | 7.5 | 6.77956700698707 | 0.720432993012934 |
| 51 | 7.6 | 6.68168187610775 | 0.91831812389225 |
| 52 | 7.6 | 6.77084093805388 | 0.829159061946125 |
| 53 | 7.9 | 6.89956700698707 | 1.00043299301293 |
| 54 | 7.6 | 6.77891751746767 | 0.821082482532335 |
| 55 | 7.5 | 6.8246627312543 | 0.675337268745697 |
| 56 | 7.5 | 6.8387010209612 | 0.661298979038803 |
| 57 | 7.6 | 6.88975845552154 | 0.71024154447846 |
| 58 | 7.7 | 7.25382179320043 | 0.446178206799573 |
| 59 | 7.8 | 7.25360529669396 | 0.546394703306039 |
| 60 | 7.9 | 7.15295580717456 | 0.747044192825441 |
| 61 | 7.9 | 6.8537051956232 | 1.04629480437680 |
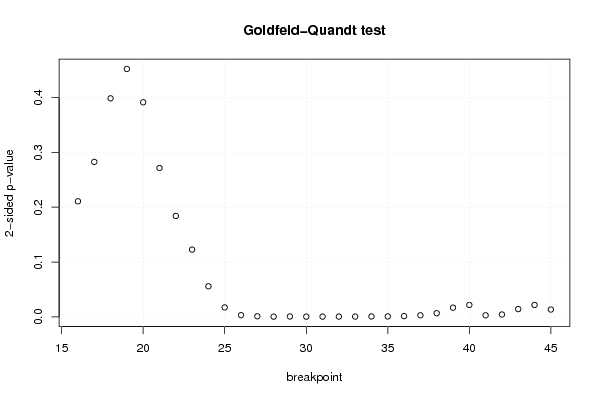
| Goldfeld-Quandt test for Heteroskedasticity | |||
| p-values | Alternative Hypothesis | ||
| breakpoint index | greater | 2-sided | less |
| 16 | 0.894631657914402 | 0.210736684171197 | 0.105368342085598 |
| 17 | 0.8587072129318 | 0.282585574136401 | 0.141292787068200 |
| 18 | 0.800783288348414 | 0.398433423303172 | 0.199216711651586 |
| 19 | 0.773998784428965 | 0.452002431142071 | 0.226001215571035 |
| 20 | 0.804385425093814 | 0.391229149812373 | 0.195614574906186 |
| 21 | 0.864302624401351 | 0.271394751197297 | 0.135697375598649 |
| 22 | 0.90796250500002 | 0.18407498999996 | 0.09203749499998 |
| 23 | 0.938668958257312 | 0.122662083485376 | 0.0613310417426881 |
| 24 | 0.97211614089131 | 0.05576771821738 | 0.02788385910869 |
| 25 | 0.991357650304017 | 0.0172846993919658 | 0.00864234969598292 |
| 26 | 0.99842791713902 | 0.00314416572196186 | 0.00157208286098093 |
| 27 | 0.999434905189885 | 0.00113018962023032 | 0.000565094810115158 |
| 28 | 0.99977314704476 | 0.000453705910480866 | 0.000226852955240433 |
| 29 | 0.99960841458509 | 0.00078317082981855 | 0.000391585414909275 |
| 30 | 0.999781084404076 | 0.000437831191847082 | 0.000218915595923541 |
| 31 | 0.999776041291835 | 0.000447917416330021 | 0.000223958708165010 |
| 32 | 0.999711420485092 | 0.000577159029816013 | 0.000288579514908006 |
| 33 | 0.99971071642243 | 0.000578567155141884 | 0.000289283577570942 |
| 34 | 0.999595643525794 | 0.000808712948412754 | 0.000404356474206377 |
| 35 | 0.999562070411262 | 0.000875859177475376 | 0.000437929588737688 |
| 36 | 0.99929126051811 | 0.00141747896378093 | 0.000708739481890466 |
| 37 | 0.998542118278584 | 0.00291576344283129 | 0.00145788172141565 |
| 38 | 0.996642160152545 | 0.00671567969490941 | 0.00335783984745470 |
| 39 | 0.991591861576667 | 0.0168162768466661 | 0.00840813842333303 |
| 40 | 0.989137854754936 | 0.0217242904901284 | 0.0108621452450642 |
| 41 | 0.998553875369452 | 0.00289224926109642 | 0.00144612463054821 |
| 42 | 0.997810827258185 | 0.0043783454836294 | 0.0021891727418147 |
| 43 | 0.992927897801277 | 0.0141442043974464 | 0.00707210219872318 |
| 44 | 0.989105556554576 | 0.0217888868908483 | 0.0108944434454242 |
| 45 | 0.993298005056891 | 0.0134039898862172 | 0.0067019949431086 |
| Meta Analysis of Goldfeld-Quandt test for Heteroskedasticity | |||
| Description | # significant tests | % significant tests | OK/NOK |
| 1% type I error level | 15 | 0.5 | NOK |
| 5% type I error level | 21 | 0.7 | NOK |
| 10% type I error level | 22 | 0.733333333333333 | NOK |