| Multiple Linear Regression - Estimated Regression Equation |
| Y[t] = + 649.098782608696 + 49.8834782608695X[t] -26.9059130434782M1[t] -39.7711304347826M2[t] -34.8363478260870M3[t] -30.1015652173913M4[t] -31.7667826086957M5[t] -38.0320000000000M6[t] -40.4972173913044M7[t] -49.1624347826087M8[t] -44.427652173913M9[t] + 9.3071304347826M10[t] + 19.8419130434782M11[t] -2.53478260869565t + e[t] |
| Multiple Linear Regression - Ordinary Least Squares | |||||
| Variable | Parameter | S.D. | T-STAT H0: parameter = 0 | 2-tail p-value | 1-tail p-value |
| (Intercept) | 649.098782608696 | 11.62669 | 55.8283 | 0 | 0 |
| X | 49.8834782608695 | 9.939399 | 5.0188 | 8e-06 | 4e-06 |
| M1 | -26.9059130434782 | 13.880686 | -1.9384 | 0.058729 | 0.029364 |
| M2 | -39.7711304347826 | 13.862139 | -2.869 | 0.006198 | 0.003099 |
| M3 | -34.8363478260870 | 13.847697 | -2.5157 | 0.015435 | 0.007718 |
| M4 | -30.1015652173913 | 13.837372 | -2.1754 | 0.034777 | 0.017389 |
| M5 | -31.7667826086957 | 13.831173 | -2.2968 | 0.026236 | 0.013118 |
| M6 | -38.0320000000000 | 13.829106 | -2.7501 | 0.008488 | 0.004244 |
| M7 | -40.4972173913044 | 13.831173 | -2.928 | 0.00529 | 0.002645 |
| M8 | -49.1624347826087 | 13.837372 | -3.5529 | 0.000894 | 0.000447 |
| M9 | -44.427652173913 | 13.847697 | -3.2083 | 0.002433 | 0.001217 |
| M10 | 9.3071304347826 | 13.862139 | 0.6714 | 0.505319 | 0.25266 |
| M11 | 19.8419130434782 | 13.880686 | 1.4295 | 0.159628 | 0.079814 |
| t | -2.53478260869565 | 0.239105 | -10.6011 | 0 | 0 |
| Multiple Linear Regression - Regression Statistics | |
| Multiple R | 0.888041241395152 |
| R-squared | 0.788617246418643 |
| Adjusted R-squared | 0.72887864214565 |
| F-TEST (value) | 13.2011327686003 |
| F-TEST (DF numerator) | 13 |
| F-TEST (DF denominator) | 46 |
| p-value | 1.89785964721523e-11 |
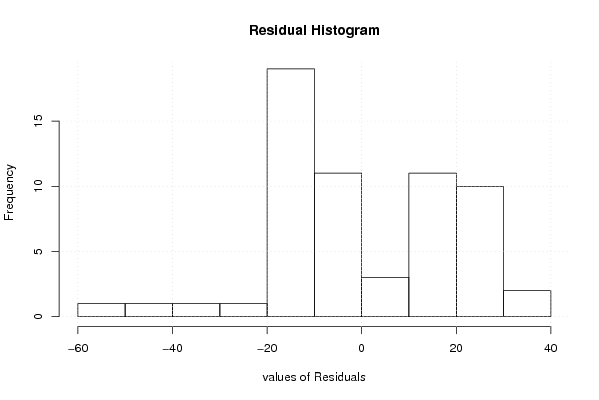
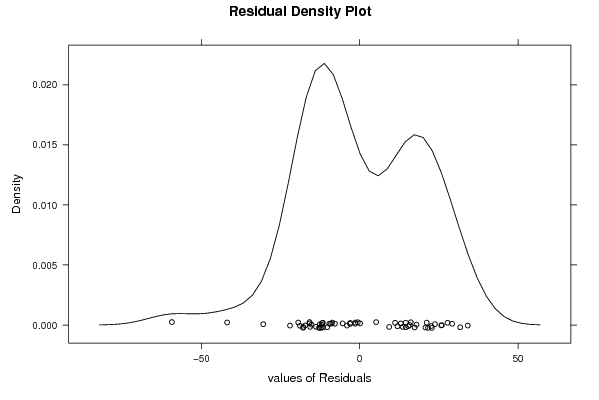
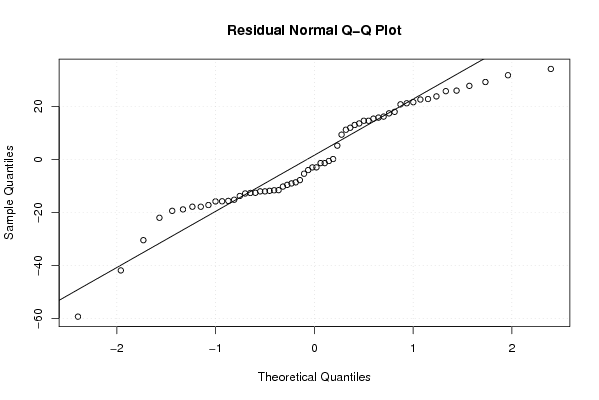
| Multiple Linear Regression - Residual Statistics | |
| Residual Standard Deviation | 21.757220994567 |
| Sum Squared Residuals | 21775.3266086956 |
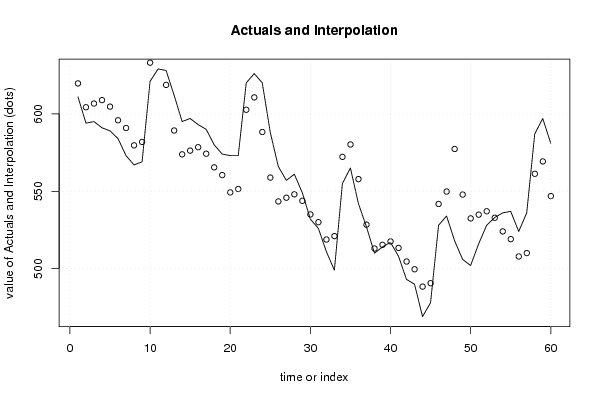
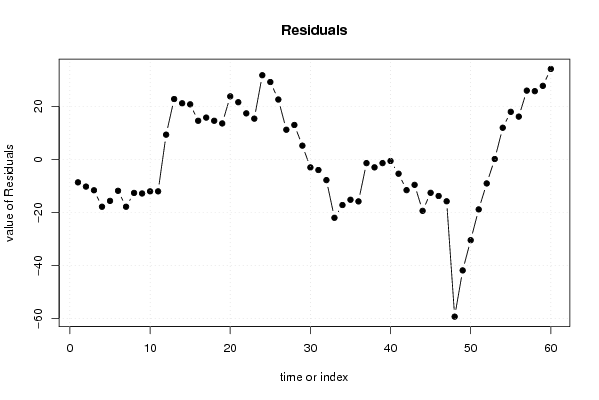
| Multiple Linear Regression - Actuals, Interpolation, and Residuals | |||
| Time or Index | Actuals | Interpolation Forecast | Residuals Prediction Error |
| 1 | 611 | 619.658086956522 | -8.65808695652151 |
| 2 | 594 | 604.258086956522 | -10.2580869565216 |
| 3 | 595 | 606.658086956522 | -11.6580869565218 |
| 4 | 591 | 608.858086956522 | -17.8580869565217 |
| 5 | 589 | 604.658086956522 | -15.6580869565218 |
| 6 | 584 | 595.858086956522 | -11.8580869565218 |
| 7 | 573 | 590.858086956522 | -17.8580869565218 |
| 8 | 567 | 579.658086956522 | -12.6580869565217 |
| 9 | 569 | 581.858086956522 | -12.8580869565217 |
| 10 | 621 | 633.058086956522 | -12.0580869565218 |
| 11 | 629 | 641.058086956522 | -12.0580869565218 |
| 12 | 628 | 618.681391304348 | 9.31860869565215 |
| 13 | 612 | 589.240695652174 | 22.759304347826 |
| 14 | 595 | 573.840695652174 | 21.159304347826 |
| 15 | 597 | 576.240695652174 | 20.7593043478261 |
| 16 | 593 | 578.440695652174 | 14.5593043478261 |
| 17 | 590 | 574.240695652174 | 15.7593043478261 |
| 18 | 580 | 565.440695652174 | 14.5593043478261 |
| 19 | 574 | 560.440695652174 | 13.5593043478261 |
| 20 | 573 | 549.240695652174 | 23.7593043478261 |
| 21 | 573 | 551.440695652174 | 21.5593043478261 |
| 22 | 620 | 602.640695652174 | 17.3593043478261 |
| 23 | 626 | 610.640695652174 | 15.3593043478261 |
| 24 | 620 | 588.264 | 31.736 |
| 25 | 588 | 558.823304347826 | 29.1766956521739 |
| 26 | 566 | 543.423304347826 | 22.5766956521739 |
| 27 | 557 | 545.823304347826 | 11.1766956521739 |
| 28 | 561 | 548.023304347826 | 12.9766956521739 |
| 29 | 549 | 543.823304347826 | 5.17669565217393 |
| 30 | 532 | 535.023304347826 | -3.02330434782607 |
| 31 | 526 | 530.023304347826 | -4.02330434782608 |
| 32 | 511 | 518.823304347826 | -7.8233043478261 |
| 33 | 499 | 521.023304347826 | -22.0233043478261 |
| 34 | 555 | 572.223304347826 | -17.2233043478261 |
| 35 | 565 | 580.223304347826 | -15.2233043478261 |
| 36 | 542 | 557.846608695652 | -15.8466086956522 |
| 37 | 527 | 528.405913043478 | -1.40591304347832 |
| 38 | 510 | 513.005913043478 | -3.00591304347824 |
| 39 | 514 | 515.405913043478 | -1.40591304347824 |
| 40 | 517 | 517.605913043478 | -0.60591304347824 |
| 41 | 508 | 513.405913043478 | -5.40591304347825 |
| 42 | 493 | 504.605913043478 | -11.6059130434782 |
| 43 | 490 | 499.605913043478 | -9.60591304347823 |
| 44 | 469 | 488.405913043478 | -19.4059130434783 |
| 45 | 478 | 490.605913043478 | -12.6059130434782 |
| 46 | 528 | 541.805913043478 | -13.8059130434783 |
| 47 | 534 | 549.805913043478 | -15.8059130434783 |
| 48 | 518 | 577.312695652174 | -59.3126956521739 |
| 49 | 506 | 547.872 | -41.8720000000001 |
| 50 | 502 | 532.472 | -30.472 |
| 51 | 516 | 534.872 | -18.872 |
| 52 | 528 | 537.072 | -9.0720 |
| 53 | 533 | 532.872 | 0.128000000000009 |
| 54 | 536 | 524.072 | 11.928 |
| 55 | 537 | 519.072 | 17.928 |
| 56 | 524 | 507.872 | 16.128 |
| 57 | 536 | 510.072 | 25.928 |
| 58 | 587 | 561.272 | 25.728 |
| 59 | 597 | 569.272 | 27.728 |
| 60 | 581 | 546.895304347826 | 34.1046956521739 |
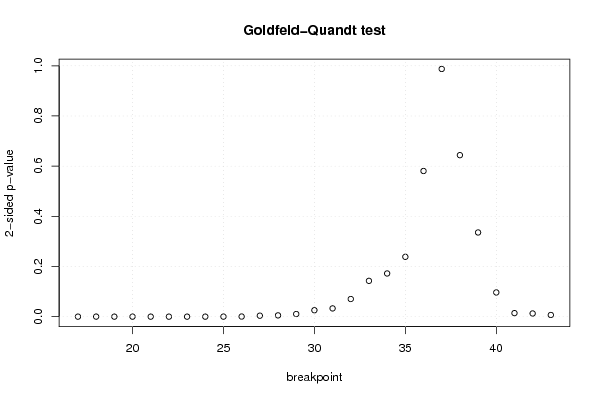
| Goldfeld-Quandt test for Heteroskedasticity | |||
| p-values | Alternative Hypothesis | ||
| breakpoint index | greater | 2-sided | less |
| 17 | 1.00872762296752e-05 | 2.01745524593504e-05 | 0.99998991272377 |
| 18 | 6.88981666961962e-05 | 0.000137796333392392 | 0.999931101833304 |
| 19 | 4.39749428598553e-06 | 8.79498857197107e-06 | 0.999995602505714 |
| 20 | 2.03112426922738e-06 | 4.06224853845476e-06 | 0.99999796887573 |
| 21 | 2.34205806664728e-07 | 4.68411613329457e-07 | 0.999999765794193 |
| 22 | 2.50951335990665e-08 | 5.01902671981329e-08 | 0.999999974904866 |
| 23 | 5.04519717219935e-09 | 1.00903943443987e-08 | 0.999999994954803 |
| 24 | 1.47067919612813e-08 | 2.94135839225625e-08 | 0.999999985293208 |
| 25 | 1.5714384797056e-05 | 3.1428769594112e-05 | 0.999984285615203 |
| 26 | 0.000204071896845698 | 0.000408143793691396 | 0.999795928103154 |
| 27 | 0.00191854358317781 | 0.00383708716635561 | 0.998081456416822 |
| 28 | 0.00256572899687426 | 0.00513145799374851 | 0.997434271003126 |
| 29 | 0.00524336815166266 | 0.0104867363033253 | 0.994756631848337 |
| 30 | 0.0127797894095258 | 0.0255595788190517 | 0.987220210590474 |
| 31 | 0.0164725390938951 | 0.0329450781877903 | 0.983527460906105 |
| 32 | 0.0351417881390867 | 0.0702835762781734 | 0.964858211860913 |
| 33 | 0.0713570283250445 | 0.142714056650089 | 0.928642971674956 |
| 34 | 0.0860731012657983 | 0.172146202531597 | 0.913926898734202 |
| 35 | 0.119258761632773 | 0.238517523265545 | 0.880741238367228 |
| 36 | 0.290303498304251 | 0.580606996608501 | 0.709696501695749 |
| 37 | 0.493699615585436 | 0.987399231170872 | 0.506300384414564 |
| 38 | 0.678130072900303 | 0.643739854199394 | 0.321869927099697 |
| 39 | 0.832207416072044 | 0.335585167855912 | 0.167792583927956 |
| 40 | 0.951759226676179 | 0.0964815466476426 | 0.0482407733238213 |
| 41 | 0.992988872206493 | 0.0140222555870133 | 0.00701112779350663 |
| 42 | 0.993669828687148 | 0.0126603426257048 | 0.00633017131285241 |
| 43 | 0.996689918195968 | 0.00662016360806474 | 0.00331008180403237 |
| Meta Analysis of Goldfeld-Quandt test for Heteroskedasticity | |||
| Description | # significant tests | % significant tests | OK/NOK |
| 1% type I error level | 13 | 0.481481481481481 | NOK |
| 5% type I error level | 18 | 0.666666666666667 | NOK |
| 10% type I error level | 20 | 0.740740740740741 | NOK |