| Multiple Linear Regression - Estimated Regression Equation |
| ICONS[t] = -18.1539021701522 + 0.0602404306508848WLH[t] + 0.993570813585798M1[t] -0.110854784071067M2[t] + 0.216847847952559M3[t] + 2.87227081439044M4[t] + 3.33974186695849M5[t] + 2.79275167569221M6[t] + 3.12286746541999M7[t] + 2.02406961867441M8[t] + 3.09876244196432M9[t] + 2.36623349453238M10[t] + 0.881923445207079M11[t] + e[t] |
| Multiple Linear Regression - Ordinary Least Squares | |||||
| Variable | Parameter | S.D. | T-STAT H0: parameter = 0 | 2-tail p-value | 1-tail p-value |
| (Intercept) | -18.1539021701522 | 15.837948 | -1.1462 | 0.257383 | 0.128691 |
| WLH | 0.0602404306508848 | 0.026219 | 2.2976 | 0.025985 | 0.012992 |
| M1 | 0.993570813585798 | 4.572973 | 0.2173 | 0.828919 | 0.414459 |
| M2 | -0.110854784071067 | 4.805827 | -0.0231 | 0.981693 | 0.490846 |
| M3 | 0.216847847952559 | 4.869506 | 0.0445 | 0.964665 | 0.482333 |
| M4 | 2.87227081439044 | 4.85743 | 0.5913 | 0.557084 | 0.278542 |
| M5 | 3.33974186695849 | 4.847051 | 0.689 | 0.494124 | 0.247062 |
| M6 | 2.79275167569221 | 4.867439 | 0.5738 | 0.568808 | 0.284404 |
| M7 | 3.12286746541999 | 4.917883 | 0.635 | 0.528442 | 0.264221 |
| M8 | 2.02406961867441 | 4.951108 | 0.4088 | 0.684496 | 0.342248 |
| M9 | 3.09876244196432 | 5.03713 | 0.6152 | 0.541339 | 0.270669 |
| M10 | 2.36623349453238 | 5.018993 | 0.4715 | 0.639451 | 0.319726 |
| M11 | 0.881923445207079 | 4.777569 | 0.1846 | 0.854323 | 0.427162 |
| Multiple Linear Regression - Regression Statistics | |
| Multiple R | 0.341778622777809 |
| R-squared | 0.116812626987896 |
| Adjusted R-squared | -0.103984216265131 |
| F-TEST (value) | 0.529050258449719 |
| F-TEST (DF numerator) | 12 |
| F-TEST (DF denominator) | 48 |
| p-value | 0.885066905782545 |
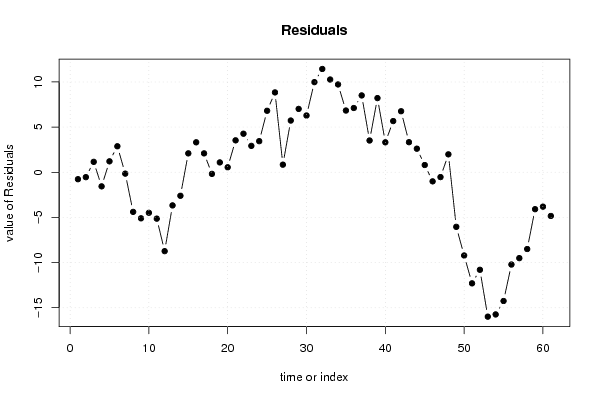
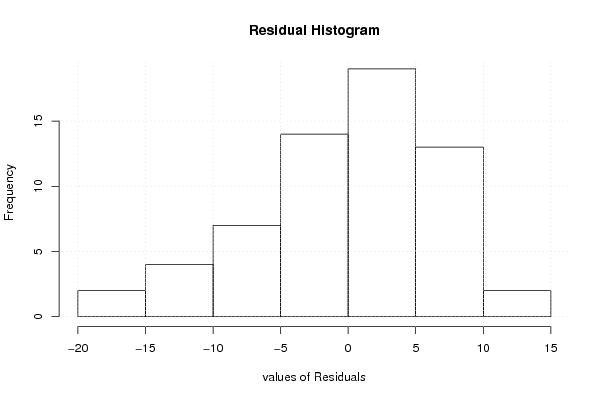
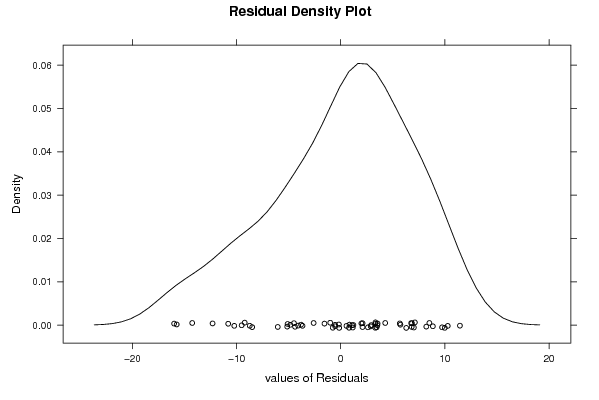
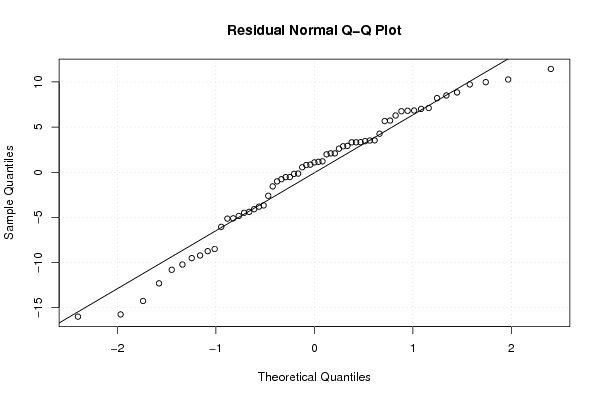
| Multiple Linear Regression - Residual Statistics | |
| Residual Standard Deviation | 7.54671563582109 |
| Sum Squared Residuals | 2733.74001062143 |
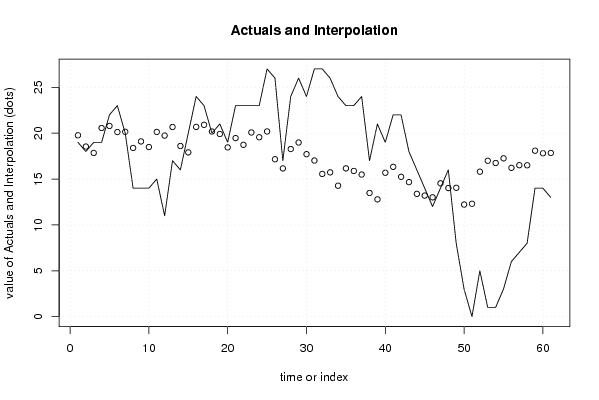
| Multiple Linear Regression - Actuals, Interpolation, and Residuals | |||
| Time or Index | Actuals | Interpolation Forecast | Residuals Prediction Error |
| 1 | 19 | 19.7670526324259 | -0.767052632425869 |
| 2 | 18 | 18.5421461734673 | -0.542146173467337 |
| 3 | 19 | 17.8457614844259 | 1.15423851557408 |
| 4 | 19 | 20.5614248815147 | -1.56142488151468 |
| 5 | 22 | 20.7879342114792 | 1.21206578852080 |
| 6 | 23 | 20.1204631589112 | 2.87953684108885 |
| 7 | 20 | 20.1493767953845 | -0.149376795384509 |
| 8 | 14 | 18.3879342114792 | -4.3879342114792 |
| 9 | 14 | 19.1011844508638 | -5.1011844508638 |
| 10 | 14 | 18.4891363647336 | -4.48913636473362 |
| 11 | 15 | 20.1373287092543 | -5.13732870925433 |
| 12 | 11 | 19.7373287092543 | -8.73732870925433 |
| 13 | 17 | 20.6706590921892 | -3.67065909218924 |
| 14 | 16 | 18.6023866041182 | -2.60238660411822 |
| 15 | 20 | 17.9060019150768 | 2.09399808492320 |
| 16 | 24 | 20.6819057428165 | 3.31809425718355 |
| 17 | 23 | 20.9084150727810 | 2.09158492721904 |
| 18 | 20 | 20.1807035895620 | -0.180703589562029 |
| 19 | 21 | 19.9084150727810 | 1.09158492721903 |
| 20 | 19 | 18.4481746421301 | 0.55182535786992 |
| 21 | 23 | 19.4626270347691 | 3.53737296523089 |
| 22 | 23 | 18.7300980873372 | 4.26990191266284 |
| 23 | 23 | 20.0770882786034 | 2.92291172139656 |
| 24 | 23 | 19.5566074173017 | 3.44339258269833 |
| 25 | 27 | 20.1887356469822 | 6.81126435301784 |
| 26 | 26 | 17.156616268497 | 8.84338373150301 |
| 27 | 17 | 16.1590294262011 | 0.840970573798854 |
| 28 | 24 | 18.2722885167811 | 5.72771148321894 |
| 29 | 26 | 18.9807212919527 | 7.01927870804735 |
| 30 | 24 | 17.7108459328758 | 6.28915406712425 |
| 31 | 27 | 17.0168744015385 | 9.9831255984615 |
| 32 | 27 | 15.5566339708876 | 11.4433660291124 |
| 33 | 26 | 15.7277203344143 | 10.2722796655857 |
| 34 | 24 | 14.2723062191717 | 9.72769378082831 |
| 35 | 23 | 16.1614602862959 | 6.83853971370407 |
| 36 | 23 | 15.8819411475977 | 7.1180588524023 |
| 37 | 24 | 15.4899820562132 | 8.51001794378684 |
| 38 | 17 | 13.4819499987930 | 3.51805000120698 |
| 39 | 21 | 12.7855653097516 | 8.2144346902484 |
| 40 | 19 | 15.681949998793 | 3.31805000120698 |
| 41 | 22 | 16.3301423433137 | 5.66985765668628 |
| 42 | 22 | 15.2409882761895 | 6.75901172381052 |
| 43 | 18 | 14.667497606154 | 3.33250239384601 |
| 44 | 16 | 13.3879784674558 | 2.61202153254424 |
| 45 | 14 | 13.1976222470771 | 0.802377752922909 |
| 46 | 12 | 13.0072571755031 | -1.00725717550311 |
| 47 | 14 | 14.5349686587220 | -0.534968658722045 |
| 48 | 16 | 14.0144877974203 | 1.98551220257972 |
| 49 | 8 | 14.0442117205919 | -6.04421172059192 |
| 50 | 3 | 12.2169009551244 | -9.21690095512444 |
| 51 | 0 | 12.3036418645445 | -12.3036418645445 |
| 52 | 5 | 15.8024308600948 | -10.8024308600948 |
| 53 | 1 | 16.9927870804735 | -15.9927870804735 |
| 54 | 1 | 16.7469990424616 | -15.7469990424616 |
| 55 | 3 | 17.2578361241420 | -14.2578361241420 |
| 56 | 6 | 16.2192787080473 | -10.2192787080473 |
| 57 | 7 | 16.5108459328758 | -9.51084593287576 |
| 58 | 8 | 16.5012021532544 | -8.50120215325442 |
| 59 | 14 | 18.0891540671242 | -4.08915406712425 |
| 60 | 14 | 17.8096349284260 | -3.80963492842602 |
| 61 | 13 | 17.8393588515977 | -4.83935885159765 |
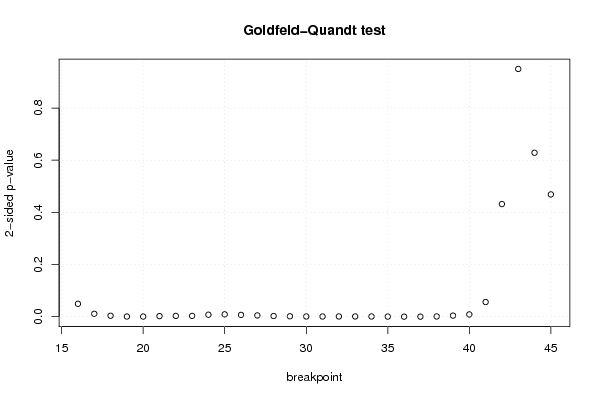
| Goldfeld-Quandt test for Heteroskedasticity | |||
| p-values | Alternative Hypothesis | ||
| breakpoint index | greater | 2-sided | less |
| 16 | 0.0247686257163056 | 0.0495372514326111 | 0.975231374283694 |
| 17 | 0.00563558177978008 | 0.0112711635595602 | 0.99436441822022 |
| 18 | 0.00185453401391643 | 0.00370906802783287 | 0.998145465986084 |
| 19 | 0.000368160417849792 | 0.000736320835699584 | 0.99963183958215 |
| 20 | 0.000326957538578018 | 0.000653915077156037 | 0.999673042461422 |
| 21 | 0.00118363994407974 | 0.00236727988815947 | 0.99881636005592 |
| 22 | 0.00157040889608225 | 0.0031408177921645 | 0.998429591103918 |
| 23 | 0.00161013364883733 | 0.00322026729767466 | 0.998389866351163 |
| 24 | 0.00388316825851215 | 0.00776633651702429 | 0.996116831741488 |
| 25 | 0.00459043768534291 | 0.00918087537068582 | 0.995409562314657 |
| 26 | 0.00345893735193995 | 0.0069178747038799 | 0.99654106264806 |
| 27 | 0.0025009781385619 | 0.0050019562771238 | 0.997499021861438 |
| 28 | 0.00130498446176677 | 0.00260996892353354 | 0.998695015538233 |
| 29 | 0.000818972893142173 | 0.00163794578628435 | 0.999181027106858 |
| 30 | 0.000484723034320581 | 0.000969446068641161 | 0.99951527696568 |
| 31 | 0.000425328975447299 | 0.000850657950894598 | 0.999574671024553 |
| 32 | 0.000545393788117125 | 0.00109078757623425 | 0.999454606211883 |
| 33 | 0.000543529923087983 | 0.00108705984617597 | 0.999456470076912 |
| 34 | 0.000467190979448097 | 0.000934381958896195 | 0.999532809020552 |
| 35 | 0.000286292972347416 | 0.000572585944694831 | 0.999713707027653 |
| 36 | 0.00014696530191611 | 0.00029393060383222 | 0.999853034698084 |
| 37 | 0.000166461968781079 | 0.000332923937562158 | 0.999833538031219 |
| 38 | 0.000527430562009913 | 0.00105486112401983 | 0.99947256943799 |
| 39 | 0.00211074520636553 | 0.00422149041273107 | 0.997889254793634 |
| 40 | 0.004391656610691 | 0.008783313221382 | 0.99560834338931 |
| 41 | 0.0281726808625868 | 0.0563453617251737 | 0.971827319137413 |
| 42 | 0.215971333988345 | 0.43194266797669 | 0.784028666011655 |
| 43 | 0.52502545856053 | 0.94994908287894 | 0.47497454143947 |
| 44 | 0.685688158301389 | 0.628623683397222 | 0.314311841698611 |
| 45 | 0.765490867997522 | 0.469018264004957 | 0.234509132002478 |
| Meta Analysis of Goldfeld-Quandt test for Heteroskedasticity | |||
| Description | # significant tests | % significant tests | OK/NOK |
| 1% type I error level | 23 | 0.766666666666667 | NOK |
| 5% type I error level | 25 | 0.833333333333333 | NOK |
| 10% type I error level | 26 | 0.866666666666667 | NOK |