| Multiple Linear Regression - Estimated Regression Equation |
| Y[t] = + 74.8625883971812 + 11.4579797137031X[t] + 0.883833817020301Y1[t] + 0.148925289542842Y2[t] + 0.0680524461895959Y3[t] -0.205609460525258Y4[t] -11.0093341354601M1[t] -19.3943249597428M2[t] -15.2870994860705M3[t] -19.6589724216698M4[t] -6.71985108689553M5[t] + 43.0948310810356M6[t] + 5.60929845146943M7[t] -25.8702298473568M8[t] -37.9817208725855M9[t] -24.3098501240444M10[t] -2.82506526052155M11[t] -0.36025434417029t + e[t] |
| Multiple Linear Regression - Ordinary Least Squares | |||||
| Variable | Parameter | S.D. | T-STAT H0: parameter = 0 | 2-tail p-value | 1-tail p-value |
| (Intercept) | 74.8625883971812 | 28.849903 | 2.5949 | 0.013372 | 0.006686 |
| X | 11.4579797137031 | 4.013511 | 2.8549 | 0.006938 | 0.003469 |
| Y1 | 0.883833817020301 | 0.150283 | 5.8811 | 1e-06 | 0 |
| Y2 | 0.148925289542842 | 0.205916 | 0.7232 | 0.473966 | 0.236983 |
| Y3 | 0.0680524461895959 | 0.206117 | 0.3302 | 0.743089 | 0.371544 |
| Y4 | -0.205609460525258 | 0.158492 | -1.2973 | 0.202354 | 0.101177 |
| M1 | -11.0093341354601 | 5.015681 | -2.195 | 0.034346 | 0.017173 |
| M2 | -19.3943249597428 | 6.208166 | -3.124 | 0.003408 | 0.001704 |
| M3 | -15.2870994860705 | 6.004905 | -2.5458 | 0.015082 | 0.007541 |
| M4 | -19.6589724216698 | 5.145907 | -3.8203 | 0.000479 | 0.00024 |
| M5 | -6.71985108689553 | 5.337035 | -1.2591 | 0.215675 | 0.107837 |
| M6 | 43.0948310810356 | 4.971288 | 8.6687 | 0 | 0 |
| M7 | 5.60929845146943 | 8.937398 | 0.6276 | 0.534006 | 0.267003 |
| M8 | -25.8702298473568 | 11.089177 | -2.3329 | 0.025046 | 0.012523 |
| M9 | -37.9817208725855 | 12.587194 | -3.0175 | 0.004531 | 0.002266 |
| M10 | -24.3098501240444 | 6.858964 | -3.5442 | 0.001063 | 0.000531 |
| M11 | -2.82506526052155 | 5.321118 | -0.5309 | 0.598567 | 0.299283 |
| t | -0.36025434417029 | 0.132882 | -2.7111 | 0.010012 | 0.005006 |
| Multiple Linear Regression - Regression Statistics | |
| Multiple R | 0.99217682046164 |
| R-squared | 0.984414843061367 |
| Adjusted R-squared | 0.977442536009874 |
| F-TEST (value) | 141.189255692705 |
| F-TEST (DF numerator) | 17 |
| F-TEST (DF denominator) | 38 |
| p-value | 0 |
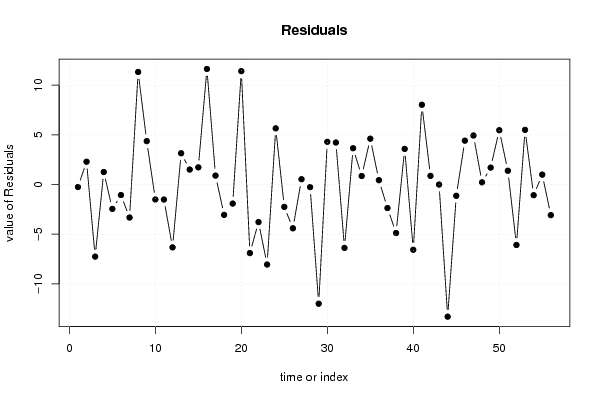
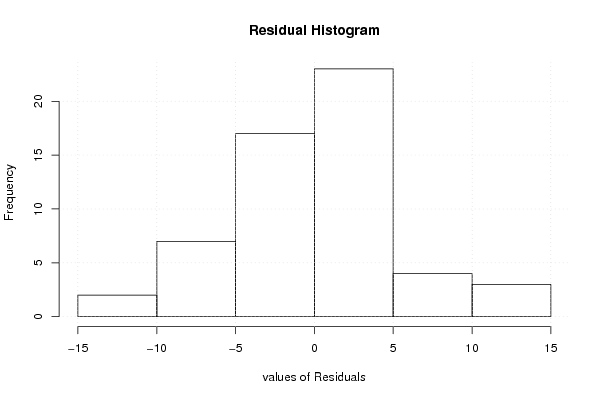
| Multiple Linear Regression - Residual Statistics | |
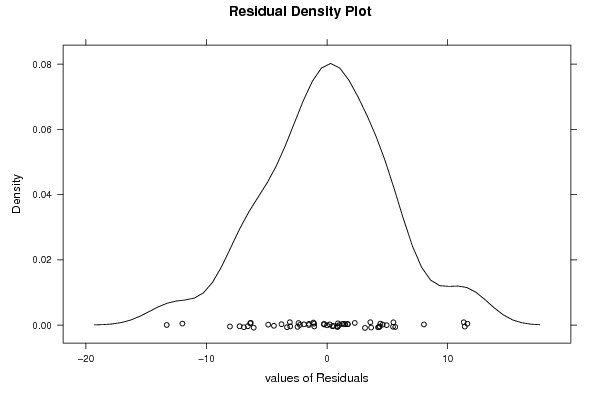
| Residual Standard Deviation | 6.26424626439006 |
| Sum Squared Residuals | 1491.14968791514 |
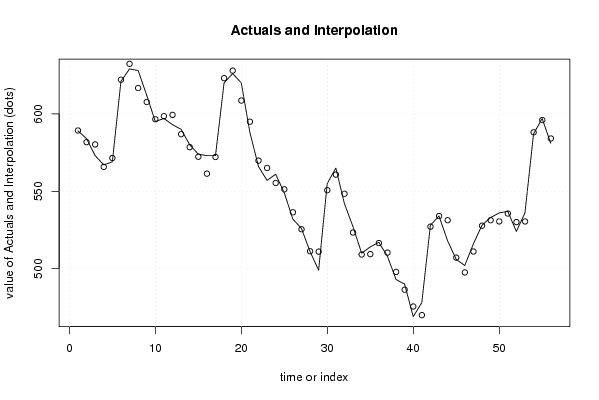
| Multiple Linear Regression - Actuals, Interpolation, and Residuals | |||
| Time or Index | Actuals | Interpolation Forecast | Residuals Prediction Error |
| 1 | 589 | 589.245105710227 | -0.24510571022708 |
| 2 | 584 | 581.699905024681 | 2.30009497531854 |
| 3 | 573 | 580.252037244713 | -7.25203724471278 |
| 4 | 567 | 565.739444479727 | 1.26055552027259 |
| 5 | 569 | 571.448087073341 | -2.44808707334080 |
| 6 | 621 | 622.056101188426 | -1.05610118842599 |
| 7 | 629 | 632.320912667471 | -3.32091266747108 |
| 8 | 628 | 616.665677272395 | 11.3343227276045 |
| 9 | 612 | 607.629008683127 | 4.37099131687261 |
| 10 | 595 | 596.503086347834 | -1.50308634783393 |
| 11 | 597 | 598.506709214764 | -1.50670921476426 |
| 12 | 593 | 599.32422816442 | -6.32422816441955 |
| 13 | 590 | 586.850014778975 | 3.14998522102536 |
| 14 | 580 | 578.489032722598 | 1.51096727740213 |
| 15 | 574 | 572.26746110746 | 1.73253889254049 |
| 16 | 573 | 561.361358533672 | 11.6386414663281 |
| 17 | 573 | 572.099143889678 | 0.900856110321654 |
| 18 | 620 | 623.052426352011 | -3.05242635201137 |
| 19 | 626 | 627.912433095191 | -1.912433095191 |
| 20 | 620 | 608.580751423355 | 11.4192485766449 |
| 21 | 588 | 594.898019860002 | -6.89801986000235 |
| 22 | 566 | 569.778072414917 | -3.77807241491693 |
| 23 | 557 | 565.050678254163 | -8.05067825416283 |
| 24 | 561 | 555.340606932473 | 5.65939306752667 |
| 25 | 549 | 551.248375035676 | -2.24837503567573 |
| 26 | 532 | 536.403761337 | -4.40376133699972 |
| 27 | 526 | 525.461149032128 | 0.538850967871723 |
| 28 | 511 | 511.255221731632 | -0.255221731632379 |
| 29 | 499 | 510.993451670755 | -11.9934516707547 |
| 30 | 555 | 550.695040498921 | 4.30495950107884 |
| 31 | 565 | 560.769713874115 | 4.23028612588497 |
| 32 | 542 | 548.375598169324 | -6.37559816932438 |
| 33 | 527 | 523.343178416807 | 3.65682158319268 |
| 34 | 510 | 509.13840057887 | 0.861599421130217 |
| 35 | 514 | 509.382575998121 | 4.61742400187866 |
| 36 | 517 | 516.559223159563 | 0.440776840437527 |
| 37 | 508 | 510.36408761182 | -2.36408761182013 |
| 38 | 493 | 497.878684572501 | -4.87868457250062 |
| 39 | 490 | 486.40954033728 | 3.59045966271964 |
| 40 | 469 | 475.562731866025 | -6.56273186602509 |
| 41 | 478 | 469.964011282458 | 8.03598871754243 |
| 42 | 528 | 527.125496948312 | 0.874503051688442 |
| 43 | 534 | 533.99945544307 | 0.00054455693001933 |
| 44 | 518 | 531.297190579777 | -13.2971905797772 |
| 45 | 506 | 507.129793040063 | -1.12979304006294 |
| 46 | 502 | 497.580440658379 | 4.41955934162064 |
| 47 | 516 | 511.060036532952 | 4.93996346704843 |
| 48 | 528 | 527.775941743545 | 0.224058256455356 |
| 49 | 533 | 531.292416863302 | 1.70758313669759 |
| 50 | 536 | 530.52861634322 | 5.47138365677967 |
| 51 | 537 | 535.609812278419 | 1.39018772158094 |
| 52 | 524 | 530.081243388943 | -6.0812433889432 |
| 53 | 536 | 530.495306083769 | 5.50469391623143 |
| 54 | 587 | 588.07093501233 | -1.07093501232992 |
| 55 | 597 | 595.997484920153 | 1.00251507984708 |
| 56 | 581 | 584.080782555148 | -3.08078255514783 |
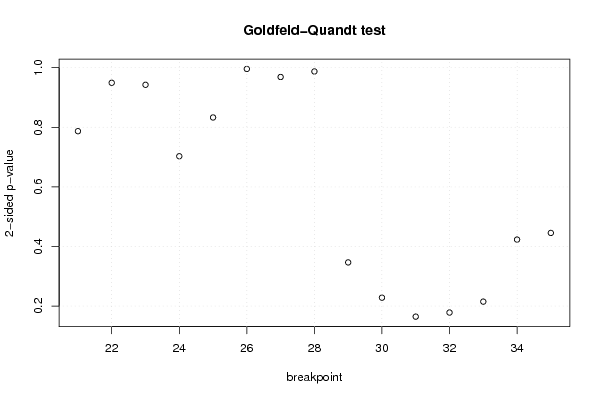
| Goldfeld-Quandt test for Heteroskedasticity | |||
| p-values | Alternative Hypothesis | ||
| breakpoint index | greater | 2-sided | less |
| 21 | 0.606506309819339 | 0.786987380361323 | 0.393493690180661 |
| 22 | 0.474646448401824 | 0.949292896803648 | 0.525353551598176 |
| 23 | 0.528723318493915 | 0.94255336301217 | 0.471276681506085 |
| 24 | 0.648569535479289 | 0.702860929041423 | 0.351430464520711 |
| 25 | 0.583525261375705 | 0.83294947724859 | 0.416474738624295 |
| 26 | 0.497872737370282 | 0.995745474740564 | 0.502127262629718 |
| 27 | 0.484382020809901 | 0.968764041619802 | 0.515617979190099 |
| 28 | 0.493660694000248 | 0.987321388000497 | 0.506339305999752 |
| 29 | 0.82666241158816 | 0.346675176823681 | 0.173337588411841 |
| 30 | 0.885836068789186 | 0.228327862421628 | 0.114163931210814 |
| 31 | 0.917661970947672 | 0.164676058104655 | 0.0823380290523276 |
| 32 | 0.910775035534181 | 0.178449928931638 | 0.0892249644658191 |
| 33 | 0.89245834951256 | 0.215083300974881 | 0.107541650487441 |
| 34 | 0.788390039480544 | 0.423219921038911 | 0.211609960519456 |
| 35 | 0.777215870358072 | 0.445568259283855 | 0.222784129641928 |
| Meta Analysis of Goldfeld-Quandt test for Heteroskedasticity | |||
| Description | # significant tests | % significant tests | OK/NOK |
| 1% type I error level | 0 | 0 | OK |
| 5% type I error level | 0 | 0 | OK |
| 10% type I error level | 0 | 0 | OK |