| Multiple Linear Regression - Estimated Regression Equation |
| Y[t] = + 6.8925548273832 -0.450048120480993X[t] -0.078750036721978M1[t] -0.120513226375429M2[t] -0.109860556364419M3[t] -0.177209811172647M4[t] -0.115558103571256M5[t] -0.162907358379485M6[t] -0.152254688368474M7[t] -0.112601055947844M8[t] -0.0939560852137923M9[t] -0.00130534002202076M10[t] -0.0176555572398699M11[t] + 0.0383482923986091t + e[t] |
| Multiple Linear Regression - Ordinary Least Squares | |||||
| Variable | Parameter | S.D. | T-STAT H0: parameter = 0 | 2-tail p-value | 1-tail p-value |
| (Intercept) | 6.8925548273832 | 0.201041 | 34.2843 | 0 | 0 |
| X | -0.450048120480993 | 0.066701 | -6.7473 | 0 | 0 |
| M1 | -0.078750036721978 | 0.191341 | -0.4116 | 0.682527 | 0.341263 |
| M2 | -0.120513226375429 | 0.200525 | -0.601 | 0.550735 | 0.275367 |
| M3 | -0.109860556364419 | 0.200315 | -0.5484 | 0.585986 | 0.292993 |
| M4 | -0.177209811172647 | 0.20001 | -0.886 | 0.380127 | 0.190063 |
| M5 | -0.115558103571256 | 0.199794 | -0.5784 | 0.565765 | 0.282882 |
| M6 | -0.162907358379485 | 0.19956 | -0.8163 | 0.418428 | 0.209214 |
| M7 | -0.152254688368474 | 0.199444 | -0.7634 | 0.449042 | 0.224521 |
| M8 | -0.112601055947844 | 0.199418 | -0.5646 | 0.574998 | 0.287499 |
| M9 | -0.0939560852137923 | 0.199101 | -0.4719 | 0.639181 | 0.319591 |
| M10 | -0.00130534002202076 | 0.199043 | -0.0066 | 0.994795 | 0.497398 |
| M11 | -0.0176555572398699 | 0.199055 | -0.0887 | 0.9297 | 0.46485 |
| t | 0.0383482923986091 | 0.002348 | 16.3305 | 0 | 0 |
| Multiple Linear Regression - Regression Statistics | |
| Multiple R | 0.931216785308685 |
| R-squared | 0.867164701240642 |
| Adjusted R-squared | 0.830423022860394 |
| F-TEST (value) | 23.6016627293439 |
| F-TEST (DF numerator) | 13 |
| F-TEST (DF denominator) | 47 |
| p-value | 2.22044604925031e-16 |
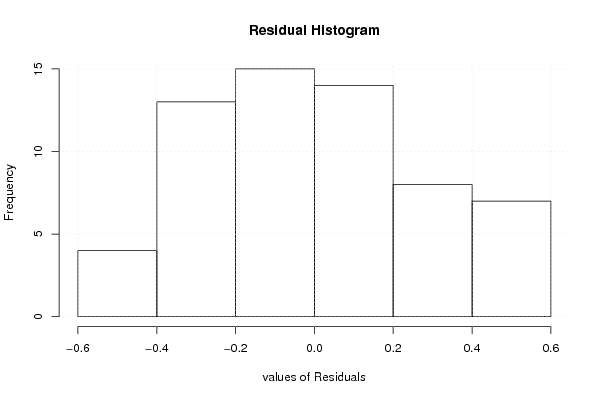
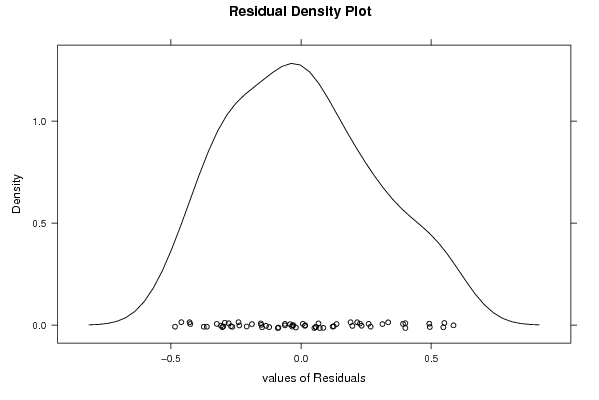
| Multiple Linear Regression - Residual Statistics | |
| Residual Standard Deviation | 0.314614031618701 |
| Sum Squared Residuals | 4.65215347789455 |
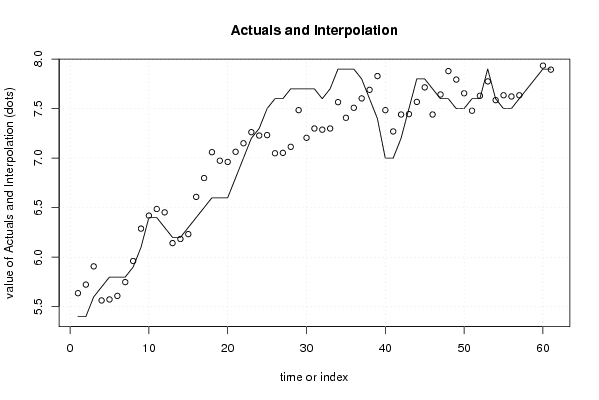
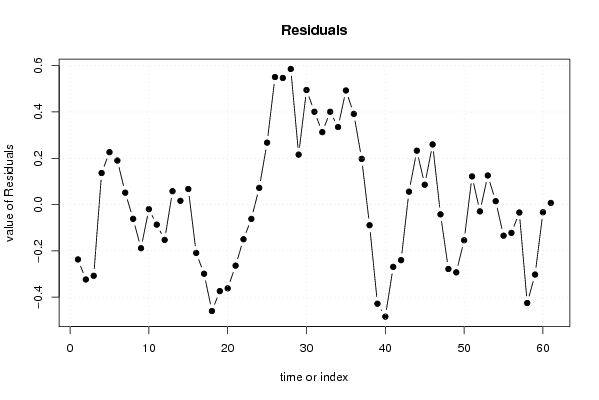
| Multiple Linear Regression - Actuals, Interpolation, and Residuals | |||
| Time or Index | Actuals | Interpolation Forecast | Residuals Prediction Error |
| 1 | 5.4 | 5.63702315776115 | -0.237023157761147 |
| 2 | 5.4 | 5.7236178846025 | -0.323617884602503 |
| 3 | 5.6 | 5.90763328315642 | -0.307633283156423 |
| 4 | 5.7 | 5.56359863641011 | 0.136401363589894 |
| 5 | 5.8 | 5.57358901231391 | 0.226410987686092 |
| 6 | 5.8 | 5.60959286195239 | 0.190407138047613 |
| 7 | 5.8 | 5.7486034484582 | 0.0513965515417942 |
| 8 | 5.9 | 5.96161980942174 | -0.0616198094217432 |
| 9 | 6.1 | 6.288641944843 | -0.188641944843001 |
| 10 | 6.4 | 6.41964098243338 | -0.0196409824333802 |
| 11 | 6.4 | 6.48664386966224 | -0.08664386966224 |
| 12 | 6.3 | 6.45263809520452 | -0.152638095204521 |
| 13 | 6.2 | 6.14220747859255 | 0.0577925214074454 |
| 14 | 6.2 | 6.18379739338581 | 0.0162026066141876 |
| 15 | 6.3 | 6.23279835579543 | 0.067201644204567 |
| 16 | 6.4 | 6.60884070181871 | -0.208840701818707 |
| 17 | 6.5 | 6.79885032591491 | -0.298850325914906 |
| 18 | 6.6 | 7.05987823579388 | -0.459878235793882 |
| 19 | 6.6 | 6.9738647620592 | -0.373864762059204 |
| 20 | 6.6 | 6.96185706278225 | -0.361857062782245 |
| 21 | 6.8 | 7.063855137963 | -0.263855137963005 |
| 22 | 7 | 7.14984936350529 | -0.149849363505286 |
| 23 | 7.2 | 7.26185706278225 | -0.0618570627822449 |
| 24 | 7.3 | 7.22785128832453 | 0.0721487116754742 |
| 25 | 7.5 | 7.23245435604926 | 0.267545643950744 |
| 26 | 7.6 | 7.04902021060202 | 0.550979789397982 |
| 27 | 7.6 | 7.05301636096354 | 0.546983639036462 |
| 28 | 7.7 | 7.11402502265012 | 0.585974977349883 |
| 29 | 7.7 | 7.48405389493871 | 0.215946105061288 |
| 30 | 7.7 | 7.2050240602405 | 0.494975939759504 |
| 31 | 7.7 | 7.29902983469822 | 0.400970165301784 |
| 32 | 7.6 | 7.28702213542126 | 0.312977864578743 |
| 33 | 7.7 | 7.29901058650582 | 0.400989413494182 |
| 34 | 7.9 | 7.5650240602405 | 0.334975939759503 |
| 35 | 7.9 | 7.40700288722886 | 0.492997112771141 |
| 36 | 7.9 | 7.50801154891544 | 0.391988451084562 |
| 37 | 7.8 | 7.60262424073637 | 0.197375759263633 |
| 38 | 7.6 | 7.68921896757772 | -0.0892189675777252 |
| 39 | 7.4 | 7.82822955408354 | -0.428229554083542 |
| 40 | 7 | 7.48419490733723 | -0.484194907337228 |
| 41 | 7 | 7.26916122300053 | -0.269161223000532 |
| 42 | 7.2 | 7.44017950878331 | -0.240179508783310 |
| 43 | 7.5 | 7.44417565914483 | 0.0558243408551698 |
| 44 | 7.8 | 7.56718239601217 | 0.23281760398783 |
| 45 | 7.8 | 7.71418528324103 | 0.0858147167589713 |
| 46 | 7.7 | 7.44014101239852 | 0.259858987601485 |
| 47 | 7.6 | 7.64215833577167 | -0.0421583357716732 |
| 48 | 7.6 | 7.87818143360255 | -0.278181433602549 |
| 49 | 7.5 | 7.79277487723108 | -0.292774877231081 |
| 50 | 7.5 | 7.65434554383194 | -0.154345543831942 |
| 51 | 7.6 | 7.47832244600106 | 0.121677553998935 |
| 52 | 7.6 | 7.62934073178384 | -0.0293407317838426 |
| 53 | 7.9 | 7.77434554383194 | 0.125654456168059 |
| 54 | 7.6 | 7.58532533322992 | 0.0146746667700755 |
| 55 | 7.5 | 7.63432629563954 | -0.134326295639544 |
| 56 | 7.5 | 7.62231859636259 | -0.122318596362585 |
| 57 | 7.6 | 7.63430704744715 | -0.0343070474471465 |
| 58 | 7.7 | 8.12534458142232 | -0.425344581422321 |
| 59 | 7.8 | 8.10233784455498 | -0.302337844554983 |
| 60 | 7.9 | 7.93331763395297 | -0.0333176339529647 |
| 61 | 7.9 | 7.8929158896296 | 0.00708411037040462 |
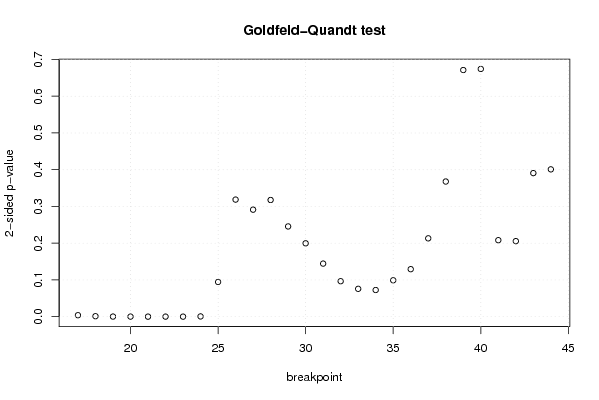
| Goldfeld-Quandt test for Heteroskedasticity | |||
| p-values | Alternative Hypothesis | ||
| breakpoint index | greater | 2-sided | less |
| 17 | 0.00198464167413135 | 0.00396928334826271 | 0.998015358325869 |
| 18 | 0.000617576502372809 | 0.00123515300474562 | 0.999382423497627 |
| 19 | 0.000125603039414816 | 0.000251206078829633 | 0.999874396960585 |
| 20 | 3.82999762714679e-05 | 7.65999525429358e-05 | 0.999961700023729 |
| 21 | 1.26262254316843e-05 | 2.52524508633686e-05 | 0.999987373774568 |
| 22 | 3.25860107898704e-05 | 6.51720215797408e-05 | 0.99996741398921 |
| 23 | 1.61640286270093e-05 | 3.23280572540187e-05 | 0.999983835971373 |
| 24 | 0.000330199504044968 | 0.000660399008089937 | 0.999669800495955 |
| 25 | 0.0472012981135872 | 0.0944025962271745 | 0.952798701886413 |
| 26 | 0.159315392088676 | 0.318630784177352 | 0.840684607911324 |
| 27 | 0.145592163332535 | 0.291184326665070 | 0.854407836667465 |
| 28 | 0.158773372309474 | 0.317546744618949 | 0.841226627690526 |
| 29 | 0.122792973376730 | 0.245585946753459 | 0.87720702662327 |
| 30 | 0.0998057929354351 | 0.199611585870870 | 0.900194207064565 |
| 31 | 0.0721978302314872 | 0.144395660462974 | 0.927802169768513 |
| 32 | 0.0482364357179944 | 0.0964728714359887 | 0.951763564282006 |
| 33 | 0.0378871303796205 | 0.075774260759241 | 0.96211286962038 |
| 34 | 0.0362705351806255 | 0.072541070361251 | 0.963729464819374 |
| 35 | 0.0495148974697147 | 0.0990297949394293 | 0.950485102530285 |
| 36 | 0.0646274518780188 | 0.129254903756038 | 0.935372548121981 |
| 37 | 0.106592736410558 | 0.213185472821116 | 0.893407263589442 |
| 38 | 0.183895202370513 | 0.367790404741025 | 0.816104797629488 |
| 39 | 0.335591986572442 | 0.671183973144884 | 0.664408013427558 |
| 40 | 0.662911044070297 | 0.674177911859406 | 0.337088955929703 |
| 41 | 0.895943402009774 | 0.208113195980453 | 0.104056597990226 |
| 42 | 0.897221859586564 | 0.205556280826873 | 0.102778140413436 |
| 43 | 0.804656957208392 | 0.390686085583217 | 0.195343042791608 |
| 44 | 0.799529133474322 | 0.400941733051356 | 0.200470866525678 |
| Meta Analysis of Goldfeld-Quandt test for Heteroskedasticity | |||
| Description | # significant tests | % significant tests | OK/NOK |
| 1% type I error level | 8 | 0.285714285714286 | NOK |
| 5% type I error level | 8 | 0.285714285714286 | NOK |
| 10% type I error level | 13 | 0.464285714285714 | NOK |