| Multiple Linear Regression - Estimated Regression Equation |
| ICONS[t] = + 52.0164275074887 -0.0414585275913714WLH[t] -1.08025189735549M1[t] -5.10599152463905M2[t] -6.0625749461278M3[t] -2.88119657649014M4[t] -1.90810991237075M5[t] -2.60035782483614M6[t] -2.88331496422184M7[t] -4.20872969876033M8[t] -3.99118730436532M9[t] -4.21810064024594M10[t] -0.213546124149344M11[t] -0.28187790341837t + e[t] |
| Multiple Linear Regression - Ordinary Least Squares | |||||
| Variable | Parameter | S.D. | T-STAT H0: parameter = 0 | 2-tail p-value | 1-tail p-value |
| (Intercept) | 52.0164275074887 | 23.892195 | 2.1771 | 0.034527 | 0.017263 |
| WLH | -0.0414585275913714 | 0.036427 | -1.1381 | 0.26083 | 0.130415 |
| M1 | -1.08025189735549 | 4.120547 | -0.2622 | 0.794342 | 0.397171 |
| M2 | -5.10599152463905 | 4.502715 | -1.134 | 0.262554 | 0.131277 |
| M3 | -6.0625749461278 | 4.675074 | -1.2968 | 0.201035 | 0.100518 |
| M4 | -2.88119657649014 | 4.613657 | -0.6245 | 0.535324 | 0.267662 |
| M5 | -1.90810991237075 | 4.559214 | -0.4185 | 0.677475 | 0.338738 |
| M6 | -2.60035782483614 | 4.589188 | -0.5666 | 0.573664 | 0.286832 |
| M7 | -2.88331496422184 | 4.68833 | -0.615 | 0.541522 | 0.270761 |
| M8 | -4.20872969876033 | 4.738206 | -0.8883 | 0.378928 | 0.189464 |
| M9 | -3.99118730436532 | 4.898516 | -0.8148 | 0.419311 | 0.209655 |
| M10 | -4.21810064024594 | 4.830029 | -0.8733 | 0.386936 | 0.193468 |
| M11 | -0.213546124149344 | 4.274209 | -0.05 | 0.960365 | 0.480182 |
| t | -0.28187790341837 | 0.07738 | -3.6428 | 0.000671 | 0.000336 |
| Multiple Linear Regression - Regression Statistics | |
| Multiple R | 0.55791164972303 |
| R-squared | 0.311265408896673 |
| Adjusted R-squared | 0.120764351782986 |
| F-TEST (value) | 1.63393008738485 |
| F-TEST (DF numerator) | 13 |
| F-TEST (DF denominator) | 47 |
| p-value | 0.109387943459274 |
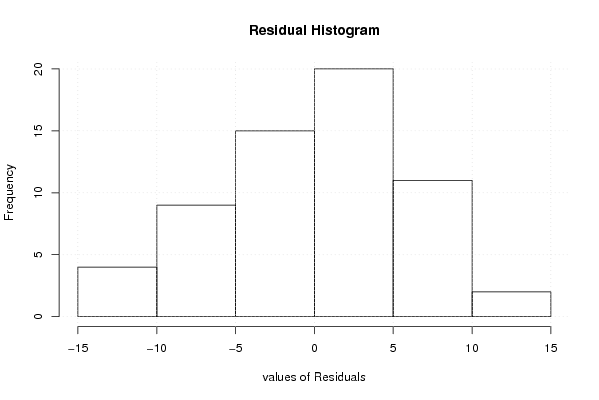
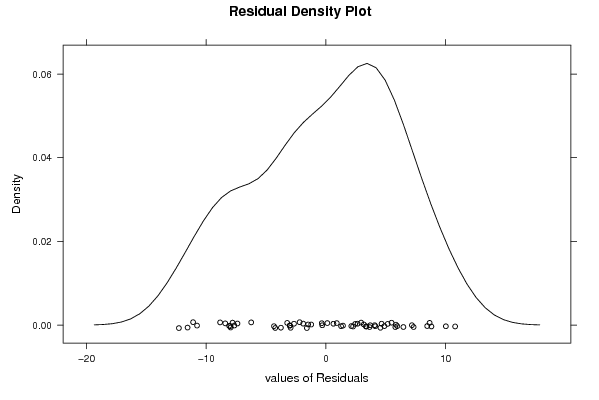
| Multiple Linear Regression - Residual Statistics | |
| Residual Standard Deviation | 6.73486969870926 |
| Sum Squared Residuals | 2131.84808335383 |
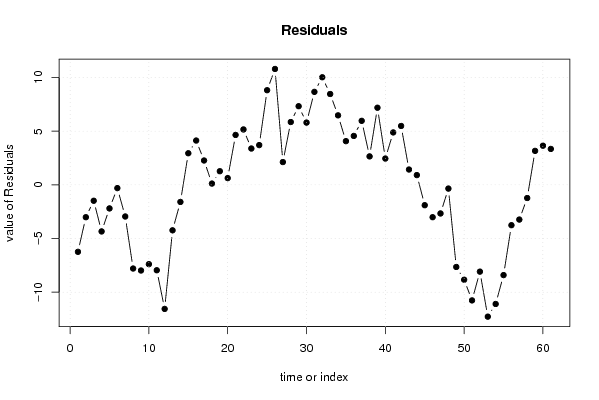
| Multiple Linear Regression - Actuals, Interpolation, and Residuals | |||
| Time or Index | Actuals | Interpolation Forecast | Residuals Prediction Error |
| 1 | 19 | 25.2402202932042 | -6.24022029320423 |
| 2 | 18 | 21.015519817685 | -3.015519817685 |
| 3 | 19 | 20.4818534618312 | -1.48185346183120 |
| 4 | 19 | 23.3398954004591 | -4.33989540045913 |
| 5 | 22 | 24.1969382715256 | -2.19693827152562 |
| 6 | 23 | 23.3057295108246 | -0.305729510824605 |
| 7 | 20 | 22.9481871059774 | -2.9481871059774 |
| 8 | 14 | 21.7969382715256 | -7.79693827152563 |
| 9 | 14 | 21.9813539280505 | -7.98135392805049 |
| 10 | 14 | 21.3896456335688 | -7.38964563356877 |
| 11 | 15 | 22.9564788114957 | -7.95647881149567 |
| 12 | 11 | 22.5564788114957 | -11.5564788114957 |
| 13 | 17 | 21.2358075383132 | -4.23580753831319 |
| 14 | 16 | 17.5915264490732 | -1.5915264490732 |
| 15 | 20 | 17.0578600932194 | 2.94213990678061 |
| 16 | 24 | 19.8744435042559 | 4.12555649574406 |
| 17 | 23 | 20.7314863753224 | 2.26851362467756 |
| 18 | 20 | 19.8817361422128 | 0.118263857787203 |
| 19 | 21 | 19.7314863753224 | 1.26851362467756 |
| 20 | 19 | 18.3729449029138 | 0.62705509708619 |
| 21 | 23 | 18.3500679214818 | 4.64993207851818 |
| 22 | 23 | 17.8412766821828 | 5.15872331781716 |
| 23 | 23 | 19.6154024980666 | 3.38459750193340 |
| 24 | 23 | 19.2983195532493 | 3.70168044675065 |
| 25 | 27 | 18.1849409180237 | 8.81505908197628 |
| 26 | 26 | 15.2039962702457 | 10.7960037297543 |
| 27 | 17 | 14.8776225523487 | 2.12237744765128 |
| 28 | 24 | 18.1502497668904 | 5.84975023310964 |
| 29 | 26 | 18.6756244172259 | 7.32437558277411 |
| 30 | 24 | 18.1990009324386 | 5.80099906756142 |
| 31 | 27 | 18.3389608586878 | 8.66103914131218 |
| 32 | 27 | 16.9804193862792 | 10.0195806137208 |
| 33 | 26 | 17.5379617911264 | 8.4620382088736 |
| 34 | 24 | 17.5266728829239 | 6.47332711707611 |
| 35 | 23 | 18.9276719504853 | 4.0723280495147 |
| 36 | 23 | 18.4447548953026 | 4.55524510469744 |
| 37 | 24 | 18.0361712291303 | 5.96382877086975 |
| 38 | 17 | 14.3504316122989 | 2.64956838770111 |
| 39 | 21 | 13.8167652564451 | 7.18323474355492 |
| 40 | 19 | 16.5504316122989 | 2.44956838770112 |
| 41 | 22 | 17.1172647902258 | 4.88273520977421 |
| 42 | 22 | 16.5162657226644 | 5.48373427733563 |
| 43 | 18 | 16.5733085937309 | 1.42669140626912 |
| 44 | 16 | 15.0903915385481 | 0.90960846145187 |
| 45 | 14 | 15.8966851089436 | -1.89668510894357 |
| 46 | 12 | 15.0147671213222 | -3.01476712132224 |
| 47 | 14 | 16.6645173544319 | -2.66451735443189 |
| 48 | 16 | 16.3474344096146 | -0.347434409614636 |
| 49 | 8 | 15.6486410503027 | -7.64864105030273 |
| 50 | 3 | 11.8385258506972 | -8.83852585069725 |
| 51 | 0 | 10.7658986361556 | -10.7658986361556 |
| 52 | 5 | 13.0849797160957 | -8.0849797160957 |
| 53 | 1 | 13.2786861457003 | -12.2786861457003 |
| 54 | 1 | 12.0972676918596 | -11.0972676918596 |
| 55 | 3 | 11.4080570662815 | -8.40805706628146 |
| 56 | 6 | 9.75930590073324 | -3.75930590073324 |
| 57 | 7 | 10.2339312503977 | -3.2339312503977 |
| 58 | 8 | 9.22763768000226 | -1.22763768000226 |
| 59 | 14 | 10.8359293855205 | 3.16407061447946 |
| 60 | 14 | 10.3530123303378 | 3.64698766966221 |
| 61 | 13 | 9.65421897102589 | 3.34578102897411 |
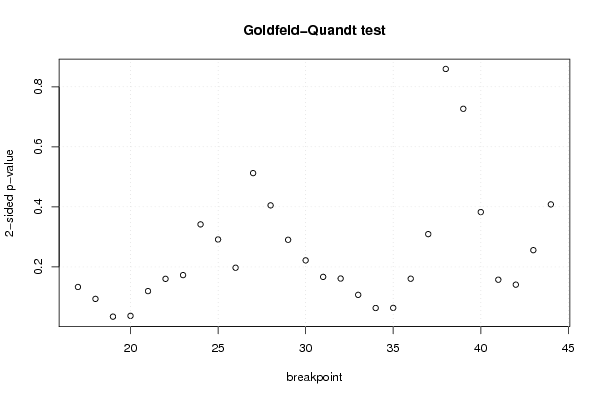
| Goldfeld-Quandt test for Heteroskedasticity | |||
| p-values | Alternative Hypothesis | ||
| breakpoint index | greater | 2-sided | less |
| 17 | 0.0665494116213896 | 0.133098823242779 | 0.93345058837861 |
| 18 | 0.0467317846533482 | 0.0934635693066963 | 0.953268215346652 |
| 19 | 0.0171465417843441 | 0.0342930835686882 | 0.982853458215656 |
| 20 | 0.0184751518230795 | 0.0369503036461590 | 0.98152484817692 |
| 21 | 0.0597116160559135 | 0.119423232111827 | 0.940288383944087 |
| 22 | 0.0801144723153368 | 0.160228944630674 | 0.919885527684663 |
| 23 | 0.0863441537806037 | 0.172688307561207 | 0.913655846219396 |
| 24 | 0.170820359688203 | 0.341640719376406 | 0.829179640311797 |
| 25 | 0.145674181163036 | 0.291348362326072 | 0.854325818836964 |
| 26 | 0.098608816625283 | 0.197217633250566 | 0.901391183374717 |
| 27 | 0.256186637724912 | 0.512373275449823 | 0.743813362275088 |
| 28 | 0.202481258016611 | 0.404962516033222 | 0.797518741983389 |
| 29 | 0.145133573339623 | 0.290267146679246 | 0.854866426660377 |
| 30 | 0.110866809616557 | 0.221733619233115 | 0.889133190383443 |
| 31 | 0.0833771979175793 | 0.166754395835159 | 0.91662280208242 |
| 32 | 0.080613620116537 | 0.161227240233074 | 0.919386379883463 |
| 33 | 0.0534478355271642 | 0.106895671054328 | 0.946552164472836 |
| 34 | 0.0315459147490305 | 0.063091829498061 | 0.96845408525097 |
| 35 | 0.0317212909458534 | 0.0634425818917068 | 0.968278709054147 |
| 36 | 0.0803405641863101 | 0.160681128372620 | 0.91965943581369 |
| 37 | 0.154597268819426 | 0.309194537638852 | 0.845402731180574 |
| 38 | 0.429658193695983 | 0.859316387391966 | 0.570341806304017 |
| 39 | 0.363296029172209 | 0.726592058344417 | 0.636703970827791 |
| 40 | 0.808682399888606 | 0.382635200222788 | 0.191317600111394 |
| 41 | 0.921349665818876 | 0.157300668362249 | 0.0786503341811245 |
| 42 | 0.929591101478566 | 0.140817797042868 | 0.0704088985214338 |
| 43 | 0.872115776804874 | 0.255768446390251 | 0.127884223195126 |
| 44 | 0.79587877985539 | 0.408242440289222 | 0.204121220144611 |
| Meta Analysis of Goldfeld-Quandt test for Heteroskedasticity | |||
| Description | # significant tests | % significant tests | OK/NOK |
| 1% type I error level | 0 | 0 | OK |
| 5% type I error level | 2 | 0.0714285714285714 | NOK |
| 10% type I error level | 5 | 0.178571428571429 | NOK |