| Multiple Linear Regression - Estimated Regression Equation |
| Y[t] = + 32.0112178808194 + 12.8517679356726X[t] + 0.912623590451367Y1[t] + 0.0121064299814901Y2[t] + 16.312803980732M1[t] + 16.7900026964816M2[t] + 10.8342316766507M3[t] + 6.12167292170496M4[t] + 9.48466383471706M5[t] + 3.23537468192878M6[t] + 15.9983473560093M7[t] + 65.6072237839268M8[t] + 27.1353181179752M9[t] + 4.52518290329523M10[t] -2.53197257686806M11[t] -0.281056311117769t + e[t] |
| Multiple Linear Regression - Ordinary Least Squares | |||||
| Variable | Parameter | S.D. | T-STAT H0: parameter = 0 | 2-tail p-value | 1-tail p-value |
| (Intercept) | 32.0112178808194 | 26.746814 | 1.1968 | 0.238087 | 0.119044 |
| X | 12.8517679356726 | 3.576842 | 3.593 | 0.000851 | 0.000425 |
| Y1 | 0.912623590451367 | 0.150369 | 6.0692 | 0 | 0 |
| Y2 | 0.0121064299814901 | 0.15013 | 0.0806 | 0.936111 | 0.468056 |
| M1 | 16.312803980732 | 4.325219 | 3.7716 | 0.000502 | 0.000251 |
| M2 | 16.7900026964816 | 5.357977 | 3.1336 | 0.003144 | 0.001572 |
| M3 | 10.8342316766507 | 5.316689 | 2.0378 | 0.047903 | 0.023952 |
| M4 | 6.12167292170496 | 4.810217 | 1.2726 | 0.210146 | 0.105073 |
| M5 | 9.48466383471706 | 4.566352 | 2.0771 | 0.043948 | 0.021974 |
| M6 | 3.23537468192878 | 4.825293 | 0.6705 | 0.506207 | 0.253104 |
| M7 | 15.9983473560093 | 4.560623 | 3.5079 | 0.00109 | 0.000545 |
| M8 | 65.6072237839268 | 5.464229 | 12.0067 | 0 | 0 |
| M9 | 27.1353181179752 | 11.333842 | 2.3942 | 0.021199 | 0.010599 |
| M10 | 4.52518290329523 | 5.787825 | 0.7818 | 0.438691 | 0.219346 |
| M11 | -2.53197257686806 | 4.613779 | -0.5488 | 0.586059 | 0.293029 |
| t | -0.281056311117769 | 0.12654 | -2.2211 | 0.031792 | 0.015896 |
| Multiple Linear Regression - Regression Statistics | |
| Multiple R | 0.99150564049245 |
| R-squared | 0.983083435128344 |
| Adjusted R-squared | 0.977041804817038 |
| F-TEST (value) | 162.718237375218 |
| F-TEST (DF numerator) | 15 |
| F-TEST (DF denominator) | 42 |
| p-value | 0 |
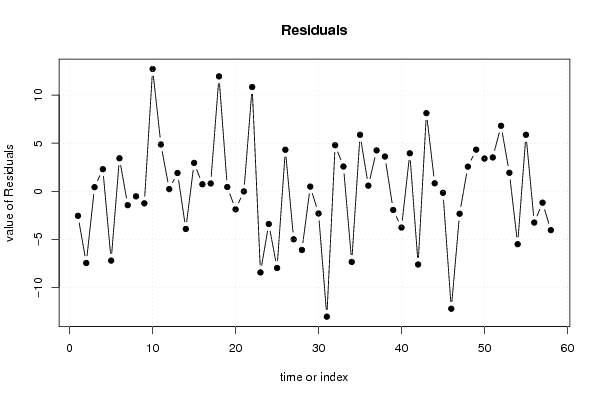
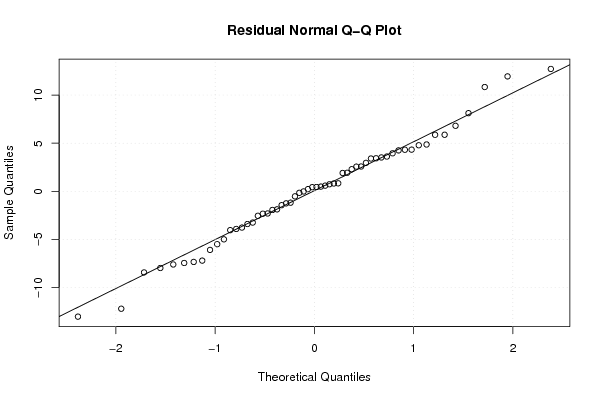
| Multiple Linear Regression - Residual Statistics | |
| Residual Standard Deviation | 6.3018287623476 |
| Sum Squared Residuals | 1667.94792149796 |
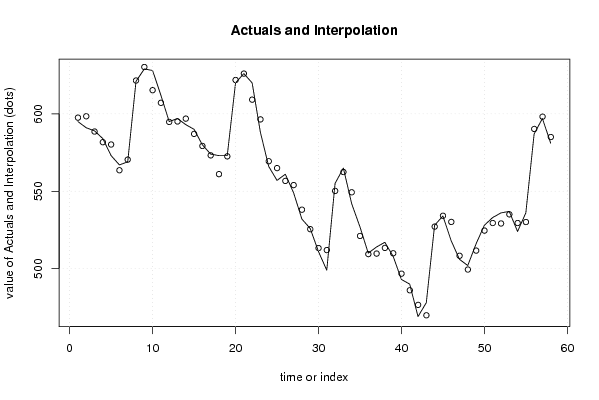
| Multiple Linear Regression - Actuals, Interpolation, and Residuals | |||
| Time or Index | Actuals | Interpolation Forecast | Residuals Prediction Error |
| 1 | 595 | 597.538406997237 | -2.53840699723690 |
| 2 | 591 | 598.441363682634 | -7.44136368263409 |
| 3 | 589 | 588.566148419862 | 0.433851580138386 |
| 4 | 584 | 581.698860452969 | 2.30113954703075 |
| 5 | 573 | 580.193464242644 | -7.19346424264373 |
| 6 | 567 | 563.563727133865 | 3.43627286613481 |
| 7 | 569 | 570.436731224323 | -1.43673122432336 |
| 8 | 621 | 621.517159942137 | -0.517159942136772 |
| 9 | 629 | 630.244837528502 | -1.24483752850162 |
| 10 | 628 | 615.284169085352 | 12.7158309146477 |
| 11 | 612 | 607.130185143472 | 4.8698148565282 |
| 12 | 595 | 594.767017532019 | 0.232982467981304 |
| 13 | 597 | 595.090461284256 | 1.90953871574416 |
| 14 | 593 | 596.906041560105 | -3.90604156010503 |
| 15 | 590 | 587.042932727314 | 2.95706727268607 |
| 16 | 580 | 579.26302116997 | 0.73697883002963 |
| 17 | 574 | 573.182400577406 | 0.817599422593482 |
| 18 | 573 | 561.055249270977 | 11.9447507290226 |
| 19 | 573 | 572.5519034636 | 0.448096536400176 |
| 20 | 620 | 621.867617150418 | -1.86761715041804 |
| 21 | 626 | 626.007963924563 | -0.00796392456298972 |
| 22 | 620 | 609.161516150603 | 10.8384838493965 |
| 23 | 588 | 596.420201396503 | -8.42020139650315 |
| 24 | 566 | 569.394524187921 | -3.39452418792072 |
| 25 | 557 | 564.961147108197 | -7.96114710819718 |
| 26 | 561 | 556.677335739174 | 4.32266426082613 |
| 27 | 549 | 553.982044900197 | -4.98204490019733 |
| 28 | 532 | 538.085372468643 | -6.08537246864337 |
| 29 | 526 | 525.507428873086 | 0.492571126913469 |
| 30 | 511 | 513.295532556787 | -2.29553255678695 |
| 31 | 499 | 512.01545648309 | -13.0154564830903 |
| 32 | 555 | 550.210197064751 | 4.78980293524882 |
| 33 | 565 | 562.41887899318 | 2.58112100681942 |
| 34 | 542 | 549.33188345086 | -7.33188345085994 |
| 35 | 527 | 521.124393379012 | 5.87560662098768 |
| 36 | 510 | 509.407507898418 | 0.592492101582176 |
| 37 | 514 | 509.743058080636 | 4.25694191936355 |
| 38 | 517 | 513.383885537388 | 3.61611446261162 |
| 39 | 508 | 509.93335469772 | -1.93335469771984 |
| 40 | 493 | 496.762446607538 | -3.76244660753850 |
| 41 | 490 | 486.046069482829 | 3.95393051717114 |
| 42 | 469 | 476.596256797846 | -7.59625679784636 |
| 43 | 478 | 469.876758471386 | 8.12324152861406 |
| 44 | 528 | 527.163955872637 | 0.836044127363355 |
| 45 | 534 | 534.151131287969 | -0.151131287969133 |
| 46 | 518 | 530.192770739627 | -12.1927707396267 |
| 47 | 506 | 508.325220081013 | -2.32522008101273 |
| 48 | 502 | 499.430950381643 | 2.56904961835724 |
| 49 | 516 | 511.666926529674 | 4.33307347032636 |
| 50 | 528 | 524.591373480699 | 3.40862651930139 |
| 51 | 533 | 529.475519254907 | 3.52448074509272 |
| 52 | 536 | 529.190299300879 | 6.80970069912149 |
| 53 | 537 | 535.070636824034 | 1.92936317596564 |
| 54 | 524 | 529.489234240524 | -5.48923424052415 |
| 55 | 536 | 530.1191503576 | 5.88084964239938 |
| 56 | 587 | 590.241069970057 | -3.24106997005736 |
| 57 | 597 | 598.177188265786 | -1.17718826578568 |
| 58 | 581 | 585.029660573558 | -4.02966057355759 |
| Goldfeld-Quandt test for Heteroskedasticity | |||
| p-values | Alternative Hypothesis | ||
| breakpoint index | greater | 2-sided | less |
| 19 | 0.0344739787319636 | 0.0689479574639272 | 0.965526021268036 |
| 20 | 0.00977607750869783 | 0.0195521550173957 | 0.990223922491302 |
| 21 | 0.00227413954927335 | 0.0045482790985467 | 0.997725860450727 |
| 22 | 0.0614957262071957 | 0.122991452414391 | 0.938504273792804 |
| 23 | 0.337832471478015 | 0.67566494295603 | 0.662167528521985 |
| 24 | 0.277662237525046 | 0.555324475050092 | 0.722337762474954 |
| 25 | 0.242578416835861 | 0.485156833671722 | 0.757421583164139 |
| 26 | 0.496626159021584 | 0.993252318043168 | 0.503373840978416 |
| 27 | 0.467616680123755 | 0.93523336024751 | 0.532383319876245 |
| 28 | 0.41834712709958 | 0.83669425419916 | 0.58165287290042 |
| 29 | 0.376302401268379 | 0.752604802536757 | 0.623697598731621 |
| 30 | 0.360064808239721 | 0.720129616479441 | 0.639935191760279 |
| 31 | 0.831674726267036 | 0.336650547465929 | 0.168325273732964 |
| 32 | 0.929782112968226 | 0.140435774063548 | 0.0702178870317741 |
| 33 | 0.922170572486452 | 0.155658855027097 | 0.0778294275135484 |
| 34 | 0.922823112968372 | 0.154353774063255 | 0.0771768870316277 |
| 35 | 0.966156467488886 | 0.0676870650222279 | 0.0338435325111139 |
| 36 | 0.937003067278525 | 0.125993865442951 | 0.0629969327214755 |
| 37 | 0.922381686622909 | 0.155236626754183 | 0.0776183133770914 |
| 38 | 0.953076963997935 | 0.0938460720041303 | 0.0469230360020651 |
| 39 | 0.994762307880292 | 0.0104753842394159 | 0.00523769211970797 |
| Meta Analysis of Goldfeld-Quandt test for Heteroskedasticity | |||
| Description | # significant tests | % significant tests | OK/NOK |
| 1% type I error level | 1 | 0.0476190476190476 | NOK |
| 5% type I error level | 3 | 0.142857142857143 | NOK |
| 10% type I error level | 6 | 0.285714285714286 | NOK |