| Multiple Linear Regression - Estimated Regression Equation |
| y[t] = -37.9811272503563 + 0.0670198079699449x[t] + 0.682921562538848y1[t] + 0.119179732248385y2[t] + 0.150514391120164y3[t] + 0.0814757034058975y4[t] -1.58003334572513M1[t] -2.61700254763576M2[t] -2.23468565236653M3[t] -3.49583107087434M4[t] -1.40348894920972M5[t] -2.27169803811806M6[t] -3.62374782576128M7[t] -5.63694467436919M8[t] -4.37543160126942M9[t] -6.46479144004884M10[t] -4.23386625939827M11[t] + 0.109731952455411t + e[t] |
| Multiple Linear Regression - Ordinary Least Squares | |||||
| Variable | Parameter | S.D. | T-STAT H0: parameter = 0 | 2-tail p-value | 1-tail p-value |
| (Intercept) | -37.9811272503563 | 17.518128 | -2.1681 | 0.036314 | 0.018157 |
| x | 0.0670198079699449 | 0.026158 | 2.5621 | 0.01438 | 0.00719 |
| y1 | 0.682921562538848 | 0.154769 | 4.4125 | 7.8e-05 | 3.9e-05 |
| y2 | 0.119179732248385 | 0.188236 | 0.6331 | 0.530338 | 0.265169 |
| y3 | 0.150514391120164 | 0.191686 | 0.7852 | 0.437074 | 0.218537 |
| y4 | 0.0814757034058975 | 0.16312 | 0.4995 | 0.620246 | 0.310123 |
| M1 | -1.58003334572513 | 2.338083 | -0.6758 | 0.503167 | 0.251584 |
| M2 | -2.61700254763576 | 2.407656 | -1.087 | 0.283731 | 0.141866 |
| M3 | -2.23468565236653 | 2.333619 | -0.9576 | 0.344161 | 0.17208 |
| M4 | -3.49583107087434 | 2.23898 | -1.5614 | 0.12652 | 0.06326 |
| M5 | -1.40348894920972 | 2.285549 | -0.6141 | 0.542734 | 0.271367 |
| M6 | -2.27169803811806 | 2.263027 | -1.0038 | 0.321648 | 0.160824 |
| M7 | -3.62374782576128 | 2.392632 | -1.5145 | 0.137951 | 0.068976 |
| M8 | -5.63694467436919 | 2.422322 | -2.3271 | 0.025245 | 0.012623 |
| M9 | -4.37543160126942 | 2.395629 | -1.8264 | 0.075449 | 0.037724 |
| M10 | -6.46479144004884 | 2.339435 | -2.7634 | 0.008685 | 0.004343 |
| M11 | -4.23386625939827 | 2.375336 | -1.7824 | 0.082466 | 0.041233 |
| t | 0.109731952455411 | 0.065306 | 1.6803 | 0.100897 | 0.050449 |
| Multiple Linear Regression - Regression Statistics | |
| Multiple R | 0.932188746251565 |
| R-squared | 0.868975858638064 |
| Adjusted R-squared | 0.811862771377733 |
| F-TEST (value) | 15.2150041316647 |
| F-TEST (DF numerator) | 17 |
| F-TEST (DF denominator) | 39 |
| p-value | 3.25228732833693e-12 |
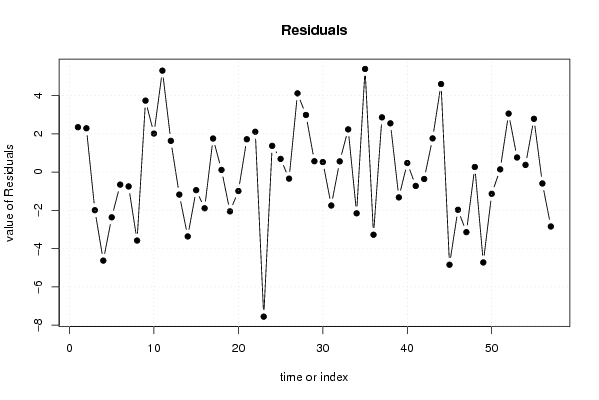
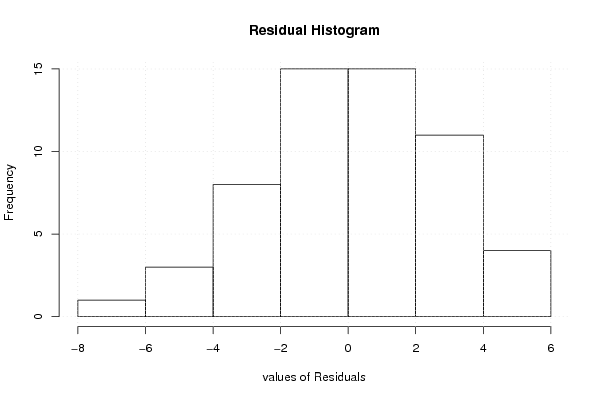
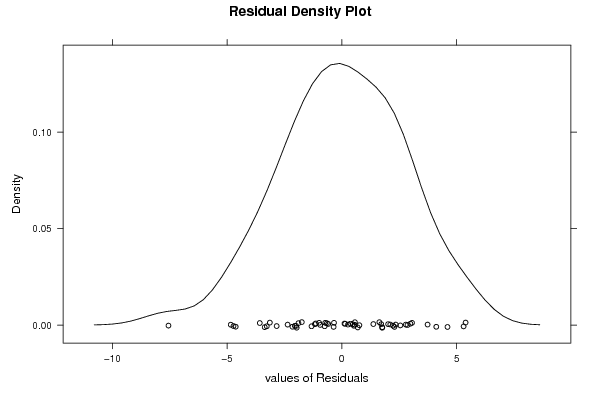
| Multiple Linear Regression - Residual Statistics | |
| Residual Standard Deviation | 3.21930628543235 |
| Sum Squared Residuals | 404.193385417546 |
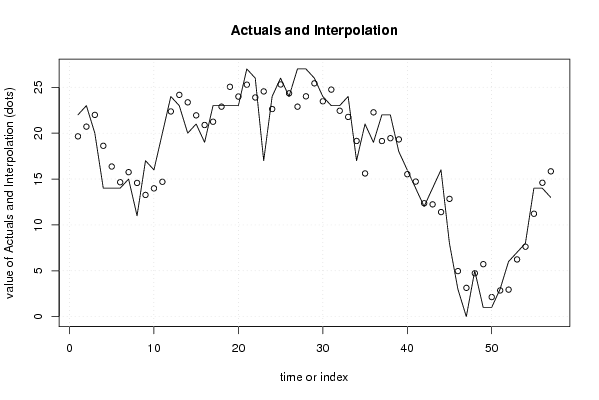
| Multiple Linear Regression - Actuals, Interpolation, and Residuals | |||
| Time or Index | Actuals | Interpolation Forecast | Residuals Prediction Error |
| 1 | 22 | 19.6544998724439 | 2.34550012755607 |
| 2 | 23 | 20.7110263823796 | 2.28897361762041 |
| 3 | 20 | 21.9899126529444 | -1.98991265294441 |
| 4 | 14 | 18.6232395172149 | -4.62323951721494 |
| 5 | 14 | 16.3630676728749 | -2.36306767287492 |
| 6 | 14 | 14.6534842889170 | -0.65348428891698 |
| 7 | 15 | 15.7486830112276 | -0.748683011227628 |
| 8 | 11 | 14.5754439209382 | -3.57544392093815 |
| 9 | 17 | 13.2671626206164 | 3.73283737938362 |
| 10 | 16 | 13.9865426441330 | 2.01345735586703 |
| 11 | 20 | 14.6994380116266 | 5.30056198837341 |
| 12 | 24 | 22.3667658904246 | 1.63323410957544 |
| 13 | 23 | 24.1751302737392 | -1.17513027373922 |
| 14 | 20 | 23.3612128279036 | -3.36121282790361 |
| 15 | 21 | 21.9430795541681 | -0.943079554168122 |
| 16 | 19 | 20.8903180285932 | -1.89031802859317 |
| 17 | 23 | 21.2456900251476 | 1.75430997485245 |
| 18 | 23 | 22.8866269552557 | 0.113373044744275 |
| 19 | 23 | 25.0514059448144 | -2.05140594481443 |
| 20 | 23 | 23.9891660541505 | -0.989166054150464 |
| 21 | 27 | 25.2841950455096 | 1.71580495449044 |
| 22 | 26 | 23.8916195543027 | 2.10838044569729 |
| 23 | 17 | 24.5516382785246 | -7.5516382785246 |
| 24 | 24 | 22.6286419880314 | 1.37135801196859 |
| 25 | 26 | 25.3096415966814 | 0.690358403318623 |
| 26 | 24 | 24.3421626789158 | -0.342162678915839 |
| 27 | 27 | 22.8877105377586 | 4.11228946224144 |
| 28 | 27 | 24.0159421530879 | 2.98405784691213 |
| 29 | 26 | 25.4321809289754 | 0.567819071024645 |
| 30 | 24 | 23.4751363008929 | 0.524863699107063 |
| 31 | 23 | 24.7453319649136 | -1.74533196491365 |
| 32 | 23 | 22.4402697303048 | 0.559730269695181 |
| 33 | 24 | 21.7683749546567 | 2.23162504534334 |
| 34 | 17 | 19.1529057133904 | -2.15290571339037 |
| 35 | 21 | 15.6114792020778 | 5.38852079792216 |
| 36 | 19 | 22.2710991613482 | -3.27109916134816 |
| 37 | 22 | 19.1406079614689 | 2.85939203853113 |
| 38 | 22 | 19.4523253040433 | 2.5476746959567 |
| 39 | 18 | 19.3214902603472 | -1.32149026034718 |
| 40 | 16 | 15.5259228867782 | 0.474077113221756 |
| 41 | 14 | 14.7224460496759 | -0.722446049675899 |
| 42 | 12 | 12.3608870308974 | -0.360887030897355 |
| 43 | 14 | 12.2384254087684 | 1.76157459123160 |
| 44 | 16 | 11.4005828319644 | 4.59941716803562 |
| 45 | 8 | 12.8397333305228 | -4.83973333052278 |
| 46 | 3 | 4.96893208817396 | -1.96893208817396 |
| 47 | 0 | 3.13744450777096 | -3.13744450777096 |
| 48 | 5 | 4.73349296019588 | 0.266507039804116 |
| 49 | 1 | 5.7201202956666 | -4.7201202956666 |
| 50 | 1 | 2.13327280675766 | -1.13327280675766 |
| 51 | 3 | 2.85780699478172 | 0.142193005218279 |
| 52 | 6 | 2.94457741432579 | 3.05542258567421 |
| 53 | 7 | 6.23661532332627 | 0.763384676673734 |
| 54 | 8 | 7.623865424037 | 0.376134575962994 |
| 55 | 14 | 11.2161536702759 | 2.7838463297241 |
| 56 | 14 | 14.5945374626422 | -0.594537462642183 |
| 57 | 13 | 15.8405340486946 | -2.84053404869461 |
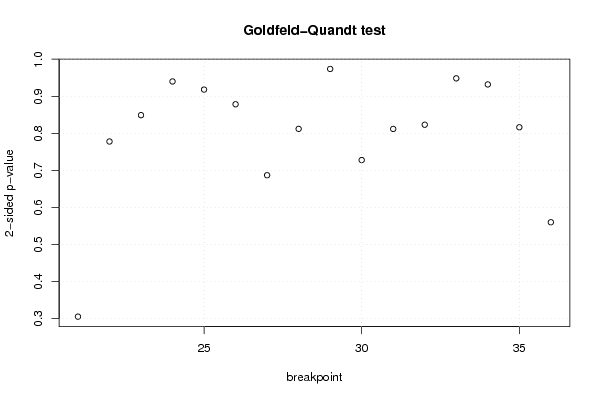
| Goldfeld-Quandt test for Heteroskedasticity | |||
| p-values | Alternative Hypothesis | ||
| breakpoint index | greater | 2-sided | less |
| 21 | 0.152681842250322 | 0.305363684500643 | 0.847318157749678 |
| 22 | 0.389023526356137 | 0.778047052712274 | 0.610976473643863 |
| 23 | 0.575435573959904 | 0.849128852080193 | 0.424564426040096 |
| 24 | 0.470033147153822 | 0.940066294307644 | 0.529966852846178 |
| 25 | 0.540925438542755 | 0.918149122914491 | 0.459074561457245 |
| 26 | 0.439256771975076 | 0.878513543950151 | 0.560743228024924 |
| 27 | 0.656521126852212 | 0.686957746295576 | 0.343478873147788 |
| 28 | 0.593939835848916 | 0.812120328302168 | 0.406060164151084 |
| 29 | 0.486900792385123 | 0.973801584770246 | 0.513099207614877 |
| 30 | 0.363962108957986 | 0.727924217915972 | 0.636037891042014 |
| 31 | 0.405954710759082 | 0.811909421518164 | 0.594045289240918 |
| 32 | 0.588352971148111 | 0.823294057703777 | 0.411647028851888 |
| 33 | 0.474235138563298 | 0.948470277126595 | 0.525764861436702 |
| 34 | 0.533988409766375 | 0.932023180467251 | 0.466011590233625 |
| 35 | 0.408220643014274 | 0.816441286028547 | 0.591779356985726 |
| 36 | 0.719930271047051 | 0.560139457905898 | 0.280069728952949 |
| Meta Analysis of Goldfeld-Quandt test for Heteroskedasticity | |||
| Description | # significant tests | % significant tests | OK/NOK |
| 1% type I error level | 0 | 0 | OK |
| 5% type I error level | 0 | 0 | OK |
| 10% type I error level | 0 | 0 | OK |