| Multiple Linear Regression - Estimated Regression Equation |
| wv[t] = + 2.12751659053694 + 0.88013875721796wm[t] + e[t] |
| Multiple Linear Regression - Ordinary Least Squares | |||||
| Variable | Parameter | S.D. | T-STAT H0: parameter = 0 | 2-tail p-value | 1-tail p-value |
| (Intercept) | 2.12751659053694 | 0.960147 | 2.2158 | 0.030785 | 0.015393 |
| wm | 0.88013875721796 | 0.160237 | 5.4927 | 1e-06 | 1e-06 |
| Multiple Linear Regression - Regression Statistics | |
| Multiple R | 0.591710957513192 |
| R-squared | 0.350121857241178 |
| Adjusted R-squared | 0.338516890406199 |
| F-TEST (value) | 30.1700006746993 |
| F-TEST (DF numerator) | 1 |
| F-TEST (DF denominator) | 56 |
| p-value | 1.00029949146041e-06 |
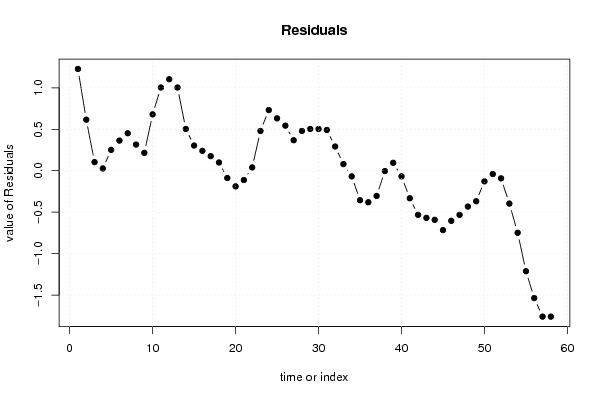
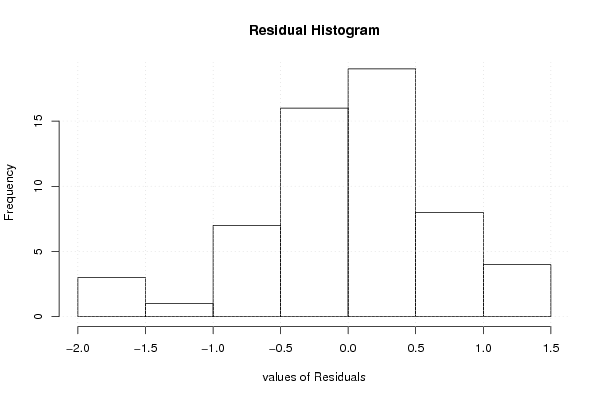
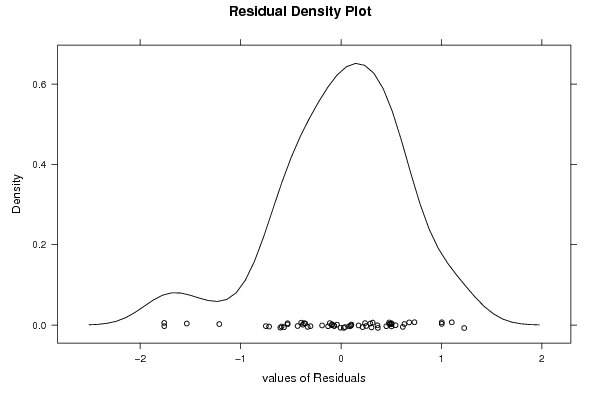
| Multiple Linear Regression - Residual Statistics | |
| Residual Standard Deviation | 0.641031880131442 |
| Sum Squared Residuals | 23.0116247953117 |
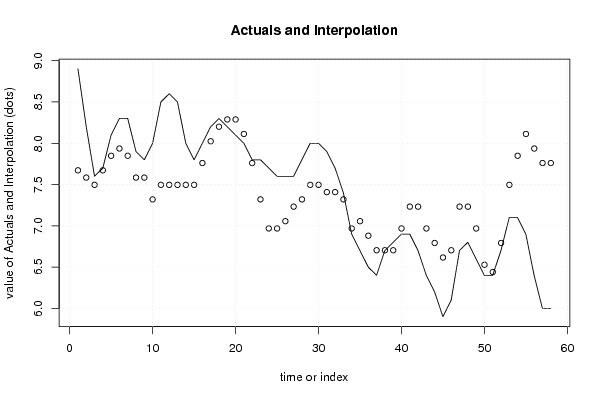
| Multiple Linear Regression - Actuals, Interpolation, and Residuals | |||
| Time or Index | Actuals | Interpolation Forecast | Residuals Prediction Error |
| 1 | 8.9 | 7.67239076101003 | 1.22760923898997 |
| 2 | 8.2 | 7.58437688528829 | 0.615623114711712 |
| 3 | 7.6 | 7.4963630095665 | 0.103636990433508 |
| 4 | 7.7 | 7.67239076101008 | 0.0276092389899161 |
| 5 | 8.1 | 7.84841851245368 | 0.251581487546323 |
| 6 | 8.3 | 7.93643238817547 | 0.363567611824529 |
| 7 | 8.3 | 7.84841851245368 | 0.451581487546325 |
| 8 | 7.9 | 7.58437688528829 | 0.315623114711712 |
| 9 | 7.8 | 7.58437688528829 | 0.215623114711711 |
| 10 | 8 | 7.3203352581229 | 0.679664741877099 |
| 11 | 8.5 | 7.4963630095665 | 1.00363699043351 |
| 12 | 8.6 | 7.4963630095665 | 1.10363699043351 |
| 13 | 8.5 | 7.4963630095665 | 1.00363699043351 |
| 14 | 8 | 7.4963630095665 | 0.503636990433508 |
| 15 | 7.8 | 7.4963630095665 | 0.303636990433508 |
| 16 | 8 | 7.76040463673188 | 0.239595363268119 |
| 17 | 8.2 | 8.02444626389727 | 0.175553736102731 |
| 18 | 8.3 | 8.20047401534086 | 0.0995259846591403 |
| 19 | 8.2 | 8.28848789106266 | -0.0884878910626567 |
| 20 | 8.1 | 8.28848789106266 | -0.188487891062656 |
| 21 | 8 | 8.11246013961906 | -0.112460139619064 |
| 22 | 7.8 | 7.76040463673188 | 0.0395953632681193 |
| 23 | 7.8 | 7.3203352581229 | 0.479664741877099 |
| 24 | 7.7 | 6.96827975523572 | 0.731720244764283 |
| 25 | 7.6 | 6.96827975523572 | 0.631720244764283 |
| 26 | 7.6 | 7.05629363095751 | 0.543706369042487 |
| 27 | 7.6 | 7.2323213824011 | 0.367678617598895 |
| 28 | 7.8 | 7.3203352581229 | 0.479664741877099 |
| 29 | 8 | 7.4963630095665 | 0.503636990433508 |
| 30 | 8 | 7.4963630095665 | 0.503636990433508 |
| 31 | 7.9 | 7.4083491338447 | 0.491650866155304 |
| 32 | 7.7 | 7.4083491338447 | 0.291650866155304 |
| 33 | 7.4 | 7.3203352581229 | 0.0796647418770996 |
| 34 | 6.9 | 6.96827975523572 | -0.0682797552357164 |
| 35 | 6.7 | 7.05629363095751 | -0.356293630957512 |
| 36 | 6.5 | 6.88026587951392 | -0.380265879513921 |
| 37 | 6.4 | 6.70423812807033 | -0.304238128070329 |
| 38 | 6.7 | 6.70423812807033 | -0.00423812807032881 |
| 39 | 6.8 | 6.70423812807033 | 0.0957618719296709 |
| 40 | 6.9 | 6.96827975523572 | -0.0682797552357164 |
| 41 | 6.9 | 7.2323213824011 | -0.332321382401104 |
| 42 | 6.7 | 7.2323213824011 | -0.532321382401104 |
| 43 | 6.4 | 6.96827975523572 | -0.568279755235716 |
| 44 | 6.2 | 6.79225200379212 | -0.592252003792125 |
| 45 | 5.9 | 6.61622425234853 | -0.716224252348532 |
| 46 | 6.1 | 6.70423812807033 | -0.604238128070329 |
| 47 | 6.7 | 7.2323213824011 | -0.532321382401104 |
| 48 | 6.8 | 7.2323213824011 | -0.432321382401104 |
| 49 | 6.6 | 6.96827975523572 | -0.368279755235717 |
| 50 | 6.4 | 6.52821037662674 | -0.128210376626736 |
| 51 | 6.4 | 6.44019650090494 | -0.0401965009049408 |
| 52 | 6.7 | 6.79225200379212 | -0.0922520037921245 |
| 53 | 7.1 | 7.4963630095665 | -0.396363009566492 |
| 54 | 7.1 | 7.84841851245368 | -0.748418512453677 |
| 55 | 6.9 | 8.11246013961906 | -1.21246013961906 |
| 56 | 6.4 | 7.93643238817547 | -1.53643238817547 |
| 57 | 6 | 7.76040463673188 | -1.76040463673188 |
| 58 | 6 | 7.76040463673188 | -1.76040463673188 |
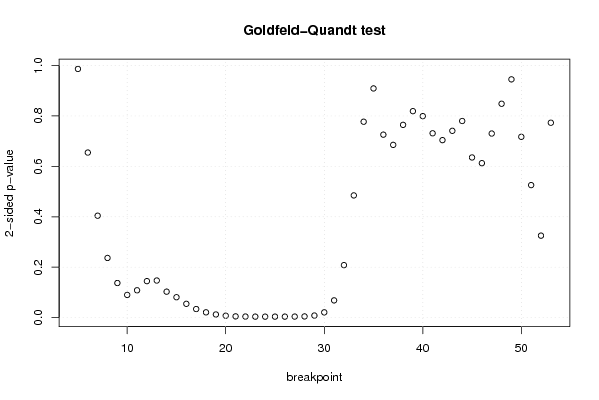
| Goldfeld-Quandt test for Heteroskedasticity | |||
| p-values | Alternative Hypothesis | ||
| breakpoint index | greater | 2-sided | less |
| 5 | 0.493060316957685 | 0.98612063391537 | 0.506939683042315 |
| 6 | 0.327297767039338 | 0.654595534078677 | 0.672702232960662 |
| 7 | 0.202049500139588 | 0.404099000279176 | 0.797950499860412 |
| 8 | 0.118308533109868 | 0.236617066219737 | 0.881691466890131 |
| 9 | 0.0685967619311509 | 0.137193523862302 | 0.93140323806885 |
| 10 | 0.0449877828350931 | 0.0899755656701861 | 0.955012217164907 |
| 11 | 0.0541852123694689 | 0.108370424738938 | 0.945814787630531 |
| 12 | 0.0723553434282005 | 0.144710686856401 | 0.9276446565718 |
| 13 | 0.0735527308363664 | 0.147105461672733 | 0.926447269163634 |
| 14 | 0.0514351923245028 | 0.102870384649006 | 0.948564807675497 |
| 15 | 0.0404060241655675 | 0.080812048331135 | 0.959593975834433 |
| 16 | 0.0273380009137264 | 0.0546760018274529 | 0.972661999086273 |
| 17 | 0.0170151282343855 | 0.034030256468771 | 0.982984871765614 |
| 18 | 0.0104655627134075 | 0.0209311254268149 | 0.989534437286593 |
| 19 | 0.0062307058793782 | 0.0124614117587564 | 0.993769294120622 |
| 20 | 0.00377652694642208 | 0.00755305389284417 | 0.996223473053578 |
| 21 | 0.00246768522776551 | 0.00493537045553102 | 0.997532314772234 |
| 22 | 0.00211300219390693 | 0.00422600438781387 | 0.997886997806093 |
| 23 | 0.00191678320513856 | 0.00383356641027713 | 0.998083216794861 |
| 24 | 0.00190293864972263 | 0.00380587729944525 | 0.998097061350277 |
| 25 | 0.00193637306161227 | 0.00387274612322453 | 0.998063626938388 |
| 26 | 0.00195589375509827 | 0.00391178751019655 | 0.998044106244902 |
| 27 | 0.00203635615049501 | 0.00407271230099001 | 0.997963643849505 |
| 28 | 0.00234942055861552 | 0.00469884111723105 | 0.997650579441384 |
| 29 | 0.00410506329896785 | 0.0082101265979357 | 0.995894936701032 |
| 30 | 0.0104399952315375 | 0.0208799904630751 | 0.989560004768463 |
| 31 | 0.0341748654294997 | 0.0683497308589994 | 0.9658251345705 |
| 32 | 0.104075949089818 | 0.208151898179636 | 0.895924050910182 |
| 33 | 0.242306434717984 | 0.484612869435968 | 0.757693565282016 |
| 34 | 0.388405833720209 | 0.776811667440418 | 0.611594166279791 |
| 35 | 0.545593057702556 | 0.908813884594889 | 0.454406942297444 |
| 36 | 0.637257010996194 | 0.725485978007612 | 0.362742989003806 |
| 37 | 0.657468402457932 | 0.685063195084136 | 0.342531597542068 |
| 38 | 0.617805631240488 | 0.764388737519024 | 0.382194368759512 |
| 39 | 0.590607653405224 | 0.818784693189553 | 0.409392346594776 |
| 40 | 0.600498851101461 | 0.799002297797078 | 0.399501148898539 |
| 41 | 0.634531881582804 | 0.730936236834391 | 0.365468118417196 |
| 42 | 0.64810371426884 | 0.703792571462321 | 0.351896285731160 |
| 43 | 0.629611591943864 | 0.740776816112273 | 0.370388408056136 |
| 44 | 0.610155932566109 | 0.779688134867782 | 0.389844067433891 |
| 45 | 0.682439135157757 | 0.635121729684486 | 0.317560864842243 |
| 46 | 0.693775889908687 | 0.612448220182626 | 0.306224110091313 |
| 47 | 0.635024108084508 | 0.729951783830984 | 0.364975891915492 |
| 48 | 0.575951363017819 | 0.848097273964362 | 0.424048636982181 |
| 49 | 0.472440182948298 | 0.944880365896596 | 0.527559817051702 |
| 50 | 0.358488831584643 | 0.716977663169285 | 0.641511168415357 |
| 51 | 0.262737551809351 | 0.525475103618701 | 0.73726244819065 |
| 52 | 0.162510009731890 | 0.325020019463781 | 0.83748999026811 |
| 53 | 0.386405828590746 | 0.772811657181492 | 0.613594171409254 |
| Meta Analysis of Goldfeld-Quandt test for Heteroskedasticity | |||
| Description | # significant tests | % significant tests | OK/NOK |
| 1% type I error level | 10 | 0.204081632653061 | NOK |
| 5% type I error level | 14 | 0.285714285714286 | NOK |
| 10% type I error level | 18 | 0.36734693877551 | NOK |