| Multiple Linear Regression - Estimated Regression Equation |
| Y[t] = + 0.633709699169343 + 0.208586394090889X[t] + 0.75975279754674`Y(t-1)`[t] -0.035428460457972`Y(t-4)`[t] + e[t] |
| Multiple Linear Regression - Ordinary Least Squares | |||||
| Variable | Parameter | S.D. | T-STAT H0: parameter = 0 | 2-tail p-value | 1-tail p-value |
| (Intercept) | 0.633709699169343 | 1.405333 | 0.4509 | 0.653878 | 0.326939 |
| X | 0.208586394090889 | 0.154012 | 1.3543 | 0.181371 | 0.090686 |
| `Y(t-1)` | 0.75975279754674 | 0.123171 | 6.1683 | 0 | 0 |
| `Y(t-4)` | -0.035428460457972 | 0.109207 | -0.3244 | 0.7469 | 0.37345 |
| Multiple Linear Regression - Regression Statistics | |
| Multiple R | 0.898579324435252 |
| R-squared | 0.807444802302514 |
| Adjusted R-squared | 0.796545451489449 |
| F-TEST (value) | 74.0819170013884 |
| F-TEST (DF numerator) | 3 |
| F-TEST (DF denominator) | 53 |
| p-value | 0 |
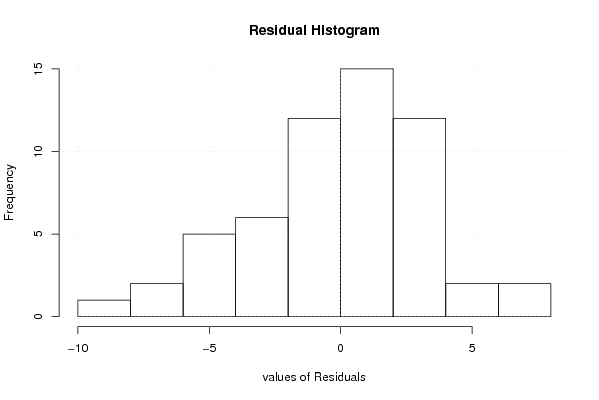
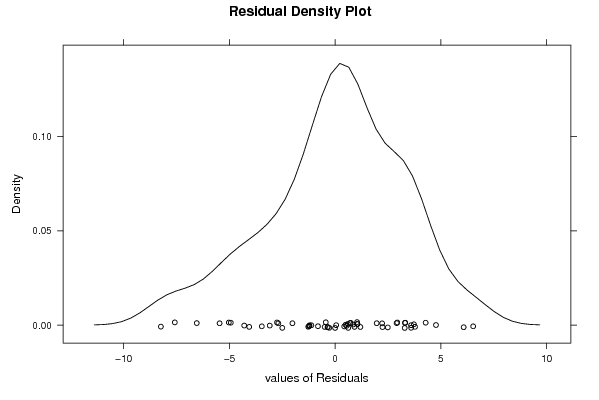
| Multiple Linear Regression - Residual Statistics | |
| Residual Standard Deviation | 3.34001626392747 |
| Sum Squared Residuals | 591.252558094901 |
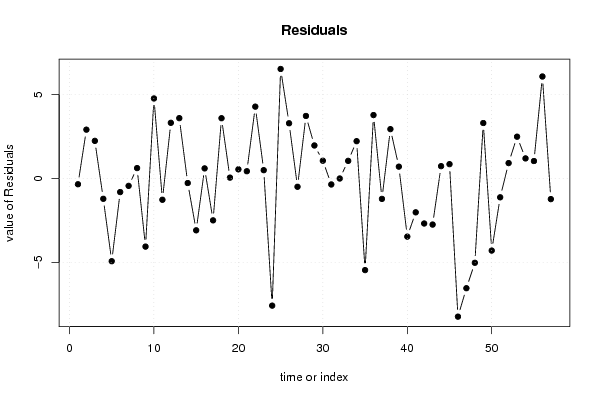
| Multiple Linear Regression - Actuals, Interpolation, and Residuals | |||
| Time or Index | Actuals | Interpolation Forecast | Residuals Prediction Error |
| 1 | 19 | 19.3436662778418 | -0.343666277841756 |
| 2 | 22 | 19.0890659709010 | 2.91093402909904 |
| 3 | 23 | 20.7571350023174 | 2.24286499768262 |
| 4 | 20 | 21.210297027088 | -1.21029702708800 |
| 5 | 14 | 18.9310386344478 | -4.93103863444777 |
| 6 | 14 | 14.8085610924297 | -0.80856109242973 |
| 7 | 14 | 14.4393944014263 | -0.439394401426334 |
| 8 | 15 | 14.3788106675275 | 0.621189332472461 |
| 9 | 11 | 15.0591132760949 | -4.05911327609487 |
| 10 | 17 | 12.2286884799988 | 4.77131152000121 |
| 11 | 16 | 17.2669539716883 | -1.26695397168828 |
| 12 | 20 | 16.6803591077745 | 3.31964089222554 |
| 13 | 24 | 20.4034087644296 | 3.59659123557038 |
| 14 | 23 | 23.2715664706869 | -0.271566470686929 |
| 15 | 20 | 23.0895667582345 | -3.08956675823447 |
| 16 | 21 | 20.3974322114442 | 0.602567788555793 |
| 17 | 19 | 21.4952198735681 | -2.49521987356811 |
| 18 | 23 | 19.406242196069 | 3.59375780393098 |
| 19 | 23 | 22.9478529164026 | 0.0521470835974146 |
| 20 | 23 | 22.4535343889447 | 0.546465611055345 |
| 21 | 23 | 22.5661085886788 | 0.433891411321222 |
| 22 | 27 | 22.7164156985741 | 4.28358430142586 |
| 23 | 26 | 25.5051232158520 | 0.49487678414797 |
| 24 | 17 | 24.5785013030326 | -7.57850130303258 |
| 25 | 24 | 17.4695638127938 | 6.53043618720624 |
| 26 | 26 | 22.7086954720163 | 3.29130452798368 |
| 27 | 24 | 24.4930745610678 | -0.493074561067751 |
| 28 | 27 | 23.2715664706869 | 3.72843352931307 |
| 29 | 27 | 25.0316633278032 | 1.96833667219681 |
| 30 | 26 | 24.9399477674782 | 1.06005223252184 |
| 31 | 24 | 24.3553450878928 | -0.355345087892805 |
| 32 | 23 | 23.0007164237436 | -0.000716423743563926 |
| 33 | 23 | 21.9489426744696 | 1.05105732553042 |
| 34 | 24 | 21.7757847408367 | 2.22421525916334 |
| 35 | 17 | 22.4603839834357 | -5.46038398343572 |
| 36 | 21 | 17.2192601398847 | 3.78073986011531 |
| 37 | 19 | 20.2165540512535 | -1.21655405125347 |
| 38 | 22 | 19.0579341444747 | 2.94206585552529 |
| 39 | 22 | 21.2931708085935 | 0.706829191406509 |
| 40 | 18 | 21.4643365578979 | -3.46433655789794 |
| 41 | 16 | 18.0164335822179 | -2.01643358221787 |
| 42 | 14 | 16.6826635574777 | -2.68266355747772 |
| 43 | 12 | 14.7459851742025 | -2.74598517420246 |
| 44 | 14 | 13.2639002238954 | 0.736099776104575 |
| 45 | 16 | 15.1462836916321 | 0.853716308367904 |
| 46 | 8 | 16.2360388618234 | -8.23603886182338 |
| 47 | 3 | 9.54053830186547 | -6.54053830186547 |
| 48 | 0 | 5.02429957153407 | -5.02429957153407 |
| 49 | 5 | 1.69382820575072 | 3.30617179424928 |
| 50 | 1 | 5.29627117073916 | -4.29627117073916 |
| 51 | 1 | 2.12152269170572 | -1.12152269170572 |
| 52 | 3 | 2.08179759721601 | 0.918202402783987 |
| 53 | 6 | 3.50759544765599 | 2.49240455234401 |
| 54 | 7 | 5.80341584567357 | 1.19658415432643 |
| 55 | 8 | 6.959482791993 | 1.04051720800701 |
| 56 | 14 | 7.91954098094195 | 6.08045901905805 |
| 57 | 14 | 15.2294059838937 | -1.22940598389366 |
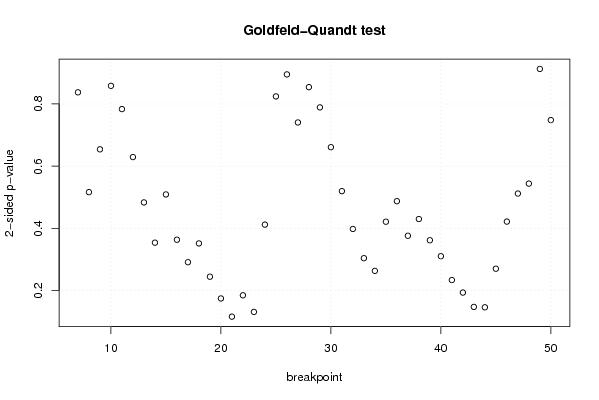
| Goldfeld-Quandt test for Heteroskedasticity | |||
| p-values | Alternative Hypothesis | ||
| breakpoint index | greater | 2-sided | less |
| 7 | 0.418722933353165 | 0.83744586670633 | 0.581277066646835 |
| 8 | 0.258308143070212 | 0.516616286140424 | 0.741691856929788 |
| 9 | 0.327120861317972 | 0.654241722635943 | 0.672879138682028 |
| 10 | 0.429177539777828 | 0.858355079555657 | 0.570822460222172 |
| 11 | 0.391815798834922 | 0.783631597669844 | 0.608184201165078 |
| 12 | 0.314631365519566 | 0.629262731039133 | 0.685368634480434 |
| 13 | 0.241748253677365 | 0.483496507354729 | 0.758251746322635 |
| 14 | 0.177013646092692 | 0.354027292185384 | 0.822986353907308 |
| 15 | 0.254554731821963 | 0.509109463643927 | 0.745445268178037 |
| 16 | 0.181758439671971 | 0.363516879343941 | 0.81824156032803 |
| 17 | 0.145597433062819 | 0.291194866125637 | 0.854402566937181 |
| 18 | 0.175807969722388 | 0.351615939444776 | 0.824192030277612 |
| 19 | 0.122315368267791 | 0.244630736535581 | 0.87768463173221 |
| 20 | 0.0873241818779186 | 0.174648363755837 | 0.912675818122081 |
| 21 | 0.0580794277083486 | 0.116158855416697 | 0.941920572291651 |
| 22 | 0.092376339394081 | 0.184752678788162 | 0.907623660605919 |
| 23 | 0.0657212102749824 | 0.131442420549965 | 0.934278789725018 |
| 24 | 0.206041827305519 | 0.412083654611038 | 0.79395817269448 |
| 25 | 0.412172549812747 | 0.824345099625494 | 0.587827450187253 |
| 26 | 0.44756218061329 | 0.89512436122658 | 0.55243781938671 |
| 27 | 0.370299666964394 | 0.740599333928788 | 0.629700333035606 |
| 28 | 0.427098551420283 | 0.854197102840567 | 0.572901448579717 |
| 29 | 0.394533810284322 | 0.789067620568644 | 0.605466189715678 |
| 30 | 0.330527779809453 | 0.661055559618906 | 0.669472220190547 |
| 31 | 0.259861030495449 | 0.519722060990898 | 0.740138969504551 |
| 32 | 0.199051280122852 | 0.398102560245704 | 0.800948719877148 |
| 33 | 0.152073884165978 | 0.304147768331956 | 0.847926115834022 |
| 34 | 0.131662967148592 | 0.263325934297183 | 0.868337032851408 |
| 35 | 0.210716517155643 | 0.421433034311287 | 0.789283482844357 |
| 36 | 0.243716531624212 | 0.487433063248423 | 0.756283468375789 |
| 37 | 0.188121578095851 | 0.376243156191703 | 0.811878421904149 |
| 38 | 0.215025772435994 | 0.430051544871988 | 0.784974227564006 |
| 39 | 0.180889391648185 | 0.361778783296369 | 0.819110608351815 |
| 40 | 0.155262919122995 | 0.310525838245990 | 0.844737080877005 |
| 41 | 0.116921003777538 | 0.233842007555076 | 0.883078996222462 |
| 42 | 0.0967929243852032 | 0.193585848770406 | 0.903207075614797 |
| 43 | 0.0737067406226881 | 0.147413481245376 | 0.926293259377312 |
| 44 | 0.0731011400142706 | 0.146202280028541 | 0.92689885998573 |
| 45 | 0.135135595844001 | 0.270271191688002 | 0.864864404156 |
| 46 | 0.210926534123702 | 0.421853068247404 | 0.789073465876298 |
| 47 | 0.255982978891898 | 0.511965957783795 | 0.744017021108102 |
| 48 | 0.271971785167515 | 0.543943570335031 | 0.728028214832485 |
| 49 | 0.456311298185138 | 0.912622596370277 | 0.543688701814862 |
| 50 | 0.625861562619132 | 0.748276874761737 | 0.374138437380868 |
| Meta Analysis of Goldfeld-Quandt test for Heteroskedasticity | |||
| Description | # significant tests | % significant tests | OK/NOK |
| 1% type I error level | 0 | 0 | OK |
| 5% type I error level | 0 | 0 | OK |
| 10% type I error level | 0 | 0 | OK |