Free Statistics

of Irreproducible Research!

Author's title

Author*The author of this computation has been verified*
R Software Modulerwasp_multipleregression.wasp
Title produced by softwareMultiple Regression
Date of computationThu, 19 Nov 2009 12:43:57 -0700
Cite this page as followsStatistical Computations at FreeStatistics.org, Office for Research Development and Education, URL https://freestatistics.org/blog/index.php?v=date/2009/Nov/19/t1258659900vv9e67p8iy90w3m.htm/, Retrieved Sat, 20 Apr 2024 11:59:02 +0000
Statistical Computations at FreeStatistics.org, Office for Research Development and Education, URL https://freestatistics.org/blog/index.php?pk=57918, Retrieved Sat, 20 Apr 2024 11:59:02 +0000
QR Codes:

Original text written by user:
IsPrivate?No (this computation is public)
User-defined keywords
Estimated Impact117
Family? (F = Feedback message, R = changed R code, M = changed R Module, P = changed Parameters, D = changed Data)
-     [Multiple Regression] [Q1 The Seatbeltlaw] [2007-11-14 19:27:43] [8cd6641b921d30ebe00b648d1481bba0]
- RM D  [Multiple Regression] [Seatbelt] [2009-11-12 14:06:21] [b98453cac15ba1066b407e146608df68]
-    D      [Multiple Regression] [WS 7 Multiple reg...] [2009-11-19 19:43:57] [eba9f01697e64705b70041e6f338cb22] [Current]
Feedback Forum

Post a new message
Dataseries X:
108.01	102.9
101.21	97.4
119.93	111.4
94.76	87.4
95.26	96.8
117.96	114.1
115.86	110.3
111.44	103.9
108.16	101.6
108.77	94.6
109.45	95.9
124.83	104.7
115.31	102.8
109.49	98.1
124.24	113.9
92.85	80.9
98.42	95.7
120.88	113.2
111.72	105.9
116.1	108.8
109.37	102.3
111.65	99
114.29	100.7
133.68	115.5
114.27	100.7
126.49	109.9
131	114.6
104	85.4
108.88	100.5
128.48	114.8
132.44	116.5
128.04	112.9
116.35	102
120.93	106
118.59	105.3
133.1	118.8
121.05	106.1
127.62	109.3
135.44	117.2
114.88	92.5
114.34	104.2
128.85	112.5
138.9	122.4
129.44	113.3
114.96	100
127.98	110.7
127.03	112.8
128.75	109.8
137.91	117.3
128.37	109.1
135.9	115.9
122.19	96
113.08	99.8
136.2	116.8
138	115.7
115.24	99.4
110.95	94.3
99.23	91
102.39	93.2
112.67	103.1


Summary of computational transaction
Raw Inputview raw input (R code)
Raw Outputview raw output of R engine
Computing time3 seconds
R Server'Gwilym Jenkins' @ 72.249.127.135

\begin{tabular}{lllllllll}
\hline
Summary of computational transaction \tabularnewline
Raw Input & view raw input (R code)  \tabularnewline
Raw Output & view raw output of R engine  \tabularnewline
Computing time & 3 seconds \tabularnewline
R Server & 'Gwilym Jenkins' @ 72.249.127.135 \tabularnewline
\hline
\end{tabular}
%Source: https://freestatistics.org/blog/index.php?pk=57918&T=0

[TABLE]
[ROW][C]Summary of computational transaction[/C][/ROW]
[ROW][C]Raw Input[/C][C]view raw input (R code) [/C][/ROW]
[ROW][C]Raw Output[/C][C]view raw output of R engine [/C][/ROW]
[ROW][C]Computing time[/C][C]3 seconds[/C][/ROW]
[ROW][C]R Server[/C][C]'Gwilym Jenkins' @ 72.249.127.135[/C][/ROW]
[/TABLE]
Source: https://freestatistics.org/blog/index.php?pk=57918&T=0

Globally Unique Identifier (entire table): ba.freestatistics.org/blog/index.php?pk=57918&T=0

As an alternative you can also use a QR Code:  

The GUIDs for individual cells are displayed in the table below:

Summary of computational transaction
Raw Inputview raw input (R code)
Raw Outputview raw output of R engine
Computing time3 seconds
R Server'Gwilym Jenkins' @ 72.249.127.135


Multiple Linear Regression - Estimated Regression Equation
Y[t] = -24.6219614667864 + 1.31422861183913X[t] + 0.396153803546174M1[t] + 1.12802237964250M2[t] -1.30919291896518M3[t] + 9.3338218086357M4[t] -4.98132953523177M5[t] -4.23025703750864M6[t] -3.3337553621986M7[t] -2.29447514335494M8[t] -0.545258879251453M9[t] + 0.748405068033284M10[t] -0.519582457705025M11[t] + 0.17120575811066t + e[t]

\begin{tabular}{lllllllll}
\hline
Multiple Linear Regression - Estimated Regression Equation \tabularnewline
Y[t] =  -24.6219614667864 +  1.31422861183913X[t] +  0.396153803546174M1[t] +  1.12802237964250M2[t] -1.30919291896518M3[t] +  9.3338218086357M4[t] -4.98132953523177M5[t] -4.23025703750864M6[t] -3.3337553621986M7[t] -2.29447514335494M8[t] -0.545258879251453M9[t] +  0.748405068033284M10[t] -0.519582457705025M11[t] +  0.17120575811066t  + e[t] \tabularnewline
\hline
\end{tabular}
%Source: https://freestatistics.org/blog/index.php?pk=57918&T=1

[TABLE]
[ROW][C]Multiple Linear Regression - Estimated Regression Equation[/C][/ROW]
[ROW][C]Y[t] =  -24.6219614667864 +  1.31422861183913X[t] +  0.396153803546174M1[t] +  1.12802237964250M2[t] -1.30919291896518M3[t] +  9.3338218086357M4[t] -4.98132953523177M5[t] -4.23025703750864M6[t] -3.3337553621986M7[t] -2.29447514335494M8[t] -0.545258879251453M9[t] +  0.748405068033284M10[t] -0.519582457705025M11[t] +  0.17120575811066t  + e[t][/C][/ROW]
[/TABLE]
Source: https://freestatistics.org/blog/index.php?pk=57918&T=1

Globally Unique Identifier (entire table): ba.freestatistics.org/blog/index.php?pk=57918&T=1

As an alternative you can also use a QR Code:  

The GUIDs for individual cells are displayed in the table below:

Multiple Linear Regression - Estimated Regression Equation
Y[t] = -24.6219614667864 + 1.31422861183913X[t] + 0.396153803546174M1[t] + 1.12802237964250M2[t] -1.30919291896518M3[t] + 9.3338218086357M4[t] -4.98132953523177M5[t] -4.23025703750864M6[t] -3.3337553621986M7[t] -2.29447514335494M8[t] -0.545258879251453M9[t] + 0.748405068033284M10[t] -0.519582457705025M11[t] + 0.17120575811066t + e[t]


Multiple Linear Regression - Ordinary Least Squares
VariableParameterS.D.T-STATH0: parameter = 02-tail p-value1-tail p-value
(Intercept)-24.621961466786410.456775-2.35460.0228640.011432
X1.314228611839130.09608313.67800
M10.3961538035461742.3460930.16890.866650.433325
M21.128022379642502.3631360.47730.6353790.31769
M3-1.309192918965182.367355-0.5530.5829280.291464
M49.33382180863573.0821013.02840.0040220.002011
M5-4.981329535231772.515298-1.98040.0536560.026828
M6-4.230257037508642.348809-1.8010.0782570.039128
M7-3.33375536219862.343343-1.42260.1615840.080792
M8-2.294475143354942.316977-0.99030.3272140.163607
M9-0.5452588792514532.499253-0.21820.8282630.414131
M100.7484050680332842.4938230.30010.765450.382725
M11-0.5195824577050252.450689-0.2120.8330320.416516
t0.171205758110660.0291375.87600

\begin{tabular}{lllllllll}
\hline
Multiple Linear Regression - Ordinary Least Squares \tabularnewline
Variable & Parameter & S.D. & T-STATH0: parameter = 0 & 2-tail p-value & 1-tail p-value \tabularnewline
(Intercept) & -24.6219614667864 & 10.456775 & -2.3546 & 0.022864 & 0.011432 \tabularnewline
X & 1.31422861183913 & 0.096083 & 13.678 & 0 & 0 \tabularnewline
M1 & 0.396153803546174 & 2.346093 & 0.1689 & 0.86665 & 0.433325 \tabularnewline
M2 & 1.12802237964250 & 2.363136 & 0.4773 & 0.635379 & 0.31769 \tabularnewline
M3 & -1.30919291896518 & 2.367355 & -0.553 & 0.582928 & 0.291464 \tabularnewline
M4 & 9.3338218086357 & 3.082101 & 3.0284 & 0.004022 & 0.002011 \tabularnewline
M5 & -4.98132953523177 & 2.515298 & -1.9804 & 0.053656 & 0.026828 \tabularnewline
M6 & -4.23025703750864 & 2.348809 & -1.801 & 0.078257 & 0.039128 \tabularnewline
M7 & -3.3337553621986 & 2.343343 & -1.4226 & 0.161584 & 0.080792 \tabularnewline
M8 & -2.29447514335494 & 2.316977 & -0.9903 & 0.327214 & 0.163607 \tabularnewline
M9 & -0.545258879251453 & 2.499253 & -0.2182 & 0.828263 & 0.414131 \tabularnewline
M10 & 0.748405068033284 & 2.493823 & 0.3001 & 0.76545 & 0.382725 \tabularnewline
M11 & -0.519582457705025 & 2.450689 & -0.212 & 0.833032 & 0.416516 \tabularnewline
t & 0.17120575811066 & 0.029137 & 5.876 & 0 & 0 \tabularnewline
\hline
\end{tabular}
%Source: https://freestatistics.org/blog/index.php?pk=57918&T=2

[TABLE]
[ROW][C]Multiple Linear Regression - Ordinary Least Squares[/C][/ROW]
[ROW][C]Variable[/C][C]Parameter[/C][C]S.D.[/C][C]T-STATH0: parameter = 0[/C][C]2-tail p-value[/C][C]1-tail p-value[/C][/ROW]
[ROW][C](Intercept)[/C][C]-24.6219614667864[/C][C]10.456775[/C][C]-2.3546[/C][C]0.022864[/C][C]0.011432[/C][/ROW]
[ROW][C]X[/C][C]1.31422861183913[/C][C]0.096083[/C][C]13.678[/C][C]0[/C][C]0[/C][/ROW]
[ROW][C]M1[/C][C]0.396153803546174[/C][C]2.346093[/C][C]0.1689[/C][C]0.86665[/C][C]0.433325[/C][/ROW]
[ROW][C]M2[/C][C]1.12802237964250[/C][C]2.363136[/C][C]0.4773[/C][C]0.635379[/C][C]0.31769[/C][/ROW]
[ROW][C]M3[/C][C]-1.30919291896518[/C][C]2.367355[/C][C]-0.553[/C][C]0.582928[/C][C]0.291464[/C][/ROW]
[ROW][C]M4[/C][C]9.3338218086357[/C][C]3.082101[/C][C]3.0284[/C][C]0.004022[/C][C]0.002011[/C][/ROW]
[ROW][C]M5[/C][C]-4.98132953523177[/C][C]2.515298[/C][C]-1.9804[/C][C]0.053656[/C][C]0.026828[/C][/ROW]
[ROW][C]M6[/C][C]-4.23025703750864[/C][C]2.348809[/C][C]-1.801[/C][C]0.078257[/C][C]0.039128[/C][/ROW]
[ROW][C]M7[/C][C]-3.3337553621986[/C][C]2.343343[/C][C]-1.4226[/C][C]0.161584[/C][C]0.080792[/C][/ROW]
[ROW][C]M8[/C][C]-2.29447514335494[/C][C]2.316977[/C][C]-0.9903[/C][C]0.327214[/C][C]0.163607[/C][/ROW]
[ROW][C]M9[/C][C]-0.545258879251453[/C][C]2.499253[/C][C]-0.2182[/C][C]0.828263[/C][C]0.414131[/C][/ROW]
[ROW][C]M10[/C][C]0.748405068033284[/C][C]2.493823[/C][C]0.3001[/C][C]0.76545[/C][C]0.382725[/C][/ROW]
[ROW][C]M11[/C][C]-0.519582457705025[/C][C]2.450689[/C][C]-0.212[/C][C]0.833032[/C][C]0.416516[/C][/ROW]
[ROW][C]t[/C][C]0.17120575811066[/C][C]0.029137[/C][C]5.876[/C][C]0[/C][C]0[/C][/ROW]
[/TABLE]
Source: https://freestatistics.org/blog/index.php?pk=57918&T=2

Globally Unique Identifier (entire table): ba.freestatistics.org/blog/index.php?pk=57918&T=2

As an alternative you can also use a QR Code:  

The GUIDs for individual cells are displayed in the table below:

Multiple Linear Regression - Ordinary Least Squares
VariableParameterS.D.T-STATH0: parameter = 02-tail p-value1-tail p-value
(Intercept)-24.621961466786410.456775-2.35460.0228640.011432
X1.314228611839130.09608313.67800
M10.3961538035461742.3460930.16890.866650.433325
M21.128022379642502.3631360.47730.6353790.31769
M3-1.309192918965182.367355-0.5530.5829280.291464
M49.33382180863573.0821013.02840.0040220.002011
M5-4.981329535231772.515298-1.98040.0536560.026828
M6-4.230257037508642.348809-1.8010.0782570.039128
M7-3.33375536219862.343343-1.42260.1615840.080792
M8-2.294475143354942.316977-0.99030.3272140.163607
M9-0.5452588792514532.499253-0.21820.8282630.414131
M100.7484050680332842.4938230.30010.765450.382725
M11-0.5195824577050252.450689-0.2120.8330320.416516
t0.171205758110660.0291375.87600


Multiple Linear Regression - Regression Statistics
Multiple R0.962264891450104
R-squared0.92595372131748
Adjusted R-squared0.905027599081115
F-TEST (value)44.2487007797554
F-TEST (DF numerator)13
F-TEST (DF denominator)46
p-value0
Multiple Linear Regression - Residual Statistics
Residual Standard Deviation3.64189471923847
Sum Squared Residuals610.116268716785

\begin{tabular}{lllllllll}
\hline
Multiple Linear Regression - Regression Statistics \tabularnewline
Multiple R & 0.962264891450104 \tabularnewline
R-squared & 0.92595372131748 \tabularnewline
Adjusted R-squared & 0.905027599081115 \tabularnewline
F-TEST (value) & 44.2487007797554 \tabularnewline
F-TEST (DF numerator) & 13 \tabularnewline
F-TEST (DF denominator) & 46 \tabularnewline
p-value & 0 \tabularnewline
Multiple Linear Regression - Residual Statistics \tabularnewline
Residual Standard Deviation & 3.64189471923847 \tabularnewline
Sum Squared Residuals & 610.116268716785 \tabularnewline
\hline
\end{tabular}
%Source: https://freestatistics.org/blog/index.php?pk=57918&T=3

[TABLE]
[ROW][C]Multiple Linear Regression - Regression Statistics[/C][/ROW]
[ROW][C]Multiple R[/C][C]0.962264891450104[/C][/ROW]
[ROW][C]R-squared[/C][C]0.92595372131748[/C][/ROW]
[ROW][C]Adjusted R-squared[/C][C]0.905027599081115[/C][/ROW]
[ROW][C]F-TEST (value)[/C][C]44.2487007797554[/C][/ROW]
[ROW][C]F-TEST (DF numerator)[/C][C]13[/C][/ROW]
[ROW][C]F-TEST (DF denominator)[/C][C]46[/C][/ROW]
[ROW][C]p-value[/C][C]0[/C][/ROW]
[ROW][C]Multiple Linear Regression - Residual Statistics[/C][/ROW]
[ROW][C]Residual Standard Deviation[/C][C]3.64189471923847[/C][/ROW]
[ROW][C]Sum Squared Residuals[/C][C]610.116268716785[/C][/ROW]
[/TABLE]
Source: https://freestatistics.org/blog/index.php?pk=57918&T=3

Globally Unique Identifier (entire table): ba.freestatistics.org/blog/index.php?pk=57918&T=3

As an alternative you can also use a QR Code:  

The GUIDs for individual cells are displayed in the table below:

Multiple Linear Regression - Regression Statistics
Multiple R0.962264891450104
R-squared0.92595372131748
Adjusted R-squared0.905027599081115
F-TEST (value)44.2487007797554
F-TEST (DF numerator)13
F-TEST (DF denominator)46
p-value0
Multiple Linear Regression - Residual Statistics
Residual Standard Deviation3.64189471923847
Sum Squared Residuals610.116268716785


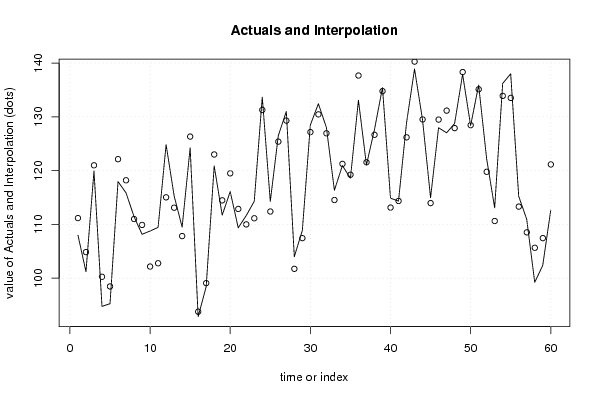
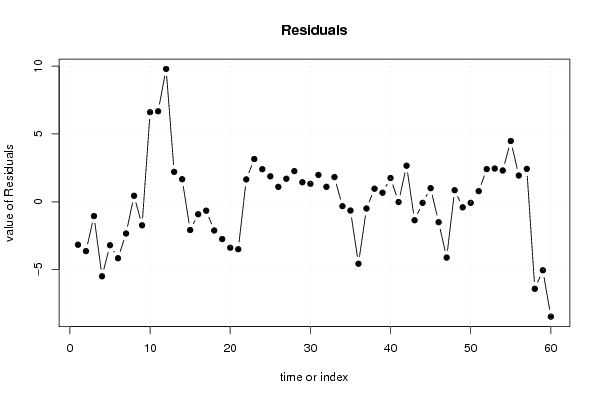
Multiple Linear Regression - Actuals, Interpolation, and Residuals
Time or IndexActualsInterpolationForecastResidualsPrediction Error
1108.01111.179522253117-3.16952225311654
2101.21104.854339222208-3.64433922220817
3119.93120.987530247459-1.05753024745896
494.76100.260264049031-5.50026404903146
595.2698.4700674145624-3.21006741456242
6117.96122.128500655213-4.16850065521311
7115.86118.202139363645-2.34213936364512
8111.44111.0015622248290.438437775170948
9108.16109.899258439813-1.73925843981319
10108.77102.1645278623356.60547213766529
11109.45102.7762432900986.67375670990207
12124.83115.0322432900989.79775670990208
13115.31113.1025684892602.20743151073959
14109.49107.8287683478231.66123165217649
15124.24126.327570874385-2.0875708743847
1692.8593.772247169405-0.92224716940508
1798.4299.0788850388673-0.658885038867318
18120.88123.000164001886-2.12016400188582
19111.72114.474002568881-2.75400256888090
20116.1119.495751520169-3.39575152016868
21109.37112.873687565428-3.5036875654285
22111.65110.0016028517551.64839714824522
23114.29111.1390097242543.15099027574635
24133.68131.2803813952882.3996186047116
25114.27112.3971575017261.87284249827382
26126.49125.3911350648531.09886493514687
27131129.3021.69800000000001
28104101.7407450200092.25925497999095
29108.88107.4416514730231.43834852697696
30128.48127.1573988781561.32260112184365
31132.44130.4592949517041.98070504829644
32128.04126.9385579260371.10144207396297
33116.35114.5338880792051.81611192079531
34120.93121.255672231957-0.325672231956583
35118.59119.238930436042-0.648930436041546
36133.1137.671804911685-4.57180491168545
37121.05121.548461102985-0.498461102985367
38127.62126.6570669950780.962933004922446
39135.44134.7734634881100.666536511890348
40114.88113.1262372613951.75376273860523
41114.34114.358766434156-0.0187664341557281
42128.85126.1891421682542.66085783174573
43138.9140.267712858882-1.36771285888232
44129.44129.518718468101-0.078718468100583
45114.96113.9598999528541.00010004714564
46127.98129.487015804928-1.50701580492840
47127.03131.150114122163-4.12011412216291
48128.75127.8982165024610.851783497538777
49137.91138.322290652912-0.412290652911507
50128.37128.448690370038-0.0786903700376452
51135.9135.1194353900470.780564609953298
52122.19119.7805065001602.40949349984037
53113.08110.6306296393912.44937036060851
54136.2133.8947942964902.30520570350956
55138133.5168502568884.48314974311191
56115.24113.3054098608651.93459013913534
57110.95108.5232659626992.42673403730075
5899.23105.651181249026-6.42118124902553
59102.39107.445702427444-5.05570242744397
60112.67121.147353900467-8.47735390046699

\begin{tabular}{lllllllll}
\hline
Multiple Linear Regression - Actuals, Interpolation, and Residuals \tabularnewline
Time or Index & Actuals & InterpolationForecast & ResidualsPrediction Error \tabularnewline
1 & 108.01 & 111.179522253117 & -3.16952225311654 \tabularnewline
2 & 101.21 & 104.854339222208 & -3.64433922220817 \tabularnewline
3 & 119.93 & 120.987530247459 & -1.05753024745896 \tabularnewline
4 & 94.76 & 100.260264049031 & -5.50026404903146 \tabularnewline
5 & 95.26 & 98.4700674145624 & -3.21006741456242 \tabularnewline
6 & 117.96 & 122.128500655213 & -4.16850065521311 \tabularnewline
7 & 115.86 & 118.202139363645 & -2.34213936364512 \tabularnewline
8 & 111.44 & 111.001562224829 & 0.438437775170948 \tabularnewline
9 & 108.16 & 109.899258439813 & -1.73925843981319 \tabularnewline
10 & 108.77 & 102.164527862335 & 6.60547213766529 \tabularnewline
11 & 109.45 & 102.776243290098 & 6.67375670990207 \tabularnewline
12 & 124.83 & 115.032243290098 & 9.79775670990208 \tabularnewline
13 & 115.31 & 113.102568489260 & 2.20743151073959 \tabularnewline
14 & 109.49 & 107.828768347823 & 1.66123165217649 \tabularnewline
15 & 124.24 & 126.327570874385 & -2.0875708743847 \tabularnewline
16 & 92.85 & 93.772247169405 & -0.92224716940508 \tabularnewline
17 & 98.42 & 99.0788850388673 & -0.658885038867318 \tabularnewline
18 & 120.88 & 123.000164001886 & -2.12016400188582 \tabularnewline
19 & 111.72 & 114.474002568881 & -2.75400256888090 \tabularnewline
20 & 116.1 & 119.495751520169 & -3.39575152016868 \tabularnewline
21 & 109.37 & 112.873687565428 & -3.5036875654285 \tabularnewline
22 & 111.65 & 110.001602851755 & 1.64839714824522 \tabularnewline
23 & 114.29 & 111.139009724254 & 3.15099027574635 \tabularnewline
24 & 133.68 & 131.280381395288 & 2.3996186047116 \tabularnewline
25 & 114.27 & 112.397157501726 & 1.87284249827382 \tabularnewline
26 & 126.49 & 125.391135064853 & 1.09886493514687 \tabularnewline
27 & 131 & 129.302 & 1.69800000000001 \tabularnewline
28 & 104 & 101.740745020009 & 2.25925497999095 \tabularnewline
29 & 108.88 & 107.441651473023 & 1.43834852697696 \tabularnewline
30 & 128.48 & 127.157398878156 & 1.32260112184365 \tabularnewline
31 & 132.44 & 130.459294951704 & 1.98070504829644 \tabularnewline
32 & 128.04 & 126.938557926037 & 1.10144207396297 \tabularnewline
33 & 116.35 & 114.533888079205 & 1.81611192079531 \tabularnewline
34 & 120.93 & 121.255672231957 & -0.325672231956583 \tabularnewline
35 & 118.59 & 119.238930436042 & -0.648930436041546 \tabularnewline
36 & 133.1 & 137.671804911685 & -4.57180491168545 \tabularnewline
37 & 121.05 & 121.548461102985 & -0.498461102985367 \tabularnewline
38 & 127.62 & 126.657066995078 & 0.962933004922446 \tabularnewline
39 & 135.44 & 134.773463488110 & 0.666536511890348 \tabularnewline
40 & 114.88 & 113.126237261395 & 1.75376273860523 \tabularnewline
41 & 114.34 & 114.358766434156 & -0.0187664341557281 \tabularnewline
42 & 128.85 & 126.189142168254 & 2.66085783174573 \tabularnewline
43 & 138.9 & 140.267712858882 & -1.36771285888232 \tabularnewline
44 & 129.44 & 129.518718468101 & -0.078718468100583 \tabularnewline
45 & 114.96 & 113.959899952854 & 1.00010004714564 \tabularnewline
46 & 127.98 & 129.487015804928 & -1.50701580492840 \tabularnewline
47 & 127.03 & 131.150114122163 & -4.12011412216291 \tabularnewline
48 & 128.75 & 127.898216502461 & 0.851783497538777 \tabularnewline
49 & 137.91 & 138.322290652912 & -0.412290652911507 \tabularnewline
50 & 128.37 & 128.448690370038 & -0.0786903700376452 \tabularnewline
51 & 135.9 & 135.119435390047 & 0.780564609953298 \tabularnewline
52 & 122.19 & 119.780506500160 & 2.40949349984037 \tabularnewline
53 & 113.08 & 110.630629639391 & 2.44937036060851 \tabularnewline
54 & 136.2 & 133.894794296490 & 2.30520570350956 \tabularnewline
55 & 138 & 133.516850256888 & 4.48314974311191 \tabularnewline
56 & 115.24 & 113.305409860865 & 1.93459013913534 \tabularnewline
57 & 110.95 & 108.523265962699 & 2.42673403730075 \tabularnewline
58 & 99.23 & 105.651181249026 & -6.42118124902553 \tabularnewline
59 & 102.39 & 107.445702427444 & -5.05570242744397 \tabularnewline
60 & 112.67 & 121.147353900467 & -8.47735390046699 \tabularnewline
\hline
\end{tabular}
%Source: https://freestatistics.org/blog/index.php?pk=57918&T=4

[TABLE]
[ROW][C]Multiple Linear Regression - Actuals, Interpolation, and Residuals[/C][/ROW]
[ROW][C]Time or Index[/C][C]Actuals[/C][C]InterpolationForecast[/C][C]ResidualsPrediction Error[/C][/ROW]
[ROW][C]1[/C][C]108.01[/C][C]111.179522253117[/C][C]-3.16952225311654[/C][/ROW]
[ROW][C]2[/C][C]101.21[/C][C]104.854339222208[/C][C]-3.64433922220817[/C][/ROW]
[ROW][C]3[/C][C]119.93[/C][C]120.987530247459[/C][C]-1.05753024745896[/C][/ROW]
[ROW][C]4[/C][C]94.76[/C][C]100.260264049031[/C][C]-5.50026404903146[/C][/ROW]
[ROW][C]5[/C][C]95.26[/C][C]98.4700674145624[/C][C]-3.21006741456242[/C][/ROW]
[ROW][C]6[/C][C]117.96[/C][C]122.128500655213[/C][C]-4.16850065521311[/C][/ROW]
[ROW][C]7[/C][C]115.86[/C][C]118.202139363645[/C][C]-2.34213936364512[/C][/ROW]
[ROW][C]8[/C][C]111.44[/C][C]111.001562224829[/C][C]0.438437775170948[/C][/ROW]
[ROW][C]9[/C][C]108.16[/C][C]109.899258439813[/C][C]-1.73925843981319[/C][/ROW]
[ROW][C]10[/C][C]108.77[/C][C]102.164527862335[/C][C]6.60547213766529[/C][/ROW]
[ROW][C]11[/C][C]109.45[/C][C]102.776243290098[/C][C]6.67375670990207[/C][/ROW]
[ROW][C]12[/C][C]124.83[/C][C]115.032243290098[/C][C]9.79775670990208[/C][/ROW]
[ROW][C]13[/C][C]115.31[/C][C]113.102568489260[/C][C]2.20743151073959[/C][/ROW]
[ROW][C]14[/C][C]109.49[/C][C]107.828768347823[/C][C]1.66123165217649[/C][/ROW]
[ROW][C]15[/C][C]124.24[/C][C]126.327570874385[/C][C]-2.0875708743847[/C][/ROW]
[ROW][C]16[/C][C]92.85[/C][C]93.772247169405[/C][C]-0.92224716940508[/C][/ROW]
[ROW][C]17[/C][C]98.42[/C][C]99.0788850388673[/C][C]-0.658885038867318[/C][/ROW]
[ROW][C]18[/C][C]120.88[/C][C]123.000164001886[/C][C]-2.12016400188582[/C][/ROW]
[ROW][C]19[/C][C]111.72[/C][C]114.474002568881[/C][C]-2.75400256888090[/C][/ROW]
[ROW][C]20[/C][C]116.1[/C][C]119.495751520169[/C][C]-3.39575152016868[/C][/ROW]
[ROW][C]21[/C][C]109.37[/C][C]112.873687565428[/C][C]-3.5036875654285[/C][/ROW]
[ROW][C]22[/C][C]111.65[/C][C]110.001602851755[/C][C]1.64839714824522[/C][/ROW]
[ROW][C]23[/C][C]114.29[/C][C]111.139009724254[/C][C]3.15099027574635[/C][/ROW]
[ROW][C]24[/C][C]133.68[/C][C]131.280381395288[/C][C]2.3996186047116[/C][/ROW]
[ROW][C]25[/C][C]114.27[/C][C]112.397157501726[/C][C]1.87284249827382[/C][/ROW]
[ROW][C]26[/C][C]126.49[/C][C]125.391135064853[/C][C]1.09886493514687[/C][/ROW]
[ROW][C]27[/C][C]131[/C][C]129.302[/C][C]1.69800000000001[/C][/ROW]
[ROW][C]28[/C][C]104[/C][C]101.740745020009[/C][C]2.25925497999095[/C][/ROW]
[ROW][C]29[/C][C]108.88[/C][C]107.441651473023[/C][C]1.43834852697696[/C][/ROW]
[ROW][C]30[/C][C]128.48[/C][C]127.157398878156[/C][C]1.32260112184365[/C][/ROW]
[ROW][C]31[/C][C]132.44[/C][C]130.459294951704[/C][C]1.98070504829644[/C][/ROW]
[ROW][C]32[/C][C]128.04[/C][C]126.938557926037[/C][C]1.10144207396297[/C][/ROW]
[ROW][C]33[/C][C]116.35[/C][C]114.533888079205[/C][C]1.81611192079531[/C][/ROW]
[ROW][C]34[/C][C]120.93[/C][C]121.255672231957[/C][C]-0.325672231956583[/C][/ROW]
[ROW][C]35[/C][C]118.59[/C][C]119.238930436042[/C][C]-0.648930436041546[/C][/ROW]
[ROW][C]36[/C][C]133.1[/C][C]137.671804911685[/C][C]-4.57180491168545[/C][/ROW]
[ROW][C]37[/C][C]121.05[/C][C]121.548461102985[/C][C]-0.498461102985367[/C][/ROW]
[ROW][C]38[/C][C]127.62[/C][C]126.657066995078[/C][C]0.962933004922446[/C][/ROW]
[ROW][C]39[/C][C]135.44[/C][C]134.773463488110[/C][C]0.666536511890348[/C][/ROW]
[ROW][C]40[/C][C]114.88[/C][C]113.126237261395[/C][C]1.75376273860523[/C][/ROW]
[ROW][C]41[/C][C]114.34[/C][C]114.358766434156[/C][C]-0.0187664341557281[/C][/ROW]
[ROW][C]42[/C][C]128.85[/C][C]126.189142168254[/C][C]2.66085783174573[/C][/ROW]
[ROW][C]43[/C][C]138.9[/C][C]140.267712858882[/C][C]-1.36771285888232[/C][/ROW]
[ROW][C]44[/C][C]129.44[/C][C]129.518718468101[/C][C]-0.078718468100583[/C][/ROW]
[ROW][C]45[/C][C]114.96[/C][C]113.959899952854[/C][C]1.00010004714564[/C][/ROW]
[ROW][C]46[/C][C]127.98[/C][C]129.487015804928[/C][C]-1.50701580492840[/C][/ROW]
[ROW][C]47[/C][C]127.03[/C][C]131.150114122163[/C][C]-4.12011412216291[/C][/ROW]
[ROW][C]48[/C][C]128.75[/C][C]127.898216502461[/C][C]0.851783497538777[/C][/ROW]
[ROW][C]49[/C][C]137.91[/C][C]138.322290652912[/C][C]-0.412290652911507[/C][/ROW]
[ROW][C]50[/C][C]128.37[/C][C]128.448690370038[/C][C]-0.0786903700376452[/C][/ROW]
[ROW][C]51[/C][C]135.9[/C][C]135.119435390047[/C][C]0.780564609953298[/C][/ROW]
[ROW][C]52[/C][C]122.19[/C][C]119.780506500160[/C][C]2.40949349984037[/C][/ROW]
[ROW][C]53[/C][C]113.08[/C][C]110.630629639391[/C][C]2.44937036060851[/C][/ROW]
[ROW][C]54[/C][C]136.2[/C][C]133.894794296490[/C][C]2.30520570350956[/C][/ROW]
[ROW][C]55[/C][C]138[/C][C]133.516850256888[/C][C]4.48314974311191[/C][/ROW]
[ROW][C]56[/C][C]115.24[/C][C]113.305409860865[/C][C]1.93459013913534[/C][/ROW]
[ROW][C]57[/C][C]110.95[/C][C]108.523265962699[/C][C]2.42673403730075[/C][/ROW]
[ROW][C]58[/C][C]99.23[/C][C]105.651181249026[/C][C]-6.42118124902553[/C][/ROW]
[ROW][C]59[/C][C]102.39[/C][C]107.445702427444[/C][C]-5.05570242744397[/C][/ROW]
[ROW][C]60[/C][C]112.67[/C][C]121.147353900467[/C][C]-8.47735390046699[/C][/ROW]
[/TABLE]
Source: https://freestatistics.org/blog/index.php?pk=57918&T=4

Globally Unique Identifier (entire table): ba.freestatistics.org/blog/index.php?pk=57918&T=4

As an alternative you can also use a QR Code:  

The GUIDs for individual cells are displayed in the table below:

Multiple Linear Regression - Actuals, Interpolation, and Residuals
Time or IndexActualsInterpolationForecastResidualsPrediction Error
1108.01111.179522253117-3.16952225311654
2101.21104.854339222208-3.64433922220817
3119.93120.987530247459-1.05753024745896
494.76100.260264049031-5.50026404903146
595.2698.4700674145624-3.21006741456242
6117.96122.128500655213-4.16850065521311
7115.86118.202139363645-2.34213936364512
8111.44111.0015622248290.438437775170948
9108.16109.899258439813-1.73925843981319
10108.77102.1645278623356.60547213766529
11109.45102.7762432900986.67375670990207
12124.83115.0322432900989.79775670990208
13115.31113.1025684892602.20743151073959
14109.49107.8287683478231.66123165217649
15124.24126.327570874385-2.0875708743847
1692.8593.772247169405-0.92224716940508
1798.4299.0788850388673-0.658885038867318
18120.88123.000164001886-2.12016400188582
19111.72114.474002568881-2.75400256888090
20116.1119.495751520169-3.39575152016868
21109.37112.873687565428-3.5036875654285
22111.65110.0016028517551.64839714824522
23114.29111.1390097242543.15099027574635
24133.68131.2803813952882.3996186047116
25114.27112.3971575017261.87284249827382
26126.49125.3911350648531.09886493514687
27131129.3021.69800000000001
28104101.7407450200092.25925497999095
29108.88107.4416514730231.43834852697696
30128.48127.1573988781561.32260112184365
31132.44130.4592949517041.98070504829644
32128.04126.9385579260371.10144207396297
33116.35114.5338880792051.81611192079531
34120.93121.255672231957-0.325672231956583
35118.59119.238930436042-0.648930436041546
36133.1137.671804911685-4.57180491168545
37121.05121.548461102985-0.498461102985367
38127.62126.6570669950780.962933004922446
39135.44134.7734634881100.666536511890348
40114.88113.1262372613951.75376273860523
41114.34114.358766434156-0.0187664341557281
42128.85126.1891421682542.66085783174573
43138.9140.267712858882-1.36771285888232
44129.44129.518718468101-0.078718468100583
45114.96113.9598999528541.00010004714564
46127.98129.487015804928-1.50701580492840
47127.03131.150114122163-4.12011412216291
48128.75127.8982165024610.851783497538777
49137.91138.322290652912-0.412290652911507
50128.37128.448690370038-0.0786903700376452
51135.9135.1194353900470.780564609953298
52122.19119.7805065001602.40949349984037
53113.08110.6306296393912.44937036060851
54136.2133.8947942964902.30520570350956
55138133.5168502568884.48314974311191
56115.24113.3054098608651.93459013913534
57110.95108.5232659626992.42673403730075
5899.23105.651181249026-6.42118124902553
59102.39107.445702427444-5.05570242744397
60112.67121.147353900467-8.47735390046699


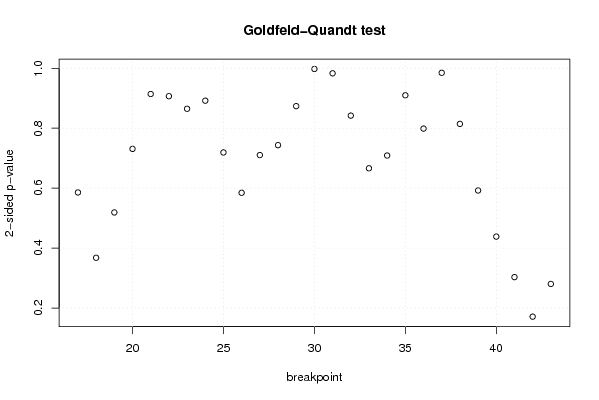
Goldfeld-Quandt test for Heteroskedasticity
p-valuesAlternative Hypothesis
breakpoint indexgreater2-sidedless
170.2927930703140490.5855861406280980.707206929685951
180.1837974763766820.3675949527533640.816202523623318
190.2594641286574420.5189282573148830.740535871342558
200.3654816851506440.7309633703012870.634518314849357
210.4570431500215850.9140863000431690.542956849978415
220.4533857169543630.9067714339087250.546614283045637
230.4324201803655120.8648403607310240.567579819634488
240.4459073664723630.8918147329447270.554092633527637
250.3595590058400810.7191180116801620.640440994159919
260.707735986252880.584528027494240.29226401374712
270.644816265331710.710367469336580.35518373466829
280.6282826126479190.7434347747041620.371717387352081
290.563210335627070.873579328745860.43678966437293
300.5011339486080530.9977321027838930.498866051391947
310.5084080525099540.9831838949800930.491591947490046
320.4209806345098480.8419612690196960.579019365490152
330.333106281989340.666212563978680.66689371801066
340.3544028483975870.7088056967951740.645597151602413
350.4549208320398580.9098416640797160.545079167960142
360.600676109206170.7986477815876610.399323890793830
370.5075552480912560.9848895038174870.492444751908744
380.4071426075273020.8142852150546050.592857392472698
390.2960896197763180.5921792395526370.703910380223682
400.2191144011060560.4382288022121120.780885598893944
410.1514889068383980.3029778136767960.848511093161602
420.08556010779206090.1711202155841220.91443989220794
430.1401417443157760.2802834886315510.859858255684224

\begin{tabular}{lllllllll}
\hline
Goldfeld-Quandt test for Heteroskedasticity \tabularnewline
p-values & Alternative Hypothesis \tabularnewline
breakpoint index & greater & 2-sided & less \tabularnewline
17 & 0.292793070314049 & 0.585586140628098 & 0.707206929685951 \tabularnewline
18 & 0.183797476376682 & 0.367594952753364 & 0.816202523623318 \tabularnewline
19 & 0.259464128657442 & 0.518928257314883 & 0.740535871342558 \tabularnewline
20 & 0.365481685150644 & 0.730963370301287 & 0.634518314849357 \tabularnewline
21 & 0.457043150021585 & 0.914086300043169 & 0.542956849978415 \tabularnewline
22 & 0.453385716954363 & 0.906771433908725 & 0.546614283045637 \tabularnewline
23 & 0.432420180365512 & 0.864840360731024 & 0.567579819634488 \tabularnewline
24 & 0.445907366472363 & 0.891814732944727 & 0.554092633527637 \tabularnewline
25 & 0.359559005840081 & 0.719118011680162 & 0.640440994159919 \tabularnewline
26 & 0.70773598625288 & 0.58452802749424 & 0.29226401374712 \tabularnewline
27 & 0.64481626533171 & 0.71036746933658 & 0.35518373466829 \tabularnewline
28 & 0.628282612647919 & 0.743434774704162 & 0.371717387352081 \tabularnewline
29 & 0.56321033562707 & 0.87357932874586 & 0.43678966437293 \tabularnewline
30 & 0.501133948608053 & 0.997732102783893 & 0.498866051391947 \tabularnewline
31 & 0.508408052509954 & 0.983183894980093 & 0.491591947490046 \tabularnewline
32 & 0.420980634509848 & 0.841961269019696 & 0.579019365490152 \tabularnewline
33 & 0.33310628198934 & 0.66621256397868 & 0.66689371801066 \tabularnewline
34 & 0.354402848397587 & 0.708805696795174 & 0.645597151602413 \tabularnewline
35 & 0.454920832039858 & 0.909841664079716 & 0.545079167960142 \tabularnewline
36 & 0.60067610920617 & 0.798647781587661 & 0.399323890793830 \tabularnewline
37 & 0.507555248091256 & 0.984889503817487 & 0.492444751908744 \tabularnewline
38 & 0.407142607527302 & 0.814285215054605 & 0.592857392472698 \tabularnewline
39 & 0.296089619776318 & 0.592179239552637 & 0.703910380223682 \tabularnewline
40 & 0.219114401106056 & 0.438228802212112 & 0.780885598893944 \tabularnewline
41 & 0.151488906838398 & 0.302977813676796 & 0.848511093161602 \tabularnewline
42 & 0.0855601077920609 & 0.171120215584122 & 0.91443989220794 \tabularnewline
43 & 0.140141744315776 & 0.280283488631551 & 0.859858255684224 \tabularnewline
\hline
\end{tabular}
%Source: https://freestatistics.org/blog/index.php?pk=57918&T=5

[TABLE]
[ROW][C]Goldfeld-Quandt test for Heteroskedasticity[/C][/ROW]
[ROW][C]p-values[/C][C]Alternative Hypothesis[/C][/ROW]
[ROW][C]breakpoint index[/C][C]greater[/C][C]2-sided[/C][C]less[/C][/ROW]
[ROW][C]17[/C][C]0.292793070314049[/C][C]0.585586140628098[/C][C]0.707206929685951[/C][/ROW]
[ROW][C]18[/C][C]0.183797476376682[/C][C]0.367594952753364[/C][C]0.816202523623318[/C][/ROW]
[ROW][C]19[/C][C]0.259464128657442[/C][C]0.518928257314883[/C][C]0.740535871342558[/C][/ROW]
[ROW][C]20[/C][C]0.365481685150644[/C][C]0.730963370301287[/C][C]0.634518314849357[/C][/ROW]
[ROW][C]21[/C][C]0.457043150021585[/C][C]0.914086300043169[/C][C]0.542956849978415[/C][/ROW]
[ROW][C]22[/C][C]0.453385716954363[/C][C]0.906771433908725[/C][C]0.546614283045637[/C][/ROW]
[ROW][C]23[/C][C]0.432420180365512[/C][C]0.864840360731024[/C][C]0.567579819634488[/C][/ROW]
[ROW][C]24[/C][C]0.445907366472363[/C][C]0.891814732944727[/C][C]0.554092633527637[/C][/ROW]
[ROW][C]25[/C][C]0.359559005840081[/C][C]0.719118011680162[/C][C]0.640440994159919[/C][/ROW]
[ROW][C]26[/C][C]0.70773598625288[/C][C]0.58452802749424[/C][C]0.29226401374712[/C][/ROW]
[ROW][C]27[/C][C]0.64481626533171[/C][C]0.71036746933658[/C][C]0.35518373466829[/C][/ROW]
[ROW][C]28[/C][C]0.628282612647919[/C][C]0.743434774704162[/C][C]0.371717387352081[/C][/ROW]
[ROW][C]29[/C][C]0.56321033562707[/C][C]0.87357932874586[/C][C]0.43678966437293[/C][/ROW]
[ROW][C]30[/C][C]0.501133948608053[/C][C]0.997732102783893[/C][C]0.498866051391947[/C][/ROW]
[ROW][C]31[/C][C]0.508408052509954[/C][C]0.983183894980093[/C][C]0.491591947490046[/C][/ROW]
[ROW][C]32[/C][C]0.420980634509848[/C][C]0.841961269019696[/C][C]0.579019365490152[/C][/ROW]
[ROW][C]33[/C][C]0.33310628198934[/C][C]0.66621256397868[/C][C]0.66689371801066[/C][/ROW]
[ROW][C]34[/C][C]0.354402848397587[/C][C]0.708805696795174[/C][C]0.645597151602413[/C][/ROW]
[ROW][C]35[/C][C]0.454920832039858[/C][C]0.909841664079716[/C][C]0.545079167960142[/C][/ROW]
[ROW][C]36[/C][C]0.60067610920617[/C][C]0.798647781587661[/C][C]0.399323890793830[/C][/ROW]
[ROW][C]37[/C][C]0.507555248091256[/C][C]0.984889503817487[/C][C]0.492444751908744[/C][/ROW]
[ROW][C]38[/C][C]0.407142607527302[/C][C]0.814285215054605[/C][C]0.592857392472698[/C][/ROW]
[ROW][C]39[/C][C]0.296089619776318[/C][C]0.592179239552637[/C][C]0.703910380223682[/C][/ROW]
[ROW][C]40[/C][C]0.219114401106056[/C][C]0.438228802212112[/C][C]0.780885598893944[/C][/ROW]
[ROW][C]41[/C][C]0.151488906838398[/C][C]0.302977813676796[/C][C]0.848511093161602[/C][/ROW]
[ROW][C]42[/C][C]0.0855601077920609[/C][C]0.171120215584122[/C][C]0.91443989220794[/C][/ROW]
[ROW][C]43[/C][C]0.140141744315776[/C][C]0.280283488631551[/C][C]0.859858255684224[/C][/ROW]
[/TABLE]
Source: https://freestatistics.org/blog/index.php?pk=57918&T=5

Globally Unique Identifier (entire table): ba.freestatistics.org/blog/index.php?pk=57918&T=5

As an alternative you can also use a QR Code:  

The GUIDs for individual cells are displayed in the table below:

Goldfeld-Quandt test for Heteroskedasticity
p-valuesAlternative Hypothesis
breakpoint indexgreater2-sidedless
170.2927930703140490.5855861406280980.707206929685951
180.1837974763766820.3675949527533640.816202523623318
190.2594641286574420.5189282573148830.740535871342558
200.3654816851506440.7309633703012870.634518314849357
210.4570431500215850.9140863000431690.542956849978415
220.4533857169543630.9067714339087250.546614283045637
230.4324201803655120.8648403607310240.567579819634488
240.4459073664723630.8918147329447270.554092633527637
250.3595590058400810.7191180116801620.640440994159919
260.707735986252880.584528027494240.29226401374712
270.644816265331710.710367469336580.35518373466829
280.6282826126479190.7434347747041620.371717387352081
290.563210335627070.873579328745860.43678966437293
300.5011339486080530.9977321027838930.498866051391947
310.5084080525099540.9831838949800930.491591947490046
320.4209806345098480.8419612690196960.579019365490152
330.333106281989340.666212563978680.66689371801066
340.3544028483975870.7088056967951740.645597151602413
350.4549208320398580.9098416640797160.545079167960142
360.600676109206170.7986477815876610.399323890793830
370.5075552480912560.9848895038174870.492444751908744
380.4071426075273020.8142852150546050.592857392472698
390.2960896197763180.5921792395526370.703910380223682
400.2191144011060560.4382288022121120.780885598893944
410.1514889068383980.3029778136767960.848511093161602
420.08556010779206090.1711202155841220.91443989220794
430.1401417443157760.2802834886315510.859858255684224


Meta Analysis of Goldfeld-Quandt test for Heteroskedasticity
Description# significant tests% significant testsOK/NOK
1% type I error level00OK
5% type I error level00OK
10% type I error level00OK

\begin{tabular}{lllllllll}
\hline
Meta Analysis of Goldfeld-Quandt test for Heteroskedasticity \tabularnewline
Description & # significant tests & % significant tests & OK/NOK \tabularnewline
1% type I error level & 0 & 0 & OK \tabularnewline
5% type I error level & 0 & 0 & OK \tabularnewline
10% type I error level & 0 & 0 & OK \tabularnewline
\hline
\end{tabular}
%Source: https://freestatistics.org/blog/index.php?pk=57918&T=6

[TABLE]
[ROW][C]Meta Analysis of Goldfeld-Quandt test for Heteroskedasticity[/C][/ROW]
[ROW][C]Description[/C][C]# significant tests[/C][C]% significant tests[/C][C]OK/NOK[/C][/ROW]
[ROW][C]1% type I error level[/C][C]0[/C][C]0[/C][C]OK[/C][/ROW]
[ROW][C]5% type I error level[/C][C]0[/C][C]0[/C][C]OK[/C][/ROW]
[ROW][C]10% type I error level[/C][C]0[/C][C]0[/C][C]OK[/C][/ROW]
[/TABLE]
Source: https://freestatistics.org/blog/index.php?pk=57918&T=6

Globally Unique Identifier (entire table): ba.freestatistics.org/blog/index.php?pk=57918&T=6

As an alternative you can also use a QR Code:  

The GUIDs for individual cells are displayed in the table below:

Meta Analysis of Goldfeld-Quandt test for Heteroskedasticity
Description# significant tests% significant testsOK/NOK
1% type I error level00OK
5% type I error level00OK
10% type I error level00OK


Parameters (Session):
par1 = 1 ; par2 = Include Monthly Dummies ; par3 = Linear Trend ;
Parameters (R input):
par1 = 1 ; par2 = Include Monthly Dummies ; par3 = Linear Trend ;
R code (references can be found in the software module):
library(lattice)
library(lmtest)
n25 <- 25 #minimum number of obs. for Goldfeld-Quandt test
par1 <- as.numeric(par1)
x <- t(y)
k <- length(x[1,])
n <- length(x[,1])
x1 <- cbind(x[,par1], x[,1:k!=par1])
mycolnames <- c(colnames(x)[par1], colnames(x)[1:k!=par1])
colnames(x1) <- mycolnames #colnames(x)[par1]
x <- x1
if (par3 == 'First Differences'){
x2 <- array(0, dim=c(n-1,k), dimnames=list(1:(n-1), paste('(1-B)',colnames(x),sep='')))
for (i in 1:n-1) {
for (j in 1:k) {
x2[i,j] <- x[i+1,j] - x[i,j]
}
}
x <- x2
}
if (par2 == 'Include Monthly Dummies'){
x2 <- array(0, dim=c(n,11), dimnames=list(1:n, paste('M', seq(1:11), sep ='')))
for (i in 1:11){
x2[seq(i,n,12),i] <- 1
}
x <- cbind(x, x2)
}
if (par2 == 'Include Quarterly Dummies'){
x2 <- array(0, dim=c(n,3), dimnames=list(1:n, paste('Q', seq(1:3), sep ='')))
for (i in 1:3){
x2[seq(i,n,4),i] <- 1
}
x <- cbind(x, x2)
}
k <- length(x[1,])
if (par3 == 'Linear Trend'){
x <- cbind(x, c(1:n))
colnames(x)[k+1] <- 't'
}
x
k <- length(x[1,])
df <- as.data.frame(x)
(mylm <- lm(df))
(mysum <- summary(mylm))
if (n > n25) {
kp3 <- k + 3
nmkm3 <- n - k - 3
gqarr <- array(NA, dim=c(nmkm3-kp3+1,3))
numgqtests <- 0
numsignificant1 <- 0
numsignificant5 <- 0
numsignificant10 <- 0
for (mypoint in kp3:nmkm3) {
j <- 0
numgqtests <- numgqtests + 1
for (myalt in c('greater', 'two.sided', 'less')) {
j <- j + 1
gqarr[mypoint-kp3+1,j] <- gqtest(mylm, point=mypoint, alternative=myalt)$p.value
}
if (gqarr[mypoint-kp3+1,2] < 0.01) numsignificant1 <- numsignificant1 + 1
if (gqarr[mypoint-kp3+1,2] < 0.05) numsignificant5 <- numsignificant5 + 1
if (gqarr[mypoint-kp3+1,2] < 0.10) numsignificant10 <- numsignificant10 + 1
}
gqarr
}
bitmap(file='test0.png')
plot(x[,1], type='l', main='Actuals and Interpolation', ylab='value of Actuals and Interpolation (dots)', xlab='time or index')
points(x[,1]-mysum$resid)
grid()
dev.off()
bitmap(file='test1.png')
plot(mysum$resid, type='b', pch=19, main='Residuals', ylab='value of Residuals', xlab='time or index')
grid()
dev.off()
bitmap(file='test2.png')
hist(mysum$resid, main='Residual Histogram', xlab='values of Residuals')
grid()
dev.off()
bitmap(file='test3.png')
densityplot(~mysum$resid,col='black',main='Residual Density Plot', xlab='values of Residuals')
dev.off()
bitmap(file='test4.png')
qqnorm(mysum$resid, main='Residual Normal Q-Q Plot')
qqline(mysum$resid)
grid()
dev.off()
(myerror <- as.ts(mysum$resid))
bitmap(file='test5.png')
dum <- cbind(lag(myerror,k=1),myerror)
dum
dum1 <- dum[2:length(myerror),]
dum1
z <- as.data.frame(dum1)
z
plot(z,main=paste('Residual Lag plot, lowess, and regression line'), ylab='values of Residuals', xlab='lagged values of Residuals')
lines(lowess(z))
abline(lm(z))
grid()
dev.off()
bitmap(file='test6.png')
acf(mysum$resid, lag.max=length(mysum$resid)/2, main='Residual Autocorrelation Function')
grid()
dev.off()
bitmap(file='test7.png')
pacf(mysum$resid, lag.max=length(mysum$resid)/2, main='Residual Partial Autocorrelation Function')
grid()
dev.off()
bitmap(file='test8.png')
opar <- par(mfrow = c(2,2), oma = c(0, 0, 1.1, 0))
plot(mylm, las = 1, sub='Residual Diagnostics')
par(opar)
dev.off()
if (n > n25) {
bitmap(file='test9.png')
plot(kp3:nmkm3,gqarr[,2], main='Goldfeld-Quandt test',ylab='2-sided p-value',xlab='breakpoint')
grid()
dev.off()
}
load(file='createtable')
a<-table.start()
a<-table.row.start(a)
a<-table.element(a, 'Multiple Linear Regression - Estimated Regression Equation', 1, TRUE)
a<-table.row.end(a)
myeq <- colnames(x)[1]
myeq <- paste(myeq, '[t] = ', sep='')
for (i in 1:k){
if (mysum$coefficients[i,1] > 0) myeq <- paste(myeq, '+', '')
myeq <- paste(myeq, mysum$coefficients[i,1], sep=' ')
if (rownames(mysum$coefficients)[i] != '(Intercept)') {
myeq <- paste(myeq, rownames(mysum$coefficients)[i], sep='')
if (rownames(mysum$coefficients)[i] != 't') myeq <- paste(myeq, '[t]', sep='')
}
}
myeq <- paste(myeq, ' + e[t]')
a<-table.row.start(a)
a<-table.element(a, myeq)
a<-table.row.end(a)
a<-table.end(a)
table.save(a,file='mytable1.tab')
a<-table.start()
a<-table.row.start(a)
a<-table.element(a,hyperlink('ols1.htm','Multiple Linear Regression - Ordinary Least Squares',''), 6, TRUE)
a<-table.row.end(a)
a<-table.row.start(a)
a<-table.element(a,'Variable',header=TRUE)
a<-table.element(a,'Parameter',header=TRUE)
a<-table.element(a,'S.D.',header=TRUE)
a<-table.element(a,'T-STAT
H0: parameter = 0',header=TRUE)
a<-table.element(a,'2-tail p-value',header=TRUE)
a<-table.element(a,'1-tail p-value',header=TRUE)
a<-table.row.end(a)
for (i in 1:k){
a<-table.row.start(a)
a<-table.element(a,rownames(mysum$coefficients)[i],header=TRUE)
a<-table.element(a,mysum$coefficients[i,1])
a<-table.element(a, round(mysum$coefficients[i,2],6))
a<-table.element(a, round(mysum$coefficients[i,3],4))
a<-table.element(a, round(mysum$coefficients[i,4],6))
a<-table.element(a, round(mysum$coefficients[i,4]/2,6))
a<-table.row.end(a)
}
a<-table.end(a)
table.save(a,file='mytable2.tab')
a<-table.start()
a<-table.row.start(a)
a<-table.element(a, 'Multiple Linear Regression - Regression Statistics', 2, TRUE)
a<-table.row.end(a)
a<-table.row.start(a)
a<-table.element(a, 'Multiple R',1,TRUE)
a<-table.element(a, sqrt(mysum$r.squared))
a<-table.row.end(a)
a<-table.row.start(a)
a<-table.element(a, 'R-squared',1,TRUE)
a<-table.element(a, mysum$r.squared)
a<-table.row.end(a)
a<-table.row.start(a)
a<-table.element(a, 'Adjusted R-squared',1,TRUE)
a<-table.element(a, mysum$adj.r.squared)
a<-table.row.end(a)
a<-table.row.start(a)
a<-table.element(a, 'F-TEST (value)',1,TRUE)
a<-table.element(a, mysum$fstatistic[1])
a<-table.row.end(a)
a<-table.row.start(a)
a<-table.element(a, 'F-TEST (DF numerator)',1,TRUE)
a<-table.element(a, mysum$fstatistic[2])
a<-table.row.end(a)
a<-table.row.start(a)
a<-table.element(a, 'F-TEST (DF denominator)',1,TRUE)
a<-table.element(a, mysum$fstatistic[3])
a<-table.row.end(a)
a<-table.row.start(a)
a<-table.element(a, 'p-value',1,TRUE)
a<-table.element(a, 1-pf(mysum$fstatistic[1],mysum$fstatistic[2],mysum$fstatistic[3]))
a<-table.row.end(a)
a<-table.row.start(a)
a<-table.element(a, 'Multiple Linear Regression - Residual Statistics', 2, TRUE)
a<-table.row.end(a)
a<-table.row.start(a)
a<-table.element(a, 'Residual Standard Deviation',1,TRUE)
a<-table.element(a, mysum$sigma)
a<-table.row.end(a)
a<-table.row.start(a)
a<-table.element(a, 'Sum Squared Residuals',1,TRUE)
a<-table.element(a, sum(myerror*myerror))
a<-table.row.end(a)
a<-table.end(a)
table.save(a,file='mytable3.tab')
a<-table.start()
a<-table.row.start(a)
a<-table.element(a, 'Multiple Linear Regression - Actuals, Interpolation, and Residuals', 4, TRUE)
a<-table.row.end(a)
a<-table.row.start(a)
a<-table.element(a, 'Time or Index', 1, TRUE)
a<-table.element(a, 'Actuals', 1, TRUE)
a<-table.element(a, 'Interpolation
Forecast', 1, TRUE)
a<-table.element(a, 'Residuals
Prediction Error', 1, TRUE)
a<-table.row.end(a)
for (i in 1:n) {
a<-table.row.start(a)
a<-table.element(a,i, 1, TRUE)
a<-table.element(a,x[i])
a<-table.element(a,x[i]-mysum$resid[i])
a<-table.element(a,mysum$resid[i])
a<-table.row.end(a)
}
a<-table.end(a)
table.save(a,file='mytable4.tab')
if (n > n25) {
a<-table.start()
a<-table.row.start(a)
a<-table.element(a,'Goldfeld-Quandt test for Heteroskedasticity',4,TRUE)
a<-table.row.end(a)
a<-table.row.start(a)
a<-table.element(a,'p-values',header=TRUE)
a<-table.element(a,'Alternative Hypothesis',3,header=TRUE)
a<-table.row.end(a)
a<-table.row.start(a)
a<-table.element(a,'breakpoint index',header=TRUE)
a<-table.element(a,'greater',header=TRUE)
a<-table.element(a,'2-sided',header=TRUE)
a<-table.element(a,'less',header=TRUE)
a<-table.row.end(a)
for (mypoint in kp3:nmkm3) {
a<-table.row.start(a)
a<-table.element(a,mypoint,header=TRUE)
a<-table.element(a,gqarr[mypoint-kp3+1,1])
a<-table.element(a,gqarr[mypoint-kp3+1,2])
a<-table.element(a,gqarr[mypoint-kp3+1,3])
a<-table.row.end(a)
}
a<-table.end(a)
table.save(a,file='mytable5.tab')
a<-table.start()
a<-table.row.start(a)
a<-table.element(a,'Meta Analysis of Goldfeld-Quandt test for Heteroskedasticity',4,TRUE)
a<-table.row.end(a)
a<-table.row.start(a)
a<-table.element(a,'Description',header=TRUE)
a<-table.element(a,'# significant tests',header=TRUE)
a<-table.element(a,'% significant tests',header=TRUE)
a<-table.element(a,'OK/NOK',header=TRUE)
a<-table.row.end(a)
a<-table.row.start(a)
a<-table.element(a,'1% type I error level',header=TRUE)
a<-table.element(a,numsignificant1)
a<-table.element(a,numsignificant1/numgqtests)
if (numsignificant1/numgqtests < 0.01) dum <- 'OK' else dum <- 'NOK'
a<-table.element(a,dum)
a<-table.row.end(a)
a<-table.row.start(a)
a<-table.element(a,'5% type I error level',header=TRUE)
a<-table.element(a,numsignificant5)
a<-table.element(a,numsignificant5/numgqtests)
if (numsignificant5/numgqtests < 0.05) dum <- 'OK' else dum <- 'NOK'
a<-table.element(a,dum)
a<-table.row.end(a)
a<-table.row.start(a)
a<-table.element(a,'10% type I error level',header=TRUE)
a<-table.element(a,numsignificant10)
a<-table.element(a,numsignificant10/numgqtests)
if (numsignificant10/numgqtests < 0.1) dum <- 'OK' else dum <- 'NOK'
a<-table.element(a,dum)
a<-table.row.end(a)
a<-table.end(a)
table.save(a,file='mytable6.tab')
}