| Multiple Linear Regression - Estimated Regression Equation |
| y[t] = -40.2944805912345 + 0.0638539628062868x[t] + 0.682999055030689y1[t] + 0.122458369917985y2[t] + 0.218214695228774y3[t] + 3.70568054851267M1[t] + 2.87391682631078M2[t] + 1.61334266086646M3[t] + 1.73017385141576M4[t] + 0.646074597671226M5[t] + 2.809494330732M6[t] + 1.90389388989760M7[t] + 0.793880895008001M8[t] -1.33056690921134M9[t] -0.0375894807118368M10[t] -2.25856294729839M11[t] + 0.107006757579222t + e[t] |
| Multiple Linear Regression - Ordinary Least Squares | |||||
| Variable | Parameter | S.D. | T-STAT H0: parameter = 0 | 2-tail p-value | 1-tail p-value |
| (Intercept) | -40.2944805912345 | 15.29372 | -2.6347 | 0.01183 | 0.005915 |
| x | 0.0638539628062868 | 0.023147 | 2.7586 | 0.008634 | 0.004317 |
| y1 | 0.682999055030689 | 0.149917 | 4.5558 | 4.6e-05 | 2.3e-05 |
| y2 | 0.122458369917985 | 0.185172 | 0.6613 | 0.512105 | 0.256052 |
| y3 | 0.218214695228774 | 0.159979 | 1.364 | 0.180003 | 0.090002 |
| M1 | 3.70568054851267 | 2.219616 | 1.6695 | 0.102635 | 0.051317 |
| M2 | 2.87391682631078 | 2.310706 | 1.2437 | 0.22066 | 0.11033 |
| M3 | 1.61334266086646 | 2.245781 | 0.7184 | 0.476592 | 0.238296 |
| M4 | 1.73017385141576 | 2.165772 | 0.7989 | 0.428968 | 0.214484 |
| M5 | 0.646074597671226 | 2.189838 | 0.295 | 0.769457 | 0.384729 |
| M6 | 2.809494330732 | 2.186799 | 1.2848 | 0.20609 | 0.103045 |
| M7 | 1.90389388989760 | 2.236367 | 0.8513 | 0.399529 | 0.199765 |
| M8 | 0.793880895008001 | 2.303007 | 0.3447 | 0.732071 | 0.366035 |
| M9 | -1.33056690921134 | 2.444624 | -0.5443 | 0.589195 | 0.294597 |
| M10 | -0.0375894807118368 | 2.300216 | -0.0163 | 0.987041 | 0.493521 |
| M11 | -2.25856294729839 | 2.326337 | -0.9709 | 0.337308 | 0.168654 |
| t | 0.107006757579222 | 0.057718 | 1.854 | 0.070948 | 0.035474 |
| Multiple Linear Regression - Regression Statistics | |
| Multiple R | 0.931011076253719 |
| R-squared | 0.866781624107108 |
| Adjusted R-squared | 0.814793965222077 |
| F-TEST (value) | 16.6728343360097 |
| F-TEST (DF numerator) | 16 |
| F-TEST (DF denominator) | 41 |
| p-value | 4.49307258065801e-13 |
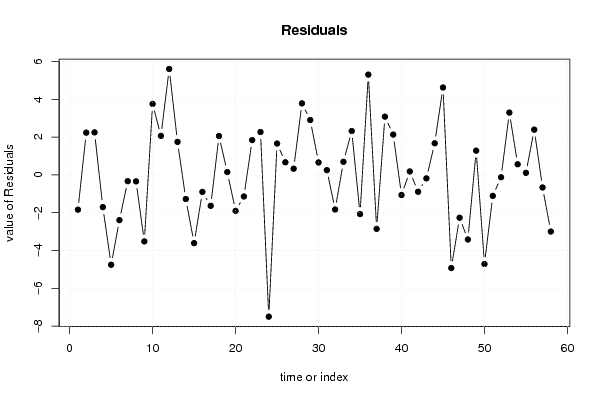
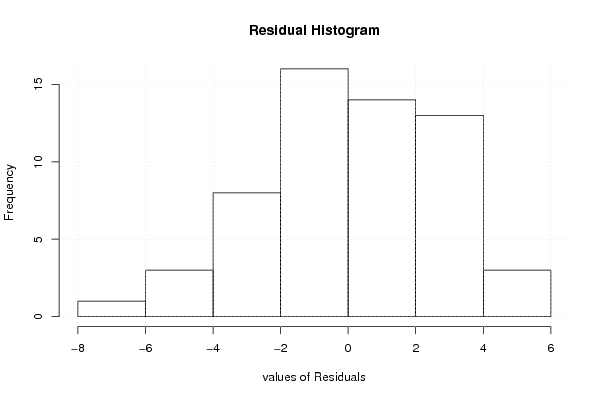
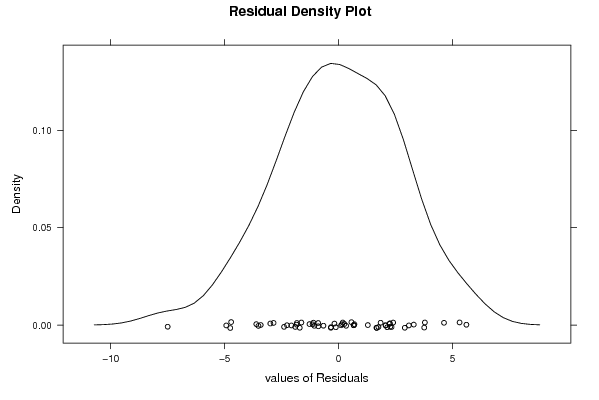
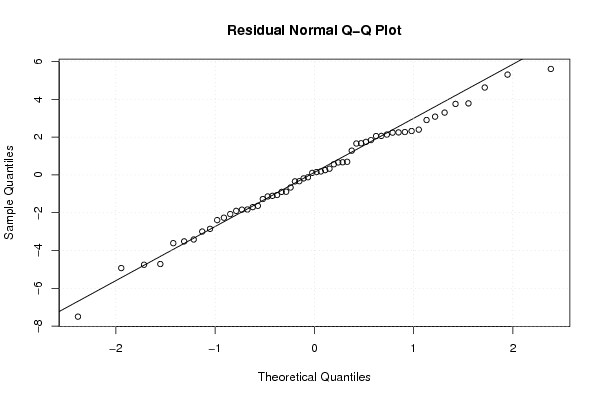
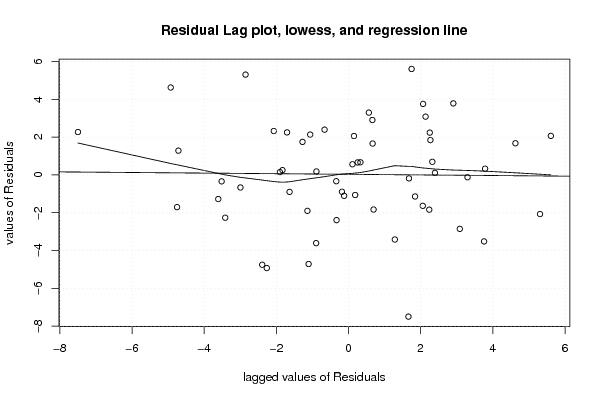
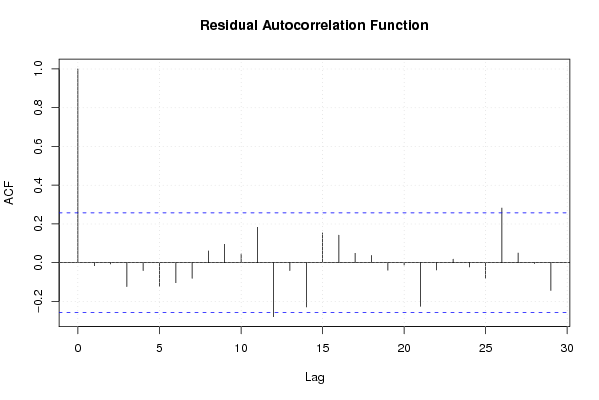
| Multiple Linear Regression - Residual Statistics | |
| Residual Standard Deviation | 3.16773018165331 |
| Sum Squared Residuals | 411.415094654049 |
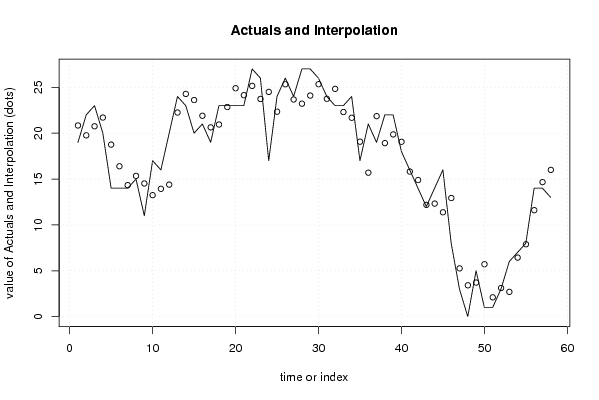
| Multiple Linear Regression - Actuals, Interpolation, and Residuals | |||
| Time or Index | Actuals | Interpolation Forecast | Residuals Prediction Error |
| 1 | 19 | 20.8386264980515 | -1.83862649805149 |
| 2 | 22 | 19.762697356893 | 2.23730264310701 |
| 3 | 23 | 20.7486338837362 | 2.25136611626385 |
| 4 | 20 | 21.7035761826179 | -1.70357618261788 |
| 5 | 14 | 18.7521953860957 | -4.75219538609566 |
| 6 | 14 | 16.3923433551886 | -2.39234335518862 |
| 7 | 14 | 14.3320632923518 | -0.332063292351784 |
| 8 | 15 | 15.3401749495957 | -0.340174949595674 |
| 9 | 11 | 14.5165646604365 | -3.51656466043655 |
| 10 | 17 | 13.2431570335042 | 3.75684296649580 |
| 11 | 16 | 13.9339024653372 | 2.06609753466275 |
| 12 | 20 | 14.3928471860701 | 5.60715281392989 |
| 13 | 24 | 22.252068439352 | 1.74793156064801 |
| 14 | 23 | 24.2755106280701 | -1.27551062807010 |
| 15 | 20 | 23.6100745373425 | -3.61007453734249 |
| 16 | 21 | 21.8967761033132 | -0.896776103313184 |
| 17 | 19 | 20.6339690803581 | -1.63396908035812 |
| 18 | 23 | 20.9423577823621 | 2.05764221763789 |
| 19 | 23 | 22.8490582746225 | 0.150941725377507 |
| 20 | 23 | 24.900592378422 | -1.90059237842198 |
| 21 | 23 | 24.1391338895347 | -1.13913388953469 |
| 22 | 27 | 25.1559942987757 | 1.84400570122431 |
| 23 | 26 | 23.7306970000899 | 2.26930299991007 |
| 24 | 17 | 24.4983139478705 | -7.49831394787049 |
| 25 | 24 | 22.3397245044267 | 1.66027549557329 |
| 26 | 26 | 25.3310367517534 | 0.668963248246625 |
| 27 | 24 | 23.6704962326411 | 0.329503767358865 |
| 28 | 27 | 23.2152383094388 | 3.78476169056121 |
| 29 | 27 | 24.0955318521494 | 2.90446814785059 |
| 30 | 26 | 25.3390946199915 | 0.660905380008493 |
| 31 | 24 | 23.7458984137165 | 0.254101586283472 |
| 32 | 23 | 24.8302576135788 | -1.83025761357884 |
| 33 | 23 | 22.3052257049062 | 0.694774295093838 |
| 34 | 24 | 21.6776809860648 | 2.32231901393525 |
| 35 | 17 | 19.0706891947650 | -2.07068919476503 |
| 36 | 21 | 15.6922065166389 | 5.30779348336107 |
| 37 | 19 | 21.8533119998816 | -2.85331199988161 |
| 38 | 22 | 18.9164494266869 | 3.08355057331306 |
| 39 | 22 | 19.8651355597365 | 2.13486444026355 |
| 40 | 18 | 19.0621097850671 | -1.06210978506707 |
| 41 | 16 | 15.8161032660465 | 0.183896733953522 |
| 42 | 14 | 14.8897649480211 | -0.88976494802113 |
| 43 | 12 | 12.1820832992101 | -0.182083299210095 |
| 44 | 14 | 12.3244309618592 | 1.67556903814084 |
| 45 | 16 | 11.3747656718246 | 4.62523432817538 |
| 46 | 8 | 12.9275719124426 | -4.92757191244255 |
| 47 | 3 | 5.26471133980779 | -2.26471133980779 |
| 48 | 0 | 3.41663234942047 | -3.41663234942047 |
| 49 | 5 | 3.71626855828819 | 1.28373144171181 |
| 50 | 1 | 5.71430583659659 | -4.71430583659659 |
| 51 | 1 | 2.10565978654377 | -1.10565978654377 |
| 52 | 3 | 3.12229961956307 | -0.122299619563073 |
| 53 | 6 | 2.70220041535034 | 3.29779958464966 |
| 54 | 7 | 6.43643929443664 | 0.563560705563365 |
| 55 | 8 | 7.8908967200991 | 0.109103279900901 |
| 56 | 14 | 11.6045440965443 | 2.39545590345566 |
| 57 | 14 | 14.6643100732980 | -0.664310073297984 |
| 58 | 13 | 15.9955957692128 | -2.9955957692128 |
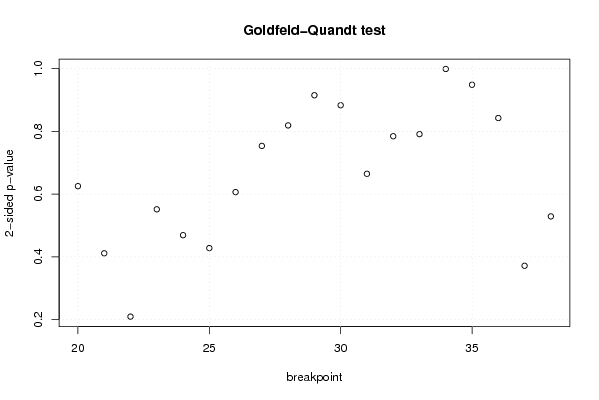
| Goldfeld-Quandt test for Heteroskedasticity | |||
| p-values | Alternative Hypothesis | ||
| breakpoint index | greater | 2-sided | less |
| 20 | 0.312621957274185 | 0.62524391454837 | 0.687378042725815 |
| 21 | 0.205630555503526 | 0.411261111007052 | 0.794369444496474 |
| 22 | 0.104679547652515 | 0.209359095305030 | 0.895320452347485 |
| 23 | 0.275712351356802 | 0.551424702713603 | 0.724287648643198 |
| 24 | 0.765483570208344 | 0.469032859583312 | 0.234516429791656 |
| 25 | 0.786068589218885 | 0.42786282156223 | 0.213931410781115 |
| 26 | 0.696843194816621 | 0.606313610366758 | 0.303156805183379 |
| 27 | 0.623260599781946 | 0.753478800436108 | 0.376739400218054 |
| 28 | 0.590577284915783 | 0.818845430168434 | 0.409422715084217 |
| 29 | 0.542539137114812 | 0.914921725770375 | 0.457460862885188 |
| 30 | 0.441512895664596 | 0.883025791329192 | 0.558487104335404 |
| 31 | 0.33231324725719 | 0.66462649451438 | 0.66768675274281 |
| 32 | 0.392164404561732 | 0.784328809123463 | 0.607835595438268 |
| 33 | 0.604516689657925 | 0.79096662068415 | 0.395483310342075 |
| 34 | 0.50063825906849 | 0.998723481863021 | 0.499361740931510 |
| 35 | 0.525856617710022 | 0.948286764579956 | 0.474143382289978 |
| 36 | 0.421154391020655 | 0.84230878204131 | 0.578845608979345 |
| 37 | 0.81422602099987 | 0.37154795800026 | 0.18577397900013 |
| 38 | 0.73557260757972 | 0.528854784840561 | 0.264427392420281 |
| Meta Analysis of Goldfeld-Quandt test for Heteroskedasticity | |||
| Description | # significant tests | % significant tests | OK/NOK |
| 1% type I error level | 0 | 0 | OK |
| 5% type I error level | 0 | 0 | OK |
| 10% type I error level | 0 | 0 | OK |