| Multiple Linear Regression - Estimated Regression Equation |
| Y[t] = -5.32826335158439 + 2.34295047914645X[t] + 1.09404972823779Y1[t] -0.103435969619101Y2[t] + 0.290853961965319Y3[t] -0.283179283774372Y4[t] + 13.4961062988867M1[t] + 9.49932734168887M2[t] + 5.38342892233694M3[t] -0.316430489186691M4[t] + 2.27378015665203M5[t] + 0.634821026614046M6[t] + 7.50051641234214M7[t] + 26.0146635332518M8[t] + 5.80947840878837M9[t] -2.57233748576951M10[t] -7.79427250169785M11[t] + 0.000594829630836294t + e[t] |
| Multiple Linear Regression - Ordinary Least Squares | |||||
| Variable | Parameter | S.D. | T-STAT H0: parameter = 0 | 2-tail p-value | 1-tail p-value |
| (Intercept) | -5.32826335158439 | 24.839465 | -0.2145 | 0.831269 | 0.415634 |
| X | 2.34295047914645 | 3.093838 | 0.7573 | 0.453424 | 0.226712 |
| Y1 | 1.09404972823779 | 0.152273 | 7.1848 | 0 | 0 |
| Y2 | -0.103435969619101 | 0.213236 | -0.4851 | 0.630335 | 0.315167 |
| Y3 | 0.290853961965319 | 0.21023 | 1.3835 | 0.174379 | 0.087189 |
| Y4 | -0.283179283774372 | 0.143258 | -1.9767 | 0.055176 | 0.027588 |
| M1 | 13.4961062988867 | 3.476256 | 3.8824 | 0.000389 | 0.000194 |
| M2 | 9.49932734168887 | 4.024368 | 2.3605 | 0.023348 | 0.011674 |
| M3 | 5.38342892233694 | 4.349921 | 1.2376 | 0.223267 | 0.111633 |
| M4 | -0.316430489186691 | 3.768009 | -0.084 | 0.933503 | 0.466752 |
| M5 | 2.27378015665203 | 3.42345 | 0.6642 | 0.510484 | 0.255242 |
| M6 | 0.634821026614046 | 3.428797 | 0.1851 | 0.854076 | 0.427038 |
| M7 | 7.50051641234214 | 3.475034 | 2.1584 | 0.037112 | 0.018556 |
| M8 | 26.0146635332518 | 3.594372 | 7.2376 | 0 | 0 |
| M9 | 5.80947840878837 | 5.640431 | 1.03 | 0.309369 | 0.154685 |
| M10 | -2.57233748576951 | 5.415976 | -0.475 | 0.637469 | 0.318735 |
| M11 | -7.79427250169785 | 4.401038 | -1.771 | 0.084375 | 0.042187 |
| t | 0.000594829630836294 | 0.083163 | 0.0072 | 0.99433 | 0.497165 |
| Multiple Linear Regression - Regression Statistics | |
| Multiple R | 0.988776823652894 |
| R-squared | 0.977679606993106 |
| Adjusted R-squared | 0.967950204913177 |
| F-TEST (value) | 100.487121301117 |
| F-TEST (DF numerator) | 17 |
| F-TEST (DF denominator) | 39 |
| p-value | 0 |
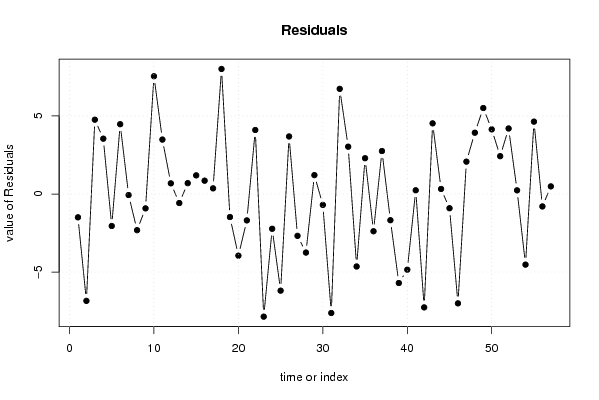
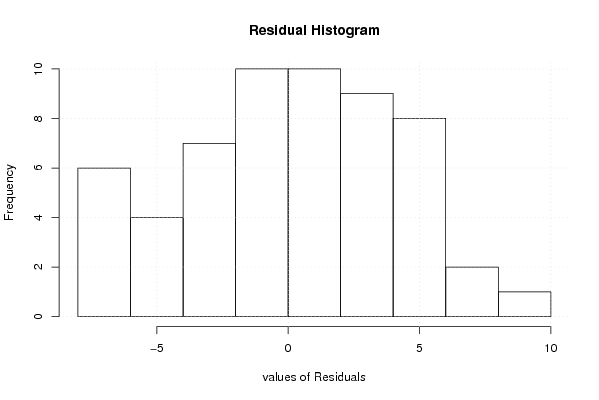
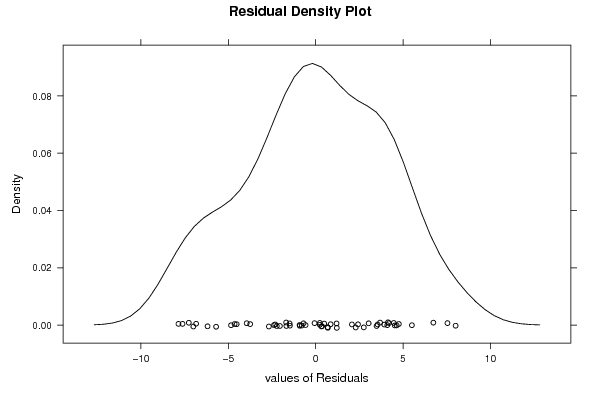
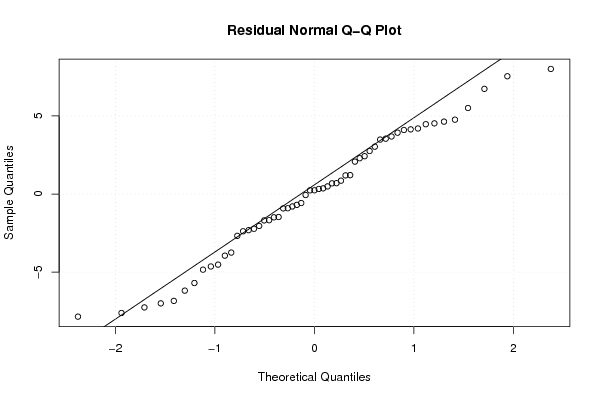
| Multiple Linear Regression - Residual Statistics | |
| Residual Standard Deviation | 4.80066799932126 |
| Sum Squared Residuals | 898.81011634858 |
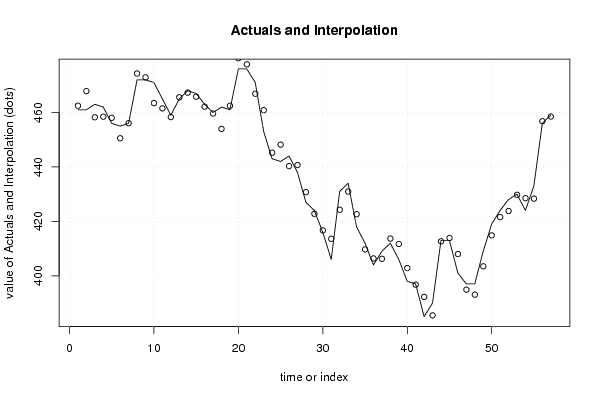
| Multiple Linear Regression - Actuals, Interpolation, and Residuals | |||
| Time or Index | Actuals | Interpolation Forecast | Residuals Prediction Error |
| 1 | 461 | 462.492138554731 | -1.49213855473124 |
| 2 | 461 | 467.843306352255 | -6.84330635225514 |
| 3 | 463 | 458.239616373319 | 4.76038362668138 |
| 4 | 462 | 458.455830006114 | 3.54416999388604 |
| 5 | 456 | 458.046638111461 | -2.04663811146130 |
| 6 | 455 | 450.529119335177 | 4.47088066482284 |
| 7 | 456 | 456.064763110499 | -0.0647631104988569 |
| 8 | 472 | 474.315046270879 | -2.31504627087866 |
| 9 | 472 | 472.920037398912 | -0.920037398912489 |
| 10 | 471 | 463.457874065820 | 7.54212593418048 |
| 11 | 465 | 461.512968258955 | 3.48703174104504 |
| 12 | 459 | 458.316104650086 | 0.683895349913938 |
| 13 | 465 | 465.578269264926 | -0.578269264926175 |
| 14 | 468 | 467.305054836483 | 0.694945163517022 |
| 15 | 467 | 465.805236544615 | 1.19476345538506 |
| 16 | 463 | 462.145813800065 | 0.854186199934795 |
| 17 | 460 | 459.637342515452 | 0.362657484547555 |
| 18 | 462 | 453.99018109552 | 8.0098189044801 |
| 19 | 461 | 462.474642112125 | -1.47464211212481 |
| 20 | 476 | 479.948617644391 | -3.94861764439084 |
| 21 | 476 | 477.689455017998 | -1.6894550179979 |
| 22 | 471 | 466.89948187927 | 4.10051812072972 |
| 23 | 453 | 460.853881765038 | -7.853881765038 |
| 24 | 443 | 445.225344579566 | -2.22534457956645 |
| 25 | 442 | 448.189126069023 | -6.18912606902336 |
| 26 | 444 | 440.313777012906 | 3.68622298709427 |
| 27 | 438 | 440.678696337565 | -2.67869633756482 |
| 28 | 427 | 430.749200322785 | -3.74920032278551 |
| 29 | 424 | 422.790961813059 | 1.20903818694096 |
| 30 | 416 | 416.696761654408 | -0.69676165440799 |
| 31 | 406 | 413.62064407375 | -7.62064407374966 |
| 32 | 431 | 424.264786734487 | 6.73521326551277 |
| 33 | 434 | 430.968505497391 | 3.03149450260911 |
| 34 | 418 | 422.640429027241 | -4.64042902724146 |
| 35 | 412 | 409.707127167159 | 2.29287283284123 |
| 36 | 404 | 406.385751434503 | -2.38575143450301 |
| 37 | 409 | 406.247469312065 | 2.75253068793536 |
| 38 | 412 | 413.677716830384 | -1.67771683038393 |
| 39 | 406 | 411.699626584204 | -5.69962658420436 |
| 40 | 398 | 402.845459804049 | -4.84545980404912 |
| 41 | 397 | 396.761148738355 | 0.238851261644903 |
| 42 | 385 | 392.261560843548 | -7.26156084354795 |
| 43 | 390 | 385.474934296596 | 4.52506570340376 |
| 44 | 413 | 412.675736831985 | 0.324263168015478 |
| 45 | 413 | 413.910042178716 | -0.910042178716053 |
| 46 | 401 | 408.002215027669 | -7.00221502766874 |
| 47 | 397 | 394.926022808848 | 2.07397719115172 |
| 48 | 397 | 393.072799335844 | 3.92720066415553 |
| 49 | 409 | 403.492996799255 | 5.50700320074541 |
| 50 | 419 | 414.860144967972 | 4.13985503202778 |
| 51 | 424 | 421.576824160297 | 2.42317583970274 |
| 52 | 428 | 423.803696066986 | 4.1963039330138 |
| 53 | 430 | 429.763908821672 | 0.236091178327881 |
| 54 | 424 | 428.522377071347 | -4.522377071347 |
| 55 | 433 | 428.365016407030 | 4.63498359296957 |
| 56 | 456 | 456.795812518259 | -0.79581251825874 |
| 57 | 459 | 458.511959906983 | 0.488040093017333 |
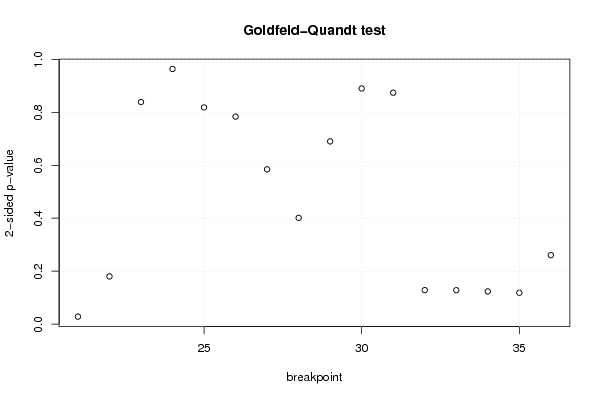
| Goldfeld-Quandt test for Heteroskedasticity | |||
| p-values | Alternative Hypothesis | ||
| breakpoint index | greater | 2-sided | less |
| 21 | 0.0142782756275300 | 0.0285565512550599 | 0.98572172437247 |
| 22 | 0.0901791780515696 | 0.180358356103139 | 0.90982082194843 |
| 23 | 0.580698873925569 | 0.838602252148863 | 0.419301126074431 |
| 24 | 0.518239515504973 | 0.963520968990054 | 0.481760484495027 |
| 25 | 0.409050342554841 | 0.818100685109682 | 0.590949657445159 |
| 26 | 0.391728703520848 | 0.783457407041696 | 0.608271296479152 |
| 27 | 0.292258057939326 | 0.584516115878653 | 0.707741942060674 |
| 28 | 0.200753515846438 | 0.401507031692876 | 0.799246484153562 |
| 29 | 0.345057640479393 | 0.690115280958787 | 0.654942359520607 |
| 30 | 0.444892270685478 | 0.889784541370956 | 0.555107729314522 |
| 31 | 0.563021853111973 | 0.873956293776055 | 0.436978146888027 |
| 32 | 0.93568559738746 | 0.128628805225079 | 0.0643144026125396 |
| 33 | 0.935807539101316 | 0.128384921797368 | 0.0641924608986838 |
| 34 | 0.938080041638737 | 0.123839916722526 | 0.061919958361263 |
| 35 | 0.940711750208794 | 0.118576499582411 | 0.0592882497912057 |
| 36 | 0.869662859285067 | 0.260674281429865 | 0.130337140714932 |
| Meta Analysis of Goldfeld-Quandt test for Heteroskedasticity | |||
| Description | # significant tests | % significant tests | OK/NOK |
| 1% type I error level | 0 | 0 | OK |
| 5% type I error level | 1 | 0.0625 | NOK |
| 10% type I error level | 1 | 0.0625 | OK |