Free Statistics

of Irreproducible Research!

Author's title

Author*The author of this computation has been verified*
R Software Modulerwasp_multipleregression.wasp
Title produced by softwareMultiple Regression
Date of computationThu, 19 Nov 2009 12:58:46 -0700
Cite this page as followsStatistical Computations at FreeStatistics.org, Office for Research Development and Education, URL https://freestatistics.org/blog/index.php?v=date/2009/Nov/19/t1258660805ydsoorzq3q97gpa.htm/, Retrieved Thu, 25 Apr 2024 10:42:00 +0000
Statistical Computations at FreeStatistics.org, Office for Research Development and Education, URL https://freestatistics.org/blog/index.php?pk=57921, Retrieved Thu, 25 Apr 2024 10:42:00 +0000
QR Codes:

Original text written by user:
IsPrivate?No (this computation is public)
User-defined keywords
Estimated Impact145
Family? (F = Feedback message, R = changed R code, M = changed R Module, P = changed Parameters, D = changed Data)
-     [Multiple Regression] [Q1 The Seatbeltlaw] [2007-11-14 19:27:43] [8cd6641b921d30ebe00b648d1481bba0]
- RM D  [Multiple Regression] [Seatbelt] [2009-11-12 14:10:54] [b98453cac15ba1066b407e146608df68]
-   PD      [Multiple Regression] [] [2009-11-19 19:58:46] [24029b2c7217429de6ff94b5379eb52c] [Current]
-    D        [Multiple Regression] [] [2009-11-19 20:05:09] [5edbdb7a459c4059b6c3b063ba86821c]
Feedback Forum

Post a new message
Dataseries X:
101.9	122.2	19	73	77.8	74.8	80.2
102	123.7	22	72	73	77.8	74.8
100.7	122.6	23	75.8	72	73	77.8
99	115.7	20	72.6	75.8	72	73
96.5	116.1	14	71.9	72.6	75.8	72
101.8	120.5	14	74.8	71.9	72.6	75.8
100.5	122.6	14	72.9	74.8	71.9	72.6
103.3	119.9	15	72.9	72.9	74.8	71.9
102.3	120.7	11	79.9	72.9	72.9	74.8
100.4	120.2	17	74	79.9	72.9	72.9
103	122.1	16	76	74	79.9	72.9
99	119.3	20	69.6	76	74	79.9
104.8	121.7	24	77.3	69.6	76	74
104.5	113.5	23	75.2	77.3	69.6	76
104.8	123.7	20	75.8	75.2	77.3	69.6
103.8	123.4	21	77.6	75.8	75.2	77.3
106.3	126.4	19	76.7	77.6	75.8	75.2
105.2	124.1	23	77	76.7	77.6	75.8
108.2	125.6	23	77.9	77	76.7	77.6
106.2	124.8	23	76.7	77.9	77	76.7
103.9	123	23	71.9	76.7	77.9	77
104.9	126.9	27	73.4	71.9	76.7	77.9
106.2	127.3	26	72.5	73.4	71.9	76.7
107.9	129	17	73.7	72.5	73.4	71.9
106.9	126.2	24	69.5	73.7	72.5	73.4
110.3	125.4	26	74.7	69.5	73.7	72.5
109.8	126.3	24	72.5	74.7	69.5	73.7
108.3	126.3	27	72.1	72.5	74.7	69.5
110.9	128.4	27	70.7	72.1	72.5	74.7
109.8	127.2	26	71.4	70.7	72.1	72.5
109.3	128.5	24	69.5	71.4	70.7	72.1
109	129	23	73.5	69.5	71.4	70.7
107.9	128.9	23	72.4	73.5	69.5	71.4
108.4	128.3	24	74.5	72.4	73.5	69.5
107.2	124.6	17	72.2	74.5	72.4	73.5
109.5	126.2	21	73	72.2	74.5	72.4
109.9	129.1	19	73.3	73	72.2	74.5
108	127.3	22	71.3	73.3	73	72.2
114.7	129.2	22	73.6	71.3	73.3	73
115.6	130.4	18	71.3	73.6	71.3	73.3
107.6	125.9	16	71.2	71.3	73.6	71.3
115.9	135.8	14	81.4	71.2	71.3	73.6
111.8	126.4	12	76.1	81.4	71.2	71.3
110	129.5	14	71.1	76.1	81.4	71.2
109.2	128.4	16	75.7	71.1	76.1	81.4
108	125.6	8	70	75.7	71.1	76.1
105.6	127.7	3	68.5	70	75.7	71.1
103	126.4	0	56.7	68.5	70	75.7
99.6	124.2	5	57.9	56.7	68.5	70
97.9	126.4	1	58.8	57.9	56.7	68.5
97.6	123.7	1	59.3	58.8	57.9	56.7
96.2	121.8	3	61.3	59.3	58.8	57.9
97.9	124	6	62.9	61.3	59.3	58.8
94.5	122.7	7	61.4	62.9	61.3	59.3
95.4	122.9	8	64.5	61.4	62.9	61.3
94.4	121	14	63.8	64.5	61.4	62.9
96.3	122.8	14	61.6	63.8	64.5	61.4
95.1	122.9	13	64.7	61.6	63.8	64.5


Summary of computational transaction
Raw Inputview raw input (R code)
Raw Outputview raw output of R engine
Computing time3 seconds
R Server'Gwilym Jenkins' @ 72.249.127.135
R Framework error message
The field 'Names of X columns' contains a hard return which cannot be interpreted.
Please, resubmit your request without hard returns in the 'Names of X columns'.

\begin{tabular}{lllllllll}
\hline
Summary of computational transaction \tabularnewline
Raw Input & view raw input (R code)  \tabularnewline
Raw Output & view raw output of R engine  \tabularnewline
Computing time & 3 seconds \tabularnewline
R Server & 'Gwilym Jenkins' @ 72.249.127.135 \tabularnewline
R Framework error message & 
The field 'Names of X columns' contains a hard return which cannot be interpreted.
Please, resubmit your request without hard returns in the 'Names of X columns'.
\tabularnewline \hline \end{tabular} %Source: https://freestatistics.org/blog/index.php?pk=57921&T=0

[TABLE]
[ROW][C]Summary of computational transaction[/C][/ROW]
[ROW][C]Raw Input[/C][C]view raw input (R code) [/C][/ROW]
[ROW][C]Raw Output[/C][C]view raw output of R engine [/C][/ROW]
[ROW][C]Computing time[/C][C]3 seconds[/C][/ROW]
[ROW][C]R Server[/C][C]'Gwilym Jenkins' @ 72.249.127.135[/C][/ROW]
[ROW][C]R Framework error message[/C][C]
The field 'Names of X columns' contains a hard return which cannot be interpreted.
Please, resubmit your request without hard returns in the 'Names of X columns'.
[/C][/ROW] [/TABLE] Source: https://freestatistics.org/blog/index.php?pk=57921&T=0

Globally Unique Identifier (entire table): ba.freestatistics.org/blog/index.php?pk=57921&T=0

As an alternative you can also use a QR Code:  

The GUIDs for individual cells are displayed in the table below:

Summary of computational transaction
Raw Inputview raw input (R code)
Raw Outputview raw output of R engine
Computing time3 seconds
R Server'Gwilym Jenkins' @ 72.249.127.135
R Framework error message
The field 'Names of X columns' contains a hard return which cannot be interpreted.
Please, resubmit your request without hard returns in the 'Names of X columns'.


Multiple Linear Regression - Estimated Regression Equation
Y[t] = + 19.5447097642314 + 0.474153907672798totid[t] -0.087206661204238ndzcg[t] + 0.0461297131404523indc[t] + 0.163565208603853y1[t] + 0.115836079954216y2[t] -0.0837072924607436`y3 `[t] + 1.37117081963841M1[t] + 1.77995473905426M2[t] + 2.41301826429556M3[t] + 2.28548228718490M4[t] + 2.58505687122945M5[t] + 4.83378346325529M6[t] + 3.70223862569186M7[t] + 3.24366895236396M8[t] + 4.85075294798024M9[t] + 4.14558329093348M10[t] + 3.09304594699270M11[t] -0.158704064647780t + e[t]

\begin{tabular}{lllllllll}
\hline
Multiple Linear Regression - Estimated Regression Equation \tabularnewline
Y[t] =  +  19.5447097642314 +  0.474153907672798totid[t] -0.087206661204238ndzcg[t] +  0.0461297131404523indc[t] +  0.163565208603853y1[t] +  0.115836079954216y2[t] -0.0837072924607436`y3
`[t] +  1.37117081963841M1[t] +  1.77995473905426M2[t] +  2.41301826429556M3[t] +  2.28548228718490M4[t] +  2.58505687122945M5[t] +  4.83378346325529M6[t] +  3.70223862569186M7[t] +  3.24366895236396M8[t] +  4.85075294798024M9[t] +  4.14558329093348M10[t] +  3.09304594699270M11[t] -0.158704064647780t  + e[t] \tabularnewline
\hline
\end{tabular}
%Source: https://freestatistics.org/blog/index.php?pk=57921&T=1

[TABLE]
[ROW][C]Multiple Linear Regression - Estimated Regression Equation[/C][/ROW]
[ROW][C]Y[t] =  +  19.5447097642314 +  0.474153907672798totid[t] -0.087206661204238ndzcg[t] +  0.0461297131404523indc[t] +  0.163565208603853y1[t] +  0.115836079954216y2[t] -0.0837072924607436`y3
`[t] +  1.37117081963841M1[t] +  1.77995473905426M2[t] +  2.41301826429556M3[t] +  2.28548228718490M4[t] +  2.58505687122945M5[t] +  4.83378346325529M6[t] +  3.70223862569186M7[t] +  3.24366895236396M8[t] +  4.85075294798024M9[t] +  4.14558329093348M10[t] +  3.09304594699270M11[t] -0.158704064647780t  + e[t][/C][/ROW]
[/TABLE]
Source: https://freestatistics.org/blog/index.php?pk=57921&T=1

Globally Unique Identifier (entire table): ba.freestatistics.org/blog/index.php?pk=57921&T=1

As an alternative you can also use a QR Code:  

The GUIDs for individual cells are displayed in the table below:

Multiple Linear Regression - Estimated Regression Equation
Y[t] = + 19.5447097642314 + 0.474153907672798totid[t] -0.087206661204238ndzcg[t] + 0.0461297131404523indc[t] + 0.163565208603853y1[t] + 0.115836079954216y2[t] -0.0837072924607436`y3 `[t] + 1.37117081963841M1[t] + 1.77995473905426M2[t] + 2.41301826429556M3[t] + 2.28548228718490M4[t] + 2.58505687122945M5[t] + 4.83378346325529M6[t] + 3.70223862569186M7[t] + 3.24366895236396M8[t] + 4.85075294798024M9[t] + 4.14558329093348M10[t] + 3.09304594699270M11[t] -0.158704064647780t + e[t]


Multiple Linear Regression - Ordinary Least Squares
VariableParameterS.D.T-STATH0: parameter = 02-tail p-value1-tail p-value
(Intercept)19.544709764231418.4465781.05950.2958760.147938
totid0.4741539076727980.1844492.57070.0140820.007041
ndzcg-0.0872066612042380.2114-0.41250.6822180.341109
indc0.04612971314045230.0795210.58010.5651880.282594
y10.1635652086038530.1582251.03380.3076190.15381
y20.1158360799542160.1487030.7790.4406960.220348
`y3 `-0.08370729246074360.144047-0.58110.5645090.282254
M11.371170819638412.0586990.6660.5093080.254654
M21.779954739054262.137760.83260.4101260.205063
M32.413018264295562.1754751.10920.2741410.13707
M42.285482287184902.1451021.06540.2932280.146614
M52.585056871229452.0814561.24190.2216730.110837
M64.833783463255292.0725422.33230.024940.01247
M73.702238625691862.0940881.76790.0848920.042446
M83.243668952363962.0914771.55090.1290040.064502
M94.850752947980242.02262.39830.0213550.010677
M104.145583290933482.0605492.01190.0511770.025589
M113.093045946992702.133371.44980.1550980.077549
t-0.1587040646477800.052286-3.03530.0042650.002133

\begin{tabular}{lllllllll}
\hline
Multiple Linear Regression - Ordinary Least Squares \tabularnewline
Variable & Parameter & S.D. & T-STATH0: parameter = 0 & 2-tail p-value & 1-tail p-value \tabularnewline
(Intercept) & 19.5447097642314 & 18.446578 & 1.0595 & 0.295876 & 0.147938 \tabularnewline
totid & 0.474153907672798 & 0.184449 & 2.5707 & 0.014082 & 0.007041 \tabularnewline
ndzcg & -0.087206661204238 & 0.2114 & -0.4125 & 0.682218 & 0.341109 \tabularnewline
indc & 0.0461297131404523 & 0.079521 & 0.5801 & 0.565188 & 0.282594 \tabularnewline
y1 & 0.163565208603853 & 0.158225 & 1.0338 & 0.307619 & 0.15381 \tabularnewline
y2 & 0.115836079954216 & 0.148703 & 0.779 & 0.440696 & 0.220348 \tabularnewline
`y3
` & -0.0837072924607436 & 0.144047 & -0.5811 & 0.564509 & 0.282254 \tabularnewline
M1 & 1.37117081963841 & 2.058699 & 0.666 & 0.509308 & 0.254654 \tabularnewline
M2 & 1.77995473905426 & 2.13776 & 0.8326 & 0.410126 & 0.205063 \tabularnewline
M3 & 2.41301826429556 & 2.175475 & 1.1092 & 0.274141 & 0.13707 \tabularnewline
M4 & 2.28548228718490 & 2.145102 & 1.0654 & 0.293228 & 0.146614 \tabularnewline
M5 & 2.58505687122945 & 2.081456 & 1.2419 & 0.221673 & 0.110837 \tabularnewline
M6 & 4.83378346325529 & 2.072542 & 2.3323 & 0.02494 & 0.01247 \tabularnewline
M7 & 3.70223862569186 & 2.094088 & 1.7679 & 0.084892 & 0.042446 \tabularnewline
M8 & 3.24366895236396 & 2.091477 & 1.5509 & 0.129004 & 0.064502 \tabularnewline
M9 & 4.85075294798024 & 2.0226 & 2.3983 & 0.021355 & 0.010677 \tabularnewline
M10 & 4.14558329093348 & 2.060549 & 2.0119 & 0.051177 & 0.025589 \tabularnewline
M11 & 3.09304594699270 & 2.13337 & 1.4498 & 0.155098 & 0.077549 \tabularnewline
t & -0.158704064647780 & 0.052286 & -3.0353 & 0.004265 & 0.002133 \tabularnewline
\hline
\end{tabular}
%Source: https://freestatistics.org/blog/index.php?pk=57921&T=2

[TABLE]
[ROW][C]Multiple Linear Regression - Ordinary Least Squares[/C][/ROW]
[ROW][C]Variable[/C][C]Parameter[/C][C]S.D.[/C][C]T-STATH0: parameter = 0[/C][C]2-tail p-value[/C][C]1-tail p-value[/C][/ROW]
[ROW][C](Intercept)[/C][C]19.5447097642314[/C][C]18.446578[/C][C]1.0595[/C][C]0.295876[/C][C]0.147938[/C][/ROW]
[ROW][C]totid[/C][C]0.474153907672798[/C][C]0.184449[/C][C]2.5707[/C][C]0.014082[/C][C]0.007041[/C][/ROW]
[ROW][C]ndzcg[/C][C]-0.087206661204238[/C][C]0.2114[/C][C]-0.4125[/C][C]0.682218[/C][C]0.341109[/C][/ROW]
[ROW][C]indc[/C][C]0.0461297131404523[/C][C]0.079521[/C][C]0.5801[/C][C]0.565188[/C][C]0.282594[/C][/ROW]
[ROW][C]y1[/C][C]0.163565208603853[/C][C]0.158225[/C][C]1.0338[/C][C]0.307619[/C][C]0.15381[/C][/ROW]
[ROW][C]y2[/C][C]0.115836079954216[/C][C]0.148703[/C][C]0.779[/C][C]0.440696[/C][C]0.220348[/C][/ROW]
[ROW][C]`y3
`[/C][C]-0.0837072924607436[/C][C]0.144047[/C][C]-0.5811[/C][C]0.564509[/C][C]0.282254[/C][/ROW]
[ROW][C]M1[/C][C]1.37117081963841[/C][C]2.058699[/C][C]0.666[/C][C]0.509308[/C][C]0.254654[/C][/ROW]
[ROW][C]M2[/C][C]1.77995473905426[/C][C]2.13776[/C][C]0.8326[/C][C]0.410126[/C][C]0.205063[/C][/ROW]
[ROW][C]M3[/C][C]2.41301826429556[/C][C]2.175475[/C][C]1.1092[/C][C]0.274141[/C][C]0.13707[/C][/ROW]
[ROW][C]M4[/C][C]2.28548228718490[/C][C]2.145102[/C][C]1.0654[/C][C]0.293228[/C][C]0.146614[/C][/ROW]
[ROW][C]M5[/C][C]2.58505687122945[/C][C]2.081456[/C][C]1.2419[/C][C]0.221673[/C][C]0.110837[/C][/ROW]
[ROW][C]M6[/C][C]4.83378346325529[/C][C]2.072542[/C][C]2.3323[/C][C]0.02494[/C][C]0.01247[/C][/ROW]
[ROW][C]M7[/C][C]3.70223862569186[/C][C]2.094088[/C][C]1.7679[/C][C]0.084892[/C][C]0.042446[/C][/ROW]
[ROW][C]M8[/C][C]3.24366895236396[/C][C]2.091477[/C][C]1.5509[/C][C]0.129004[/C][C]0.064502[/C][/ROW]
[ROW][C]M9[/C][C]4.85075294798024[/C][C]2.0226[/C][C]2.3983[/C][C]0.021355[/C][C]0.010677[/C][/ROW]
[ROW][C]M10[/C][C]4.14558329093348[/C][C]2.060549[/C][C]2.0119[/C][C]0.051177[/C][C]0.025589[/C][/ROW]
[ROW][C]M11[/C][C]3.09304594699270[/C][C]2.13337[/C][C]1.4498[/C][C]0.155098[/C][C]0.077549[/C][/ROW]
[ROW][C]t[/C][C]-0.158704064647780[/C][C]0.052286[/C][C]-3.0353[/C][C]0.004265[/C][C]0.002133[/C][/ROW]
[/TABLE]
Source: https://freestatistics.org/blog/index.php?pk=57921&T=2

Globally Unique Identifier (entire table): ba.freestatistics.org/blog/index.php?pk=57921&T=2

As an alternative you can also use a QR Code:  

The GUIDs for individual cells are displayed in the table below:

Multiple Linear Regression - Ordinary Least Squares
VariableParameterS.D.T-STATH0: parameter = 02-tail p-value1-tail p-value
(Intercept)19.544709764231418.4465781.05950.2958760.147938
totid0.4741539076727980.1844492.57070.0140820.007041
ndzcg-0.0872066612042380.2114-0.41250.6822180.341109
indc0.04612971314045230.0795210.58010.5651880.282594
y10.1635652086038530.1582251.03380.3076190.15381
y20.1158360799542160.1487030.7790.4406960.220348
`y3 `-0.08370729246074360.144047-0.58110.5645090.282254
M11.371170819638412.0586990.6660.5093080.254654
M21.779954739054262.137760.83260.4101260.205063
M32.413018264295562.1754751.10920.2741410.13707
M42.285482287184902.1451021.06540.2932280.146614
M52.585056871229452.0814561.24190.2216730.110837
M64.833783463255292.0725422.33230.024940.01247
M73.702238625691862.0940881.76790.0848920.042446
M83.243668952363962.0914771.55090.1290040.064502
M94.850752947980242.02262.39830.0213550.010677
M104.145583290933482.0605492.01190.0511770.025589
M113.093045946992702.133371.44980.1550980.077549
t-0.1587040646477800.052286-3.03530.0042650.002133


Multiple Linear Regression - Regression Statistics
Multiple R0.900418032880322
R-squared0.810752633936068
Adjusted R-squared0.723407695752715
F-TEST (value)9.28219368859303
F-TEST (DF numerator)18
F-TEST (DF denominator)39
p-value4.30708124721235e-09
Multiple Linear Regression - Residual Statistics
Residual Standard Deviation2.9653736316565
Sum Squared Residuals342.944190237623

\begin{tabular}{lllllllll}
\hline
Multiple Linear Regression - Regression Statistics \tabularnewline
Multiple R & 0.900418032880322 \tabularnewline
R-squared & 0.810752633936068 \tabularnewline
Adjusted R-squared & 0.723407695752715 \tabularnewline
F-TEST (value) & 9.28219368859303 \tabularnewline
F-TEST (DF numerator) & 18 \tabularnewline
F-TEST (DF denominator) & 39 \tabularnewline
p-value & 4.30708124721235e-09 \tabularnewline
Multiple Linear Regression - Residual Statistics \tabularnewline
Residual Standard Deviation & 2.9653736316565 \tabularnewline
Sum Squared Residuals & 342.944190237623 \tabularnewline
\hline
\end{tabular}
%Source: https://freestatistics.org/blog/index.php?pk=57921&T=3

[TABLE]
[ROW][C]Multiple Linear Regression - Regression Statistics[/C][/ROW]
[ROW][C]Multiple R[/C][C]0.900418032880322[/C][/ROW]
[ROW][C]R-squared[/C][C]0.810752633936068[/C][/ROW]
[ROW][C]Adjusted R-squared[/C][C]0.723407695752715[/C][/ROW]
[ROW][C]F-TEST (value)[/C][C]9.28219368859303[/C][/ROW]
[ROW][C]F-TEST (DF numerator)[/C][C]18[/C][/ROW]
[ROW][C]F-TEST (DF denominator)[/C][C]39[/C][/ROW]
[ROW][C]p-value[/C][C]4.30708124721235e-09[/C][/ROW]
[ROW][C]Multiple Linear Regression - Residual Statistics[/C][/ROW]
[ROW][C]Residual Standard Deviation[/C][C]2.9653736316565[/C][/ROW]
[ROW][C]Sum Squared Residuals[/C][C]342.944190237623[/C][/ROW]
[/TABLE]
Source: https://freestatistics.org/blog/index.php?pk=57921&T=3

Globally Unique Identifier (entire table): ba.freestatistics.org/blog/index.php?pk=57921&T=3

As an alternative you can also use a QR Code:  

The GUIDs for individual cells are displayed in the table below:

Multiple Linear Regression - Regression Statistics
Multiple R0.900418032880322
R-squared0.810752633936068
Adjusted R-squared0.723407695752715
F-TEST (value)9.28219368859303
F-TEST (DF numerator)18
F-TEST (DF denominator)39
p-value4.30708124721235e-09
Multiple Linear Regression - Residual Statistics
Residual Standard Deviation2.9653736316565
Sum Squared Residuals342.944190237623


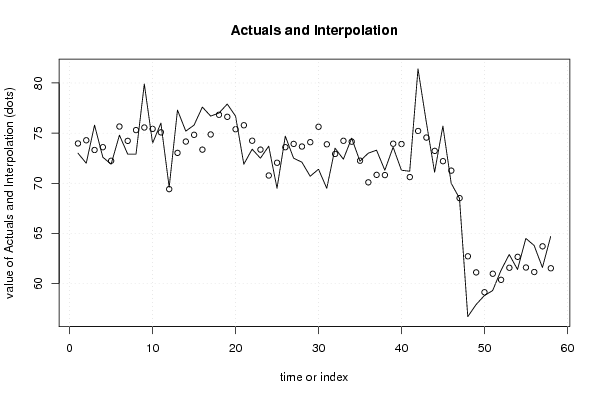
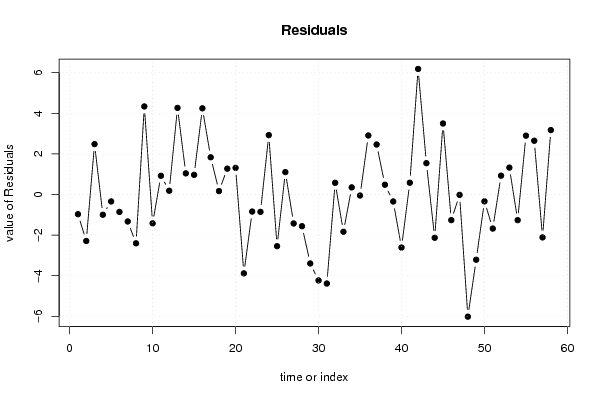
Multiple Linear Regression - Actuals, Interpolation, and Residuals
Time or IndexActualsInterpolationForecastResidualsPrediction Error
17373.9698574161942-0.969857416194245
27274.2893464271969-2.28934642719692
375.873.31866257851462.48133742148541
472.673.5972044331523-0.99720443315227
571.972.241504968797-0.341504968797058
674.875.6575750843153-0.857575084315297
772.974.2289092984581-1.32890929845814
872.975.3046000406006-2.40460004060062
979.975.5617021823224.33829781767805
107475.4213179613963-1.42131796139633
117675.07687217224530.923127827754687
1269.669.41495053210.185049467900048
1377.373.03146066762664.26853933237341
1475.274.15894586844831.04105413155168
1575.874.83183196696720.968168033032772
1677.673.35406693434844.24593306565155
1776.774.86614715066061.83385284933938
187776.83076643362780.169233566372159
1977.976.62631322682171.27368677317832
2076.775.38779307740821.31220692259180
2171.975.7854530447928-3.88545304479284
2273.474.2406932441782-0.840693244178151
2372.573.3546229180205-0.854622918020528
2473.770.7738562431122.92614375688805
2569.572.0457205734595-2.54572057345952
2674.773.5973144525831.10268554741705
2772.573.9274303359548-1.42743033595479
2872.173.6624233572771-1.56242335727708
2970.774.0974166679575-3.39741666795754
3071.475.6332184965867-4.2332184965867
3169.573.8860726057638-4.38607260576378
3273.572.92432122080940.575678779190643
3372.474.2354296972381-1.83542969723809
3474.574.1495530852710.350446914729022
3572.272.250321722223-0.0503217222230579
367370.09324770268692.90675229731315
3773.370.83886114579422.46113885420577
3871.370.81767490477720.482325095222791
3973.673.9438274633004-0.343827463300385
4071.373.9145747245828-2.61457472458277
4171.270.62002212076260.579977879237361
4281.475.21461043220736.18538956779272
4376.174.55712199000011.54287800999987
4471.173.2312931339398-2.13129313393983
4575.772.20296504249953.49703495750055
467071.2621157876944-1.26211578769439
4768.568.5181831875111-0.0181831875111015
4856.762.7179455221013-6.01794552210127
4957.961.1141001969254-3.21410019692541
5058.859.1367183469946-0.336718346994596
5159.360.978247655263-1.67824765526301
5261.360.37173055063940.92826944936056
5362.961.57490909182211.32509090817785
5461.462.6638295532629-1.26382955326288
5564.561.60158287895632.89841712104373
5663.861.1519925272422.64800747275801
5761.663.7144500331477-2.11445003314766
5864.761.52631992146013.17368007853985

\begin{tabular}{lllllllll}
\hline
Multiple Linear Regression - Actuals, Interpolation, and Residuals \tabularnewline
Time or Index & Actuals & InterpolationForecast & ResidualsPrediction Error \tabularnewline
1 & 73 & 73.9698574161942 & -0.969857416194245 \tabularnewline
2 & 72 & 74.2893464271969 & -2.28934642719692 \tabularnewline
3 & 75.8 & 73.3186625785146 & 2.48133742148541 \tabularnewline
4 & 72.6 & 73.5972044331523 & -0.99720443315227 \tabularnewline
5 & 71.9 & 72.241504968797 & -0.341504968797058 \tabularnewline
6 & 74.8 & 75.6575750843153 & -0.857575084315297 \tabularnewline
7 & 72.9 & 74.2289092984581 & -1.32890929845814 \tabularnewline
8 & 72.9 & 75.3046000406006 & -2.40460004060062 \tabularnewline
9 & 79.9 & 75.561702182322 & 4.33829781767805 \tabularnewline
10 & 74 & 75.4213179613963 & -1.42131796139633 \tabularnewline
11 & 76 & 75.0768721722453 & 0.923127827754687 \tabularnewline
12 & 69.6 & 69.4149505321 & 0.185049467900048 \tabularnewline
13 & 77.3 & 73.0314606676266 & 4.26853933237341 \tabularnewline
14 & 75.2 & 74.1589458684483 & 1.04105413155168 \tabularnewline
15 & 75.8 & 74.8318319669672 & 0.968168033032772 \tabularnewline
16 & 77.6 & 73.3540669343484 & 4.24593306565155 \tabularnewline
17 & 76.7 & 74.8661471506606 & 1.83385284933938 \tabularnewline
18 & 77 & 76.8307664336278 & 0.169233566372159 \tabularnewline
19 & 77.9 & 76.6263132268217 & 1.27368677317832 \tabularnewline
20 & 76.7 & 75.3877930774082 & 1.31220692259180 \tabularnewline
21 & 71.9 & 75.7854530447928 & -3.88545304479284 \tabularnewline
22 & 73.4 & 74.2406932441782 & -0.840693244178151 \tabularnewline
23 & 72.5 & 73.3546229180205 & -0.854622918020528 \tabularnewline
24 & 73.7 & 70.773856243112 & 2.92614375688805 \tabularnewline
25 & 69.5 & 72.0457205734595 & -2.54572057345952 \tabularnewline
26 & 74.7 & 73.597314452583 & 1.10268554741705 \tabularnewline
27 & 72.5 & 73.9274303359548 & -1.42743033595479 \tabularnewline
28 & 72.1 & 73.6624233572771 & -1.56242335727708 \tabularnewline
29 & 70.7 & 74.0974166679575 & -3.39741666795754 \tabularnewline
30 & 71.4 & 75.6332184965867 & -4.2332184965867 \tabularnewline
31 & 69.5 & 73.8860726057638 & -4.38607260576378 \tabularnewline
32 & 73.5 & 72.9243212208094 & 0.575678779190643 \tabularnewline
33 & 72.4 & 74.2354296972381 & -1.83542969723809 \tabularnewline
34 & 74.5 & 74.149553085271 & 0.350446914729022 \tabularnewline
35 & 72.2 & 72.250321722223 & -0.0503217222230579 \tabularnewline
36 & 73 & 70.0932477026869 & 2.90675229731315 \tabularnewline
37 & 73.3 & 70.8388611457942 & 2.46113885420577 \tabularnewline
38 & 71.3 & 70.8176749047772 & 0.482325095222791 \tabularnewline
39 & 73.6 & 73.9438274633004 & -0.343827463300385 \tabularnewline
40 & 71.3 & 73.9145747245828 & -2.61457472458277 \tabularnewline
41 & 71.2 & 70.6200221207626 & 0.579977879237361 \tabularnewline
42 & 81.4 & 75.2146104322073 & 6.18538956779272 \tabularnewline
43 & 76.1 & 74.5571219900001 & 1.54287800999987 \tabularnewline
44 & 71.1 & 73.2312931339398 & -2.13129313393983 \tabularnewline
45 & 75.7 & 72.2029650424995 & 3.49703495750055 \tabularnewline
46 & 70 & 71.2621157876944 & -1.26211578769439 \tabularnewline
47 & 68.5 & 68.5181831875111 & -0.0181831875111015 \tabularnewline
48 & 56.7 & 62.7179455221013 & -6.01794552210127 \tabularnewline
49 & 57.9 & 61.1141001969254 & -3.21410019692541 \tabularnewline
50 & 58.8 & 59.1367183469946 & -0.336718346994596 \tabularnewline
51 & 59.3 & 60.978247655263 & -1.67824765526301 \tabularnewline
52 & 61.3 & 60.3717305506394 & 0.92826944936056 \tabularnewline
53 & 62.9 & 61.5749090918221 & 1.32509090817785 \tabularnewline
54 & 61.4 & 62.6638295532629 & -1.26382955326288 \tabularnewline
55 & 64.5 & 61.6015828789563 & 2.89841712104373 \tabularnewline
56 & 63.8 & 61.151992527242 & 2.64800747275801 \tabularnewline
57 & 61.6 & 63.7144500331477 & -2.11445003314766 \tabularnewline
58 & 64.7 & 61.5263199214601 & 3.17368007853985 \tabularnewline
\hline
\end{tabular}
%Source: https://freestatistics.org/blog/index.php?pk=57921&T=4

[TABLE]
[ROW][C]Multiple Linear Regression - Actuals, Interpolation, and Residuals[/C][/ROW]
[ROW][C]Time or Index[/C][C]Actuals[/C][C]InterpolationForecast[/C][C]ResidualsPrediction Error[/C][/ROW]
[ROW][C]1[/C][C]73[/C][C]73.9698574161942[/C][C]-0.969857416194245[/C][/ROW]
[ROW][C]2[/C][C]72[/C][C]74.2893464271969[/C][C]-2.28934642719692[/C][/ROW]
[ROW][C]3[/C][C]75.8[/C][C]73.3186625785146[/C][C]2.48133742148541[/C][/ROW]
[ROW][C]4[/C][C]72.6[/C][C]73.5972044331523[/C][C]-0.99720443315227[/C][/ROW]
[ROW][C]5[/C][C]71.9[/C][C]72.241504968797[/C][C]-0.341504968797058[/C][/ROW]
[ROW][C]6[/C][C]74.8[/C][C]75.6575750843153[/C][C]-0.857575084315297[/C][/ROW]
[ROW][C]7[/C][C]72.9[/C][C]74.2289092984581[/C][C]-1.32890929845814[/C][/ROW]
[ROW][C]8[/C][C]72.9[/C][C]75.3046000406006[/C][C]-2.40460004060062[/C][/ROW]
[ROW][C]9[/C][C]79.9[/C][C]75.561702182322[/C][C]4.33829781767805[/C][/ROW]
[ROW][C]10[/C][C]74[/C][C]75.4213179613963[/C][C]-1.42131796139633[/C][/ROW]
[ROW][C]11[/C][C]76[/C][C]75.0768721722453[/C][C]0.923127827754687[/C][/ROW]
[ROW][C]12[/C][C]69.6[/C][C]69.4149505321[/C][C]0.185049467900048[/C][/ROW]
[ROW][C]13[/C][C]77.3[/C][C]73.0314606676266[/C][C]4.26853933237341[/C][/ROW]
[ROW][C]14[/C][C]75.2[/C][C]74.1589458684483[/C][C]1.04105413155168[/C][/ROW]
[ROW][C]15[/C][C]75.8[/C][C]74.8318319669672[/C][C]0.968168033032772[/C][/ROW]
[ROW][C]16[/C][C]77.6[/C][C]73.3540669343484[/C][C]4.24593306565155[/C][/ROW]
[ROW][C]17[/C][C]76.7[/C][C]74.8661471506606[/C][C]1.83385284933938[/C][/ROW]
[ROW][C]18[/C][C]77[/C][C]76.8307664336278[/C][C]0.169233566372159[/C][/ROW]
[ROW][C]19[/C][C]77.9[/C][C]76.6263132268217[/C][C]1.27368677317832[/C][/ROW]
[ROW][C]20[/C][C]76.7[/C][C]75.3877930774082[/C][C]1.31220692259180[/C][/ROW]
[ROW][C]21[/C][C]71.9[/C][C]75.7854530447928[/C][C]-3.88545304479284[/C][/ROW]
[ROW][C]22[/C][C]73.4[/C][C]74.2406932441782[/C][C]-0.840693244178151[/C][/ROW]
[ROW][C]23[/C][C]72.5[/C][C]73.3546229180205[/C][C]-0.854622918020528[/C][/ROW]
[ROW][C]24[/C][C]73.7[/C][C]70.773856243112[/C][C]2.92614375688805[/C][/ROW]
[ROW][C]25[/C][C]69.5[/C][C]72.0457205734595[/C][C]-2.54572057345952[/C][/ROW]
[ROW][C]26[/C][C]74.7[/C][C]73.597314452583[/C][C]1.10268554741705[/C][/ROW]
[ROW][C]27[/C][C]72.5[/C][C]73.9274303359548[/C][C]-1.42743033595479[/C][/ROW]
[ROW][C]28[/C][C]72.1[/C][C]73.6624233572771[/C][C]-1.56242335727708[/C][/ROW]
[ROW][C]29[/C][C]70.7[/C][C]74.0974166679575[/C][C]-3.39741666795754[/C][/ROW]
[ROW][C]30[/C][C]71.4[/C][C]75.6332184965867[/C][C]-4.2332184965867[/C][/ROW]
[ROW][C]31[/C][C]69.5[/C][C]73.8860726057638[/C][C]-4.38607260576378[/C][/ROW]
[ROW][C]32[/C][C]73.5[/C][C]72.9243212208094[/C][C]0.575678779190643[/C][/ROW]
[ROW][C]33[/C][C]72.4[/C][C]74.2354296972381[/C][C]-1.83542969723809[/C][/ROW]
[ROW][C]34[/C][C]74.5[/C][C]74.149553085271[/C][C]0.350446914729022[/C][/ROW]
[ROW][C]35[/C][C]72.2[/C][C]72.250321722223[/C][C]-0.0503217222230579[/C][/ROW]
[ROW][C]36[/C][C]73[/C][C]70.0932477026869[/C][C]2.90675229731315[/C][/ROW]
[ROW][C]37[/C][C]73.3[/C][C]70.8388611457942[/C][C]2.46113885420577[/C][/ROW]
[ROW][C]38[/C][C]71.3[/C][C]70.8176749047772[/C][C]0.482325095222791[/C][/ROW]
[ROW][C]39[/C][C]73.6[/C][C]73.9438274633004[/C][C]-0.343827463300385[/C][/ROW]
[ROW][C]40[/C][C]71.3[/C][C]73.9145747245828[/C][C]-2.61457472458277[/C][/ROW]
[ROW][C]41[/C][C]71.2[/C][C]70.6200221207626[/C][C]0.579977879237361[/C][/ROW]
[ROW][C]42[/C][C]81.4[/C][C]75.2146104322073[/C][C]6.18538956779272[/C][/ROW]
[ROW][C]43[/C][C]76.1[/C][C]74.5571219900001[/C][C]1.54287800999987[/C][/ROW]
[ROW][C]44[/C][C]71.1[/C][C]73.2312931339398[/C][C]-2.13129313393983[/C][/ROW]
[ROW][C]45[/C][C]75.7[/C][C]72.2029650424995[/C][C]3.49703495750055[/C][/ROW]
[ROW][C]46[/C][C]70[/C][C]71.2621157876944[/C][C]-1.26211578769439[/C][/ROW]
[ROW][C]47[/C][C]68.5[/C][C]68.5181831875111[/C][C]-0.0181831875111015[/C][/ROW]
[ROW][C]48[/C][C]56.7[/C][C]62.7179455221013[/C][C]-6.01794552210127[/C][/ROW]
[ROW][C]49[/C][C]57.9[/C][C]61.1141001969254[/C][C]-3.21410019692541[/C][/ROW]
[ROW][C]50[/C][C]58.8[/C][C]59.1367183469946[/C][C]-0.336718346994596[/C][/ROW]
[ROW][C]51[/C][C]59.3[/C][C]60.978247655263[/C][C]-1.67824765526301[/C][/ROW]
[ROW][C]52[/C][C]61.3[/C][C]60.3717305506394[/C][C]0.92826944936056[/C][/ROW]
[ROW][C]53[/C][C]62.9[/C][C]61.5749090918221[/C][C]1.32509090817785[/C][/ROW]
[ROW][C]54[/C][C]61.4[/C][C]62.6638295532629[/C][C]-1.26382955326288[/C][/ROW]
[ROW][C]55[/C][C]64.5[/C][C]61.6015828789563[/C][C]2.89841712104373[/C][/ROW]
[ROW][C]56[/C][C]63.8[/C][C]61.151992527242[/C][C]2.64800747275801[/C][/ROW]
[ROW][C]57[/C][C]61.6[/C][C]63.7144500331477[/C][C]-2.11445003314766[/C][/ROW]
[ROW][C]58[/C][C]64.7[/C][C]61.5263199214601[/C][C]3.17368007853985[/C][/ROW]
[/TABLE]
Source: https://freestatistics.org/blog/index.php?pk=57921&T=4

Globally Unique Identifier (entire table): ba.freestatistics.org/blog/index.php?pk=57921&T=4

As an alternative you can also use a QR Code:  

The GUIDs for individual cells are displayed in the table below:

Multiple Linear Regression - Actuals, Interpolation, and Residuals
Time or IndexActualsInterpolationForecastResidualsPrediction Error
17373.9698574161942-0.969857416194245
27274.2893464271969-2.28934642719692
375.873.31866257851462.48133742148541
472.673.5972044331523-0.99720443315227
571.972.241504968797-0.341504968797058
674.875.6575750843153-0.857575084315297
772.974.2289092984581-1.32890929845814
872.975.3046000406006-2.40460004060062
979.975.5617021823224.33829781767805
107475.4213179613963-1.42131796139633
117675.07687217224530.923127827754687
1269.669.41495053210.185049467900048
1377.373.03146066762664.26853933237341
1475.274.15894586844831.04105413155168
1575.874.83183196696720.968168033032772
1677.673.35406693434844.24593306565155
1776.774.86614715066061.83385284933938
187776.83076643362780.169233566372159
1977.976.62631322682171.27368677317832
2076.775.38779307740821.31220692259180
2171.975.7854530447928-3.88545304479284
2273.474.2406932441782-0.840693244178151
2372.573.3546229180205-0.854622918020528
2473.770.7738562431122.92614375688805
2569.572.0457205734595-2.54572057345952
2674.773.5973144525831.10268554741705
2772.573.9274303359548-1.42743033595479
2872.173.6624233572771-1.56242335727708
2970.774.0974166679575-3.39741666795754
3071.475.6332184965867-4.2332184965867
3169.573.8860726057638-4.38607260576378
3273.572.92432122080940.575678779190643
3372.474.2354296972381-1.83542969723809
3474.574.1495530852710.350446914729022
3572.272.250321722223-0.0503217222230579
367370.09324770268692.90675229731315
3773.370.83886114579422.46113885420577
3871.370.81767490477720.482325095222791
3973.673.9438274633004-0.343827463300385
4071.373.9145747245828-2.61457472458277
4171.270.62002212076260.579977879237361
4281.475.21461043220736.18538956779272
4376.174.55712199000011.54287800999987
4471.173.2312931339398-2.13129313393983
4575.772.20296504249953.49703495750055
467071.2621157876944-1.26211578769439
4768.568.5181831875111-0.0181831875111015
4856.762.7179455221013-6.01794552210127
4957.961.1141001969254-3.21410019692541
5058.859.1367183469946-0.336718346994596
5159.360.978247655263-1.67824765526301
5261.360.37173055063940.92826944936056
5362.961.57490909182211.32509090817785
5461.462.6638295532629-1.26382955326288
5564.561.60158287895632.89841712104373
5663.861.1519925272422.64800747275801
5761.663.7144500331477-2.11445003314766
5864.761.52631992146013.17368007853985


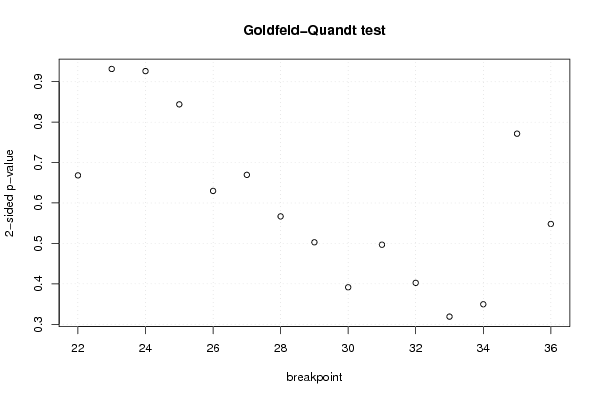
Goldfeld-Quandt test for Heteroskedasticity
p-valuesAlternative Hypothesis
breakpoint indexgreater2-sidedless
220.6658540232857140.6682919534285720.334145976714286
230.5342100962134250.931579807573150.465789903786575
240.4631266107374880.9262532214749750.536873389262512
250.4220059427147470.8440118854294940.577994057285253
260.3149054497076320.6298108994152630.685094550292368
270.3348236662704970.6696473325409930.665176333729503
280.2834425966824630.5668851933649250.716557403317537
290.2513869655532770.5027739311065550.748613034446723
300.1957585305243260.3915170610486530.804241469475674
310.2483889186405820.4967778372811650.751611081359418
320.2012341901107520.4024683802215030.798765809889249
330.1594256905365850.3188513810731710.840574309463414
340.1747519711650590.3495039423301180.825248028834941
350.3857180764996580.7714361529993170.614281923500342
360.2740704150026650.5481408300053310.725929584997335

\begin{tabular}{lllllllll}
\hline
Goldfeld-Quandt test for Heteroskedasticity \tabularnewline
p-values & Alternative Hypothesis \tabularnewline
breakpoint index & greater & 2-sided & less \tabularnewline
22 & 0.665854023285714 & 0.668291953428572 & 0.334145976714286 \tabularnewline
23 & 0.534210096213425 & 0.93157980757315 & 0.465789903786575 \tabularnewline
24 & 0.463126610737488 & 0.926253221474975 & 0.536873389262512 \tabularnewline
25 & 0.422005942714747 & 0.844011885429494 & 0.577994057285253 \tabularnewline
26 & 0.314905449707632 & 0.629810899415263 & 0.685094550292368 \tabularnewline
27 & 0.334823666270497 & 0.669647332540993 & 0.665176333729503 \tabularnewline
28 & 0.283442596682463 & 0.566885193364925 & 0.716557403317537 \tabularnewline
29 & 0.251386965553277 & 0.502773931106555 & 0.748613034446723 \tabularnewline
30 & 0.195758530524326 & 0.391517061048653 & 0.804241469475674 \tabularnewline
31 & 0.248388918640582 & 0.496777837281165 & 0.751611081359418 \tabularnewline
32 & 0.201234190110752 & 0.402468380221503 & 0.798765809889249 \tabularnewline
33 & 0.159425690536585 & 0.318851381073171 & 0.840574309463414 \tabularnewline
34 & 0.174751971165059 & 0.349503942330118 & 0.825248028834941 \tabularnewline
35 & 0.385718076499658 & 0.771436152999317 & 0.614281923500342 \tabularnewline
36 & 0.274070415002665 & 0.548140830005331 & 0.725929584997335 \tabularnewline
\hline
\end{tabular}
%Source: https://freestatistics.org/blog/index.php?pk=57921&T=5

[TABLE]
[ROW][C]Goldfeld-Quandt test for Heteroskedasticity[/C][/ROW]
[ROW][C]p-values[/C][C]Alternative Hypothesis[/C][/ROW]
[ROW][C]breakpoint index[/C][C]greater[/C][C]2-sided[/C][C]less[/C][/ROW]
[ROW][C]22[/C][C]0.665854023285714[/C][C]0.668291953428572[/C][C]0.334145976714286[/C][/ROW]
[ROW][C]23[/C][C]0.534210096213425[/C][C]0.93157980757315[/C][C]0.465789903786575[/C][/ROW]
[ROW][C]24[/C][C]0.463126610737488[/C][C]0.926253221474975[/C][C]0.536873389262512[/C][/ROW]
[ROW][C]25[/C][C]0.422005942714747[/C][C]0.844011885429494[/C][C]0.577994057285253[/C][/ROW]
[ROW][C]26[/C][C]0.314905449707632[/C][C]0.629810899415263[/C][C]0.685094550292368[/C][/ROW]
[ROW][C]27[/C][C]0.334823666270497[/C][C]0.669647332540993[/C][C]0.665176333729503[/C][/ROW]
[ROW][C]28[/C][C]0.283442596682463[/C][C]0.566885193364925[/C][C]0.716557403317537[/C][/ROW]
[ROW][C]29[/C][C]0.251386965553277[/C][C]0.502773931106555[/C][C]0.748613034446723[/C][/ROW]
[ROW][C]30[/C][C]0.195758530524326[/C][C]0.391517061048653[/C][C]0.804241469475674[/C][/ROW]
[ROW][C]31[/C][C]0.248388918640582[/C][C]0.496777837281165[/C][C]0.751611081359418[/C][/ROW]
[ROW][C]32[/C][C]0.201234190110752[/C][C]0.402468380221503[/C][C]0.798765809889249[/C][/ROW]
[ROW][C]33[/C][C]0.159425690536585[/C][C]0.318851381073171[/C][C]0.840574309463414[/C][/ROW]
[ROW][C]34[/C][C]0.174751971165059[/C][C]0.349503942330118[/C][C]0.825248028834941[/C][/ROW]
[ROW][C]35[/C][C]0.385718076499658[/C][C]0.771436152999317[/C][C]0.614281923500342[/C][/ROW]
[ROW][C]36[/C][C]0.274070415002665[/C][C]0.548140830005331[/C][C]0.725929584997335[/C][/ROW]
[/TABLE]
Source: https://freestatistics.org/blog/index.php?pk=57921&T=5

Globally Unique Identifier (entire table): ba.freestatistics.org/blog/index.php?pk=57921&T=5

As an alternative you can also use a QR Code:  

The GUIDs for individual cells are displayed in the table below:

Goldfeld-Quandt test for Heteroskedasticity
p-valuesAlternative Hypothesis
breakpoint indexgreater2-sidedless
220.6658540232857140.6682919534285720.334145976714286
230.5342100962134250.931579807573150.465789903786575
240.4631266107374880.9262532214749750.536873389262512
250.4220059427147470.8440118854294940.577994057285253
260.3149054497076320.6298108994152630.685094550292368
270.3348236662704970.6696473325409930.665176333729503
280.2834425966824630.5668851933649250.716557403317537
290.2513869655532770.5027739311065550.748613034446723
300.1957585305243260.3915170610486530.804241469475674
310.2483889186405820.4967778372811650.751611081359418
320.2012341901107520.4024683802215030.798765809889249
330.1594256905365850.3188513810731710.840574309463414
340.1747519711650590.3495039423301180.825248028834941
350.3857180764996580.7714361529993170.614281923500342
360.2740704150026650.5481408300053310.725929584997335


Meta Analysis of Goldfeld-Quandt test for Heteroskedasticity
Description# significant tests% significant testsOK/NOK
1% type I error level00OK
5% type I error level00OK
10% type I error level00OK

\begin{tabular}{lllllllll}
\hline
Meta Analysis of Goldfeld-Quandt test for Heteroskedasticity \tabularnewline
Description & # significant tests & % significant tests & OK/NOK \tabularnewline
1% type I error level & 0 & 0 & OK \tabularnewline
5% type I error level & 0 & 0 & OK \tabularnewline
10% type I error level & 0 & 0 & OK \tabularnewline
\hline
\end{tabular}
%Source: https://freestatistics.org/blog/index.php?pk=57921&T=6

[TABLE]
[ROW][C]Meta Analysis of Goldfeld-Quandt test for Heteroskedasticity[/C][/ROW]
[ROW][C]Description[/C][C]# significant tests[/C][C]% significant tests[/C][C]OK/NOK[/C][/ROW]
[ROW][C]1% type I error level[/C][C]0[/C][C]0[/C][C]OK[/C][/ROW]
[ROW][C]5% type I error level[/C][C]0[/C][C]0[/C][C]OK[/C][/ROW]
[ROW][C]10% type I error level[/C][C]0[/C][C]0[/C][C]OK[/C][/ROW]
[/TABLE]
Source: https://freestatistics.org/blog/index.php?pk=57921&T=6

Globally Unique Identifier (entire table): ba.freestatistics.org/blog/index.php?pk=57921&T=6

As an alternative you can also use a QR Code:  

The GUIDs for individual cells are displayed in the table below:

Meta Analysis of Goldfeld-Quandt test for Heteroskedasticity
Description# significant tests% significant testsOK/NOK
1% type I error level00OK
5% type I error level00OK
10% type I error level00OK


Parameters (Session):
par1 = 4 ; par2 = Include Monthly Dummies ; par3 = Linear Trend ;
Parameters (R input):
par1 = 4 ; par2 = Include Monthly Dummies ; par3 = Linear Trend ;
R code (references can be found in the software module):
library(lattice)
library(lmtest)
n25 <- 25 #minimum number of obs. for Goldfeld-Quandt test
par1 <- as.numeric(par1)
x <- t(y)
k <- length(x[1,])
n <- length(x[,1])
x1 <- cbind(x[,par1], x[,1:k!=par1])
mycolnames <- c(colnames(x)[par1], colnames(x)[1:k!=par1])
colnames(x1) <- mycolnames #colnames(x)[par1]
x <- x1
if (par3 == 'First Differences'){
x2 <- array(0, dim=c(n-1,k), dimnames=list(1:(n-1), paste('(1-B)',colnames(x),sep='')))
for (i in 1:n-1) {
for (j in 1:k) {
x2[i,j] <- x[i+1,j] - x[i,j]
}
}
x <- x2
}
if (par2 == 'Include Monthly Dummies'){
x2 <- array(0, dim=c(n,11), dimnames=list(1:n, paste('M', seq(1:11), sep ='')))
for (i in 1:11){
x2[seq(i,n,12),i] <- 1
}
x <- cbind(x, x2)
}
if (par2 == 'Include Quarterly Dummies'){
x2 <- array(0, dim=c(n,3), dimnames=list(1:n, paste('Q', seq(1:3), sep ='')))
for (i in 1:3){
x2[seq(i,n,4),i] <- 1
}
x <- cbind(x, x2)
}
k <- length(x[1,])
if (par3 == 'Linear Trend'){
x <- cbind(x, c(1:n))
colnames(x)[k+1] <- 't'
}
x
k <- length(x[1,])
df <- as.data.frame(x)
(mylm <- lm(df))
(mysum <- summary(mylm))
if (n > n25) {
kp3 <- k + 3
nmkm3 <- n - k - 3
gqarr <- array(NA, dim=c(nmkm3-kp3+1,3))
numgqtests <- 0
numsignificant1 <- 0
numsignificant5 <- 0
numsignificant10 <- 0
for (mypoint in kp3:nmkm3) {
j <- 0
numgqtests <- numgqtests + 1
for (myalt in c('greater', 'two.sided', 'less')) {
j <- j + 1
gqarr[mypoint-kp3+1,j] <- gqtest(mylm, point=mypoint, alternative=myalt)$p.value
}
if (gqarr[mypoint-kp3+1,2] < 0.01) numsignificant1 <- numsignificant1 + 1
if (gqarr[mypoint-kp3+1,2] < 0.05) numsignificant5 <- numsignificant5 + 1
if (gqarr[mypoint-kp3+1,2] < 0.10) numsignificant10 <- numsignificant10 + 1
}
gqarr
}
bitmap(file='test0.png')
plot(x[,1], type='l', main='Actuals and Interpolation', ylab='value of Actuals and Interpolation (dots)', xlab='time or index')
points(x[,1]-mysum$resid)
grid()
dev.off()
bitmap(file='test1.png')
plot(mysum$resid, type='b', pch=19, main='Residuals', ylab='value of Residuals', xlab='time or index')
grid()
dev.off()
bitmap(file='test2.png')
hist(mysum$resid, main='Residual Histogram', xlab='values of Residuals')
grid()
dev.off()
bitmap(file='test3.png')
densityplot(~mysum$resid,col='black',main='Residual Density Plot', xlab='values of Residuals')
dev.off()
bitmap(file='test4.png')
qqnorm(mysum$resid, main='Residual Normal Q-Q Plot')
qqline(mysum$resid)
grid()
dev.off()
(myerror <- as.ts(mysum$resid))
bitmap(file='test5.png')
dum <- cbind(lag(myerror,k=1),myerror)
dum
dum1 <- dum[2:length(myerror),]
dum1
z <- as.data.frame(dum1)
z
plot(z,main=paste('Residual Lag plot, lowess, and regression line'), ylab='values of Residuals', xlab='lagged values of Residuals')
lines(lowess(z))
abline(lm(z))
grid()
dev.off()
bitmap(file='test6.png')
acf(mysum$resid, lag.max=length(mysum$resid)/2, main='Residual Autocorrelation Function')
grid()
dev.off()
bitmap(file='test7.png')
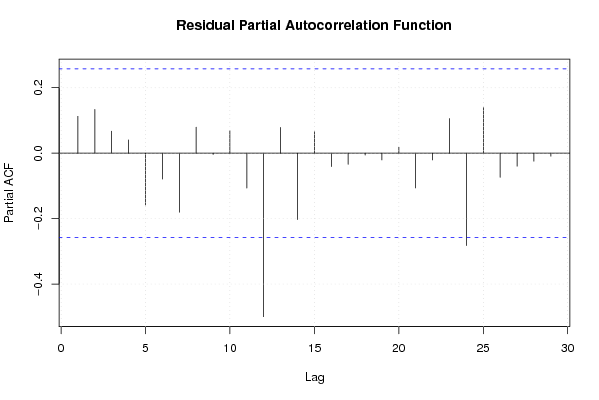
pacf(mysum$resid, lag.max=length(mysum$resid)/2, main='Residual Partial Autocorrelation Function')
grid()
dev.off()
bitmap(file='test8.png')
opar <- par(mfrow = c(2,2), oma = c(0, 0, 1.1, 0))
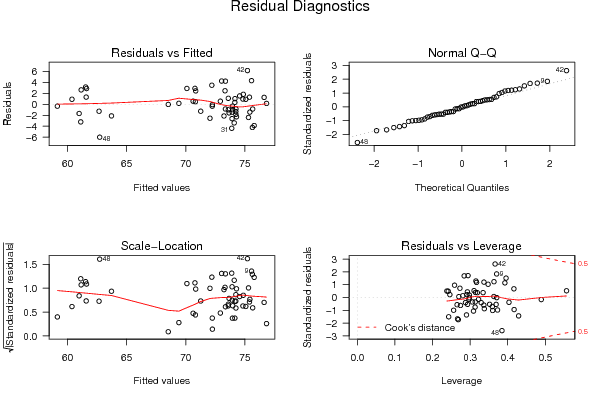
plot(mylm, las = 1, sub='Residual Diagnostics')
par(opar)
dev.off()
if (n > n25) {
bitmap(file='test9.png')
plot(kp3:nmkm3,gqarr[,2], main='Goldfeld-Quandt test',ylab='2-sided p-value',xlab='breakpoint')
grid()
dev.off()
}
load(file='createtable')
a<-table.start()
a<-table.row.start(a)
a<-table.element(a, 'Multiple Linear Regression - Estimated Regression Equation', 1, TRUE)
a<-table.row.end(a)
myeq <- colnames(x)[1]
myeq <- paste(myeq, '[t] = ', sep='')
for (i in 1:k){
if (mysum$coefficients[i,1] > 0) myeq <- paste(myeq, '+', '')
myeq <- paste(myeq, mysum$coefficients[i,1], sep=' ')
if (rownames(mysum$coefficients)[i] != '(Intercept)') {
myeq <- paste(myeq, rownames(mysum$coefficients)[i], sep='')
if (rownames(mysum$coefficients)[i] != 't') myeq <- paste(myeq, '[t]', sep='')
}
}
myeq <- paste(myeq, ' + e[t]')
a<-table.row.start(a)
a<-table.element(a, myeq)
a<-table.row.end(a)
a<-table.end(a)
table.save(a,file='mytable1.tab')
a<-table.start()
a<-table.row.start(a)
a<-table.element(a,hyperlink('ols1.htm','Multiple Linear Regression - Ordinary Least Squares',''), 6, TRUE)
a<-table.row.end(a)
a<-table.row.start(a)
a<-table.element(a,'Variable',header=TRUE)
a<-table.element(a,'Parameter',header=TRUE)
a<-table.element(a,'S.D.',header=TRUE)
a<-table.element(a,'T-STAT
H0: parameter = 0',header=TRUE)
a<-table.element(a,'2-tail p-value',header=TRUE)
a<-table.element(a,'1-tail p-value',header=TRUE)
a<-table.row.end(a)
for (i in 1:k){
a<-table.row.start(a)
a<-table.element(a,rownames(mysum$coefficients)[i],header=TRUE)
a<-table.element(a,mysum$coefficients[i,1])
a<-table.element(a, round(mysum$coefficients[i,2],6))
a<-table.element(a, round(mysum$coefficients[i,3],4))
a<-table.element(a, round(mysum$coefficients[i,4],6))
a<-table.element(a, round(mysum$coefficients[i,4]/2,6))
a<-table.row.end(a)
}
a<-table.end(a)
table.save(a,file='mytable2.tab')
a<-table.start()
a<-table.row.start(a)
a<-table.element(a, 'Multiple Linear Regression - Regression Statistics', 2, TRUE)
a<-table.row.end(a)
a<-table.row.start(a)
a<-table.element(a, 'Multiple R',1,TRUE)
a<-table.element(a, sqrt(mysum$r.squared))
a<-table.row.end(a)
a<-table.row.start(a)
a<-table.element(a, 'R-squared',1,TRUE)
a<-table.element(a, mysum$r.squared)
a<-table.row.end(a)
a<-table.row.start(a)
a<-table.element(a, 'Adjusted R-squared',1,TRUE)
a<-table.element(a, mysum$adj.r.squared)
a<-table.row.end(a)
a<-table.row.start(a)
a<-table.element(a, 'F-TEST (value)',1,TRUE)
a<-table.element(a, mysum$fstatistic[1])
a<-table.row.end(a)
a<-table.row.start(a)
a<-table.element(a, 'F-TEST (DF numerator)',1,TRUE)
a<-table.element(a, mysum$fstatistic[2])
a<-table.row.end(a)
a<-table.row.start(a)
a<-table.element(a, 'F-TEST (DF denominator)',1,TRUE)
a<-table.element(a, mysum$fstatistic[3])
a<-table.row.end(a)
a<-table.row.start(a)
a<-table.element(a, 'p-value',1,TRUE)
a<-table.element(a, 1-pf(mysum$fstatistic[1],mysum$fstatistic[2],mysum$fstatistic[3]))
a<-table.row.end(a)
a<-table.row.start(a)
a<-table.element(a, 'Multiple Linear Regression - Residual Statistics', 2, TRUE)
a<-table.row.end(a)
a<-table.row.start(a)
a<-table.element(a, 'Residual Standard Deviation',1,TRUE)
a<-table.element(a, mysum$sigma)
a<-table.row.end(a)
a<-table.row.start(a)
a<-table.element(a, 'Sum Squared Residuals',1,TRUE)
a<-table.element(a, sum(myerror*myerror))
a<-table.row.end(a)
a<-table.end(a)
table.save(a,file='mytable3.tab')
a<-table.start()
a<-table.row.start(a)
a<-table.element(a, 'Multiple Linear Regression - Actuals, Interpolation, and Residuals', 4, TRUE)
a<-table.row.end(a)
a<-table.row.start(a)
a<-table.element(a, 'Time or Index', 1, TRUE)
a<-table.element(a, 'Actuals', 1, TRUE)
a<-table.element(a, 'Interpolation
Forecast', 1, TRUE)
a<-table.element(a, 'Residuals
Prediction Error', 1, TRUE)
a<-table.row.end(a)
for (i in 1:n) {
a<-table.row.start(a)
a<-table.element(a,i, 1, TRUE)
a<-table.element(a,x[i])
a<-table.element(a,x[i]-mysum$resid[i])
a<-table.element(a,mysum$resid[i])
a<-table.row.end(a)
}
a<-table.end(a)
table.save(a,file='mytable4.tab')
if (n > n25) {
a<-table.start()
a<-table.row.start(a)
a<-table.element(a,'Goldfeld-Quandt test for Heteroskedasticity',4,TRUE)
a<-table.row.end(a)
a<-table.row.start(a)
a<-table.element(a,'p-values',header=TRUE)
a<-table.element(a,'Alternative Hypothesis',3,header=TRUE)
a<-table.row.end(a)
a<-table.row.start(a)
a<-table.element(a,'breakpoint index',header=TRUE)
a<-table.element(a,'greater',header=TRUE)
a<-table.element(a,'2-sided',header=TRUE)
a<-table.element(a,'less',header=TRUE)
a<-table.row.end(a)
for (mypoint in kp3:nmkm3) {
a<-table.row.start(a)
a<-table.element(a,mypoint,header=TRUE)
a<-table.element(a,gqarr[mypoint-kp3+1,1])
a<-table.element(a,gqarr[mypoint-kp3+1,2])
a<-table.element(a,gqarr[mypoint-kp3+1,3])
a<-table.row.end(a)
}
a<-table.end(a)
table.save(a,file='mytable5.tab')
a<-table.start()
a<-table.row.start(a)
a<-table.element(a,'Meta Analysis of Goldfeld-Quandt test for Heteroskedasticity',4,TRUE)
a<-table.row.end(a)
a<-table.row.start(a)
a<-table.element(a,'Description',header=TRUE)
a<-table.element(a,'# significant tests',header=TRUE)
a<-table.element(a,'% significant tests',header=TRUE)
a<-table.element(a,'OK/NOK',header=TRUE)
a<-table.row.end(a)
a<-table.row.start(a)
a<-table.element(a,'1% type I error level',header=TRUE)
a<-table.element(a,numsignificant1)
a<-table.element(a,numsignificant1/numgqtests)
if (numsignificant1/numgqtests < 0.01) dum <- 'OK' else dum <- 'NOK'
a<-table.element(a,dum)
a<-table.row.end(a)
a<-table.row.start(a)
a<-table.element(a,'5% type I error level',header=TRUE)
a<-table.element(a,numsignificant5)
a<-table.element(a,numsignificant5/numgqtests)
if (numsignificant5/numgqtests < 0.05) dum <- 'OK' else dum <- 'NOK'
a<-table.element(a,dum)
a<-table.row.end(a)
a<-table.row.start(a)
a<-table.element(a,'10% type I error level',header=TRUE)
a<-table.element(a,numsignificant10)
a<-table.element(a,numsignificant10/numgqtests)
if (numsignificant10/numgqtests < 0.1) dum <- 'OK' else dum <- 'NOK'
a<-table.element(a,dum)
a<-table.row.end(a)
a<-table.end(a)
table.save(a,file='mytable6.tab')
}