| Multiple Linear Regression - Estimated Regression Equation |
| Y[t] = -40.0888737749896 + 0.965538000196312X[t] + 0.211997203187267Y1[t] + 0.314978135556808Y2[t] + 0.157411623308698Y3[t] -0.179123688240991Y4[t] -10.6311348674679M1[t] + 1.03583125266299M2[t] + 3.24681617767808M3[t] -8.72618456159211M4[t] -11.3837568394227M5[t] -2.30380200294361M6[t] + 0.542620183436238M7[t] + 3.56311254662019M8[t] -4.05010861645826M9[t] -4.49687150415468M10[t] -4.03469937535103M11[t] + 0.0118021665660321t + e[t] |
| Multiple Linear Regression - Ordinary Least Squares | |||||
| Variable | Parameter | S.D. | T-STAT H0: parameter = 0 | 2-tail p-value | 1-tail p-value |
| (Intercept) | -40.0888737749896 | 12.061746 | -3.3236 | 0.001975 | 0.000987 |
| X | 0.965538000196312 | 0.086521 | 11.1596 | 0 | 0 |
| Y1 | 0.211997203187267 | 0.075867 | 2.7943 | 0.008105 | 0.004053 |
| Y2 | 0.314978135556808 | 0.068963 | 4.5673 | 5.1e-05 | 2.5e-05 |
| Y3 | 0.157411623308698 | 0.090882 | 1.732 | 0.091377 | 0.045689 |
| Y4 | -0.179123688240991 | 0.09768 | -1.8338 | 0.074529 | 0.037264 |
| M1 | -10.6311348674679 | 2.617157 | -4.0621 | 0.000235 | 0.000117 |
| M2 | 1.03583125266299 | 3.500092 | 0.2959 | 0.768884 | 0.384442 |
| M3 | 3.24681617767808 | 3.868792 | 0.8392 | 0.406588 | 0.203294 |
| M4 | -8.72618456159211 | 3.687309 | -2.3665 | 0.023155 | 0.011577 |
| M5 | -11.3837568394227 | 2.665673 | -4.2705 | 0.000126 | 6.3e-05 |
| M6 | -2.30380200294361 | 2.500755 | -0.9212 | 0.362736 | 0.181368 |
| M7 | 0.542620183436238 | 2.583021 | 0.2101 | 0.834734 | 0.417367 |
| M8 | 3.56311254662019 | 3.194155 | 1.1155 | 0.271637 | 0.135818 |
| M9 | -4.05010861645826 | 2.834299 | -1.429 | 0.161184 | 0.080592 |
| M10 | -4.49687150415468 | 2.607262 | -1.7247 | 0.092699 | 0.04635 |
| M11 | -4.03469937535103 | 2.832042 | -1.4247 | 0.162417 | 0.081208 |
| t | 0.0118021665660321 | 0.053485 | 0.2207 | 0.826536 | 0.413268 |
| Multiple Linear Regression - Regression Statistics | |
| Multiple R | 0.98352786285997 |
| R-squared | 0.9673270570219 |
| Adjusted R-squared | 0.952710214110644 |
| F-TEST (value) | 66.1789322697735 |
| F-TEST (DF numerator) | 17 |
| F-TEST (DF denominator) | 38 |
| p-value | 0 |
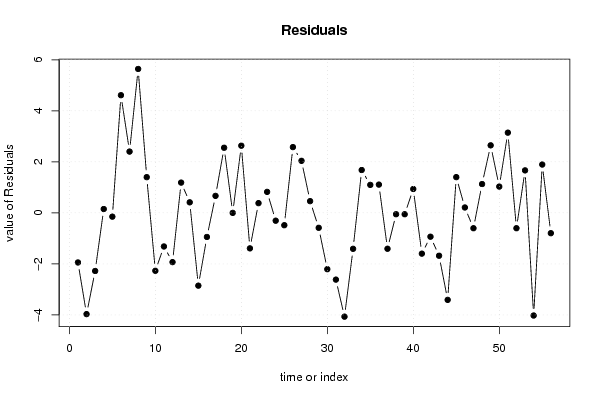
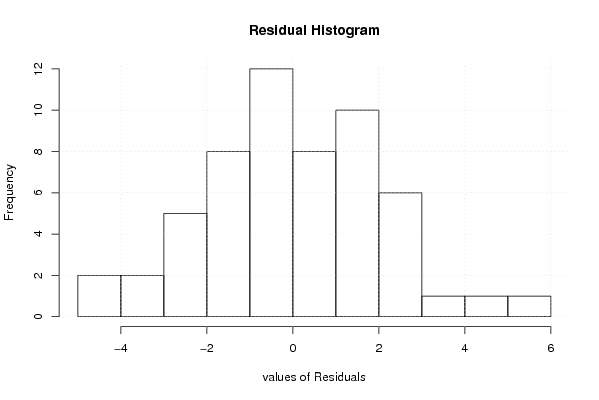
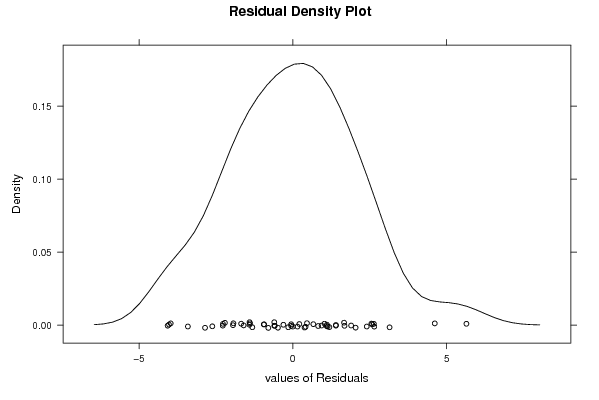
| Multiple Linear Regression - Residual Statistics | |
| Residual Standard Deviation | 2.49539822501776 |
| Sum Squared Residuals | 236.626467454028 |
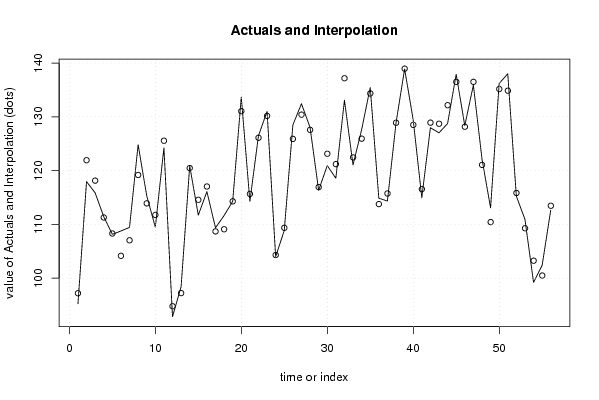
| Multiple Linear Regression - Actuals, Interpolation, and Residuals | |||
| Time or Index | Actuals | Interpolation Forecast | Residuals Prediction Error |
| 1 | 95.26 | 97.2045355426287 | -1.94453554262867 |
| 2 | 117.96 | 121.929896830728 | -3.96989683072825 |
| 3 | 115.86 | 118.138219099141 | -2.27821909914148 |
| 4 | 111.44 | 111.289635920307 | 0.150364079692696 |
| 5 | 108.16 | 108.308328690821 | -0.148328690821096 |
| 6 | 108.77 | 104.157093374858 | 4.612906625142 |
| 7 | 109.45 | 107.047107507659 | 2.40289249234138 |
| 8 | 124.83 | 119.187847777566 | 5.6421522224342 |
| 9 | 115.31 | 113.910155485528 | 1.39984451447206 |
| 10 | 109.49 | 111.761090968019 | -2.27109096801872 |
| 11 | 124.24 | 125.557336751923 | -1.31733675192334 |
| 12 | 92.85 | 94.7813893063884 | -1.93138930638843 |
| 13 | 98.42 | 97.2324761642042 | 1.18752383579579 |
| 14 | 120.88 | 120.466141510327 | 0.41385848967269 |
| 15 | 111.72 | 114.573161341898 | -2.85316134189815 |
| 16 | 116.1 | 117.044012828888 | -0.944012828887981 |
| 17 | 109.37 | 108.703339860618 | 0.666660139381755 |
| 18 | 111.65 | 109.096676011904 | 2.55332398809623 |
| 19 | 114.29 | 114.290101630533 | -0.000101630532604924 |
| 20 | 133.68 | 131.046239349309 | 2.63376065069116 |
| 21 | 114.27 | 115.661426920568 | -1.3914269205678 |
| 22 | 126.49 | 126.109140812171 | 0.380859187829363 |
| 23 | 131 | 130.177348759253 | 0.82265124074683 |
| 24 | 104 | 104.306712974902 | -0.306712974902057 |
| 25 | 108.88 | 109.363991807859 | -0.483991807859451 |
| 26 | 128.48 | 125.901125139701 | 2.57887486029903 |
| 27 | 132.44 | 130.399603652302 | 2.04039634769824 |
| 28 | 128.04 | 127.580056964679 | 0.459943035320896 |
| 29 | 116.35 | 116.935592592290 | -0.585592592290121 |
| 30 | 120.93 | 123.137876233190 | -2.20787623319043 |
| 31 | 118.59 | 121.207135823945 | -2.6171358239449 |
| 32 | 133.1 | 137.168722113519 | -4.06872211351877 |
| 33 | 121.05 | 122.458902245849 | -1.40890224584852 |
| 34 | 127.62 | 125.940699883183 | 1.67930011681706 |
| 35 | 135.44 | 134.342951556277 | 1.09704844372256 |
| 36 | 114.88 | 113.771994195632 | 1.10800580436833 |
| 37 | 114.34 | 115.746557427993 | -1.40655742799279 |
| 38 | 128.85 | 128.902978422081 | -0.0529784220806831 |
| 39 | 138.9 | 138.953452723380 | -0.0534527233804785 |
| 40 | 129.44 | 128.504543741499 | 0.935456258500719 |
| 41 | 114.96 | 116.557924393677 | -1.59792439367745 |
| 42 | 127.98 | 128.914427432180 | -0.934427432179746 |
| 43 | 127.03 | 128.710294744851 | -1.68029474485127 |
| 44 | 128.75 | 132.160783041184 | -3.41078304118390 |
| 45 | 137.91 | 136.509515348056 | 1.40048465194426 |
| 46 | 128.37 | 128.159068336628 | 0.210931663372300 |
| 47 | 135.9 | 136.502362932546 | -0.602362932546049 |
| 48 | 122.19 | 121.059903523078 | 1.13009647692215 |
| 49 | 113.08 | 110.432439057315 | 2.64756094268512 |
| 50 | 136.2 | 135.169858097163 | 1.03014190283722 |
| 51 | 138 | 134.855563183278 | 3.14443681672186 |
| 52 | 115.24 | 115.841750544626 | -0.601750544626329 |
| 53 | 110.95 | 109.284814462593 | 1.66518553740691 |
| 54 | 99.23 | 103.253926947868 | -4.02392694786806 |
| 55 | 102.39 | 100.495360293013 | 1.8946397069874 |
| 56 | 112.67 | 113.466407718423 | -0.796407718422687 |
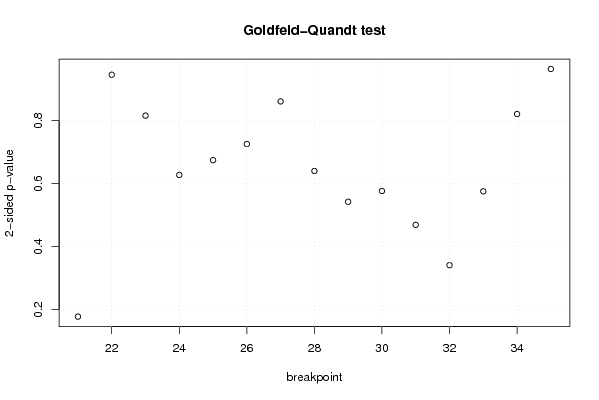
| Goldfeld-Quandt test for Heteroskedasticity | |||
| p-values | Alternative Hypothesis | ||
| breakpoint index | greater | 2-sided | less |
| 21 | 0.0886573984228738 | 0.177314796845748 | 0.911342601577126 |
| 22 | 0.473056023391612 | 0.946112046783224 | 0.526943976608388 |
| 23 | 0.40802895075594 | 0.81605790151188 | 0.59197104924406 |
| 24 | 0.313827954640074 | 0.627655909280147 | 0.686172045359926 |
| 25 | 0.337342893036547 | 0.674685786073094 | 0.662657106963453 |
| 26 | 0.362982319672024 | 0.725964639344048 | 0.637017680327976 |
| 27 | 0.430665555825249 | 0.861331111650498 | 0.569334444174751 |
| 28 | 0.320059522903959 | 0.640119045807918 | 0.679940477096041 |
| 29 | 0.271175288193983 | 0.542350576387965 | 0.728824711806017 |
| 30 | 0.711631622049653 | 0.576736755900694 | 0.288368377950347 |
| 31 | 0.765477187332251 | 0.469045625335499 | 0.234522812667749 |
| 32 | 0.829540749718275 | 0.34091850056345 | 0.170459250281725 |
| 33 | 0.712216000643809 | 0.575567998712382 | 0.287783999356191 |
| 34 | 0.589422072687887 | 0.821155854624226 | 0.410577927312113 |
| 35 | 0.517777370932639 | 0.964445258134721 | 0.482222629067361 |
| Meta Analysis of Goldfeld-Quandt test for Heteroskedasticity | |||
| Description | # significant tests | % significant tests | OK/NOK |
| 1% type I error level | 0 | 0 | OK |
| 5% type I error level | 0 | 0 | OK |
| 10% type I error level | 0 | 0 | OK |