| Multiple Linear Regression - Estimated Regression Equation |
| Y[t] = + 483.691428571429 -11.4133928571428X[t] -3.96173611111105M1[t] -17.4843650793651M2[t] -21.4641964285714M3[t] -26.8440277777778M4[t] -20.4238591269841M5[t] -13.7210119047619M6[t] -14.1008432539683M7[t] -17.2806746031746M8[t] -18.6605059523810M9[t] -22.8403373015873M10[t] -21.2201686507937M11[t] -0.820168650793652t + e[t] |
| Multiple Linear Regression - Ordinary Least Squares | |||||
| Variable | Parameter | S.D. | T-STAT H0: parameter = 0 | 2-tail p-value | 1-tail p-value |
| (Intercept) | 483.691428571429 | 10.494045 | 46.092 | 0 | 0 |
| X | -11.4133928571428 | 9.098821 | -1.2544 | 0.215906 | 0.107953 |
| M1 | -3.96173611111105 | 11.574235 | -0.3423 | 0.733659 | 0.36683 |
| M2 | -17.4843650793651 | 12.142857 | -1.4399 | 0.156527 | 0.078263 |
| M3 | -21.4641964285714 | 12.126631 | -1.77 | 0.083213 | 0.041607 |
| M4 | -26.8440277777778 | 12.115197 | -2.2157 | 0.03159 | 0.015795 |
| M5 | -20.4238591269841 | 12.10857 | -1.6867 | 0.098283 | 0.049142 |
| M6 | -13.7210119047619 | 12.146916 | -1.1296 | 0.264382 | 0.132191 |
| M7 | -14.1008432539683 | 12.120481 | -1.1634 | 0.250544 | 0.125272 |
| M8 | -17.2806746031746 | 12.09881 | -1.4283 | 0.159819 | 0.079909 |
| M9 | -18.6605059523810 | 12.081927 | -1.5445 | 0.129175 | 0.064588 |
| M10 | -22.8403373015873 | 12.069854 | -1.8923 | 0.064614 | 0.032307 |
| M11 | -21.2201686507937 | 12.062604 | -1.7592 | 0.085057 | 0.042529 |
| t | -0.820168650793652 | 0.241493 | -3.3962 | 0.001398 | 0.000699 |
| Multiple Linear Regression - Regression Statistics | |
| Multiple R | 0.76690115829855 |
| R-squared | 0.588137386599658 |
| Adjusted R-squared | 0.474217940339989 |
| F-TEST (value) | 5.16274794084806 |
| F-TEST (DF numerator) | 13 |
| F-TEST (DF denominator) | 47 |
| p-value | 1.37133299228376e-05 |
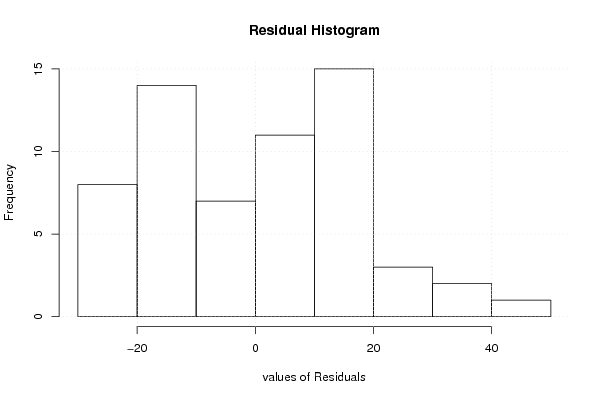
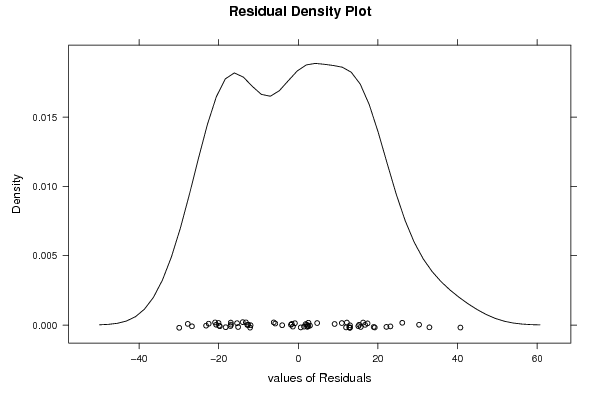
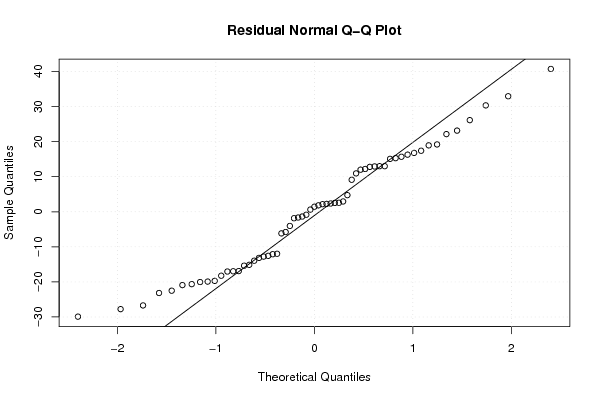
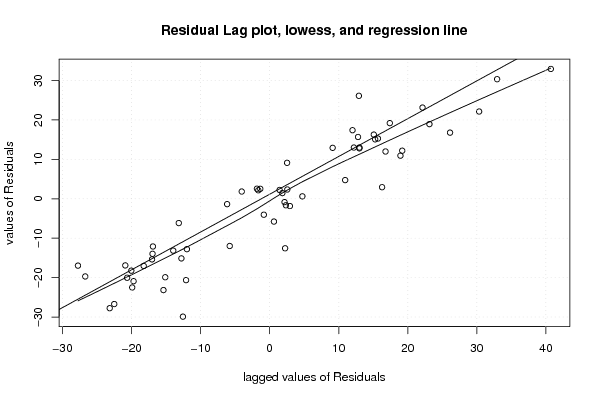
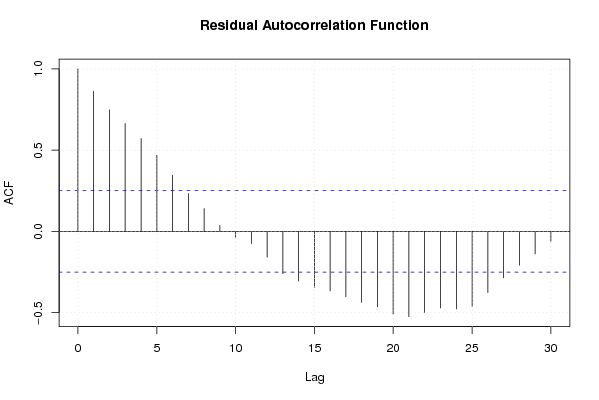
| Multiple Linear Regression - Residual Statistics | |
| Residual Standard Deviation | 19.0688290645920 |
| Sum Squared Residuals | 17090.1513690476 |
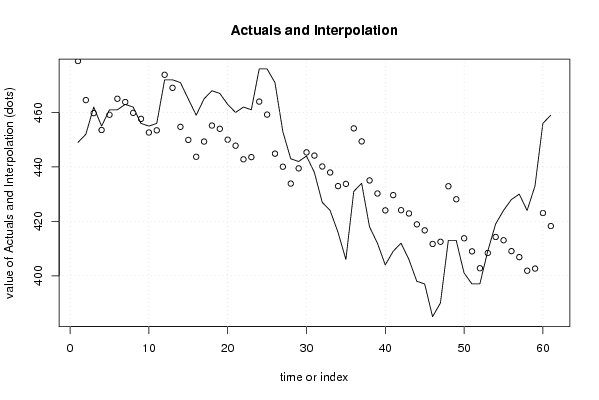
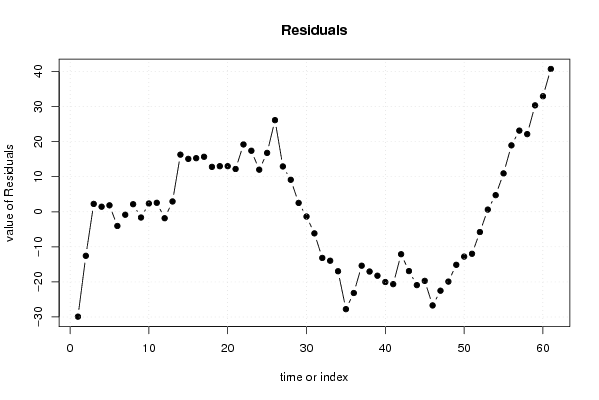
| Multiple Linear Regression - Actuals, Interpolation, and Residuals | |||
| Time or Index | Actuals | Interpolation Forecast | Residuals Prediction Error |
| 1 | 449 | 478.909523809523 | -29.9095238095235 |
| 2 | 452 | 464.566726190476 | -12.5667261904762 |
| 3 | 462 | 459.766726190476 | 2.2332738095238 |
| 4 | 455 | 453.566726190476 | 1.43327380952374 |
| 5 | 461 | 459.166726190476 | 1.83327380952379 |
| 6 | 461 | 465.049404761905 | -4.04940476190479 |
| 7 | 463 | 463.849404761905 | -0.84940476190481 |
| 8 | 462 | 459.849404761905 | 2.15059523809525 |
| 9 | 456 | 457.649404761905 | -1.64940476190476 |
| 10 | 455 | 452.649404761905 | 2.35059523809522 |
| 11 | 456 | 453.449404761905 | 2.55059523809523 |
| 12 | 472 | 473.849404761905 | -1.84940476190477 |
| 13 | 472 | 469.0675 | 2.93249999999991 |
| 14 | 471 | 454.724702380952 | 16.2752976190476 |
| 15 | 465 | 449.924702380952 | 15.0752976190476 |
| 16 | 459 | 443.724702380952 | 15.2752976190476 |
| 17 | 465 | 449.324702380952 | 15.6752976190476 |
| 18 | 468 | 455.207380952381 | 12.7926190476190 |
| 19 | 467 | 454.007380952381 | 12.9926190476191 |
| 20 | 463 | 450.007380952381 | 12.9926190476190 |
| 21 | 460 | 447.807380952381 | 12.1926190476190 |
| 22 | 462 | 442.807380952381 | 19.1926190476191 |
| 23 | 461 | 443.607380952381 | 17.3926190476190 |
| 24 | 476 | 464.007380952381 | 11.9926190476190 |
| 25 | 476 | 459.225476190476 | 16.7745238095237 |
| 26 | 471 | 444.882678571429 | 26.1173214285714 |
| 27 | 453 | 440.082678571429 | 12.9173214285714 |
| 28 | 443 | 433.882678571429 | 9.11732142857146 |
| 29 | 442 | 439.482678571429 | 2.51732142857144 |
| 30 | 444 | 445.365357142857 | -1.36535714285713 |
| 31 | 438 | 444.165357142857 | -6.16535714285712 |
| 32 | 427 | 440.165357142857 | -13.1653571428571 |
| 33 | 424 | 437.965357142857 | -13.9653571428571 |
| 34 | 416 | 432.965357142857 | -16.9653571428571 |
| 35 | 406 | 433.765357142857 | -27.7653571428571 |
| 36 | 431 | 454.165357142857 | -23.1653571428571 |
| 37 | 434 | 449.383452380952 | -15.3834523809524 |
| 38 | 418 | 435.040654761905 | -17.0406547619047 |
| 39 | 412 | 430.240654761905 | -18.2406547619048 |
| 40 | 404 | 424.040654761905 | -20.0406547619047 |
| 41 | 409 | 429.640654761905 | -20.6406547619048 |
| 42 | 412 | 424.10994047619 | -12.1099404761905 |
| 43 | 406 | 422.90994047619 | -16.9099404761905 |
| 44 | 398 | 418.90994047619 | -20.9099404761905 |
| 45 | 397 | 416.70994047619 | -19.7099404761905 |
| 46 | 385 | 411.70994047619 | -26.7099404761905 |
| 47 | 390 | 412.50994047619 | -22.5099404761905 |
| 48 | 413 | 432.90994047619 | -19.9099404761905 |
| 49 | 413 | 428.128035714286 | -15.1280357142858 |
| 50 | 401 | 413.785238095238 | -12.7852380952381 |
| 51 | 397 | 408.985238095238 | -11.9852380952381 |
| 52 | 397 | 402.785238095238 | -5.78523809523807 |
| 53 | 409 | 408.385238095238 | 0.614761904761917 |
| 54 | 419 | 414.267916666667 | 4.73208333333334 |
| 55 | 424 | 413.067916666667 | 10.9320833333334 |
| 56 | 428 | 409.067916666667 | 18.9320833333333 |
| 57 | 430 | 406.867916666667 | 23.1320833333333 |
| 58 | 424 | 401.867916666667 | 22.1320833333333 |
| 59 | 433 | 402.667916666667 | 30.3320833333333 |
| 60 | 456 | 423.067916666667 | 32.9320833333333 |
| 61 | 459 | 418.286011904762 | 40.7139880952381 |
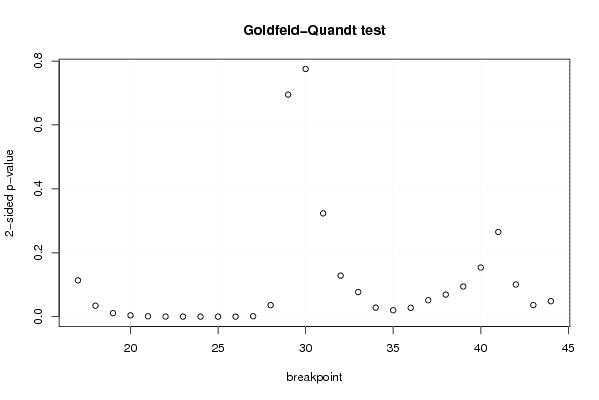
| Goldfeld-Quandt test for Heteroskedasticity | |||
| p-values | Alternative Hypothesis | ||
| breakpoint index | greater | 2-sided | less |
| 17 | 0.0567678577580559 | 0.113535715516112 | 0.943232142241944 |
| 18 | 0.0171422508672685 | 0.034284501734537 | 0.982857749132731 |
| 19 | 0.00547092909035969 | 0.0109418581807194 | 0.99452907090964 |
| 20 | 0.00205654063939279 | 0.00411308127878558 | 0.997943459360607 |
| 21 | 0.000591869430322539 | 0.00118373886064508 | 0.999408130569677 |
| 22 | 0.000174969646268988 | 0.000349939292537975 | 0.99982503035373 |
| 23 | 5.69802119387683e-05 | 0.000113960423877537 | 0.999943019788061 |
| 24 | 1.84628907941010e-05 | 3.69257815882019e-05 | 0.999981537109206 |
| 25 | 7.78241757841023e-06 | 1.55648351568205e-05 | 0.999992217582422 |
| 26 | 9.0285995226325e-06 | 1.8057199045265e-05 | 0.999990971400477 |
| 27 | 0.000633450145352484 | 0.00126690029070497 | 0.999366549854648 |
| 28 | 0.0179369438120853 | 0.0358738876241706 | 0.982063056187915 |
| 29 | 0.347441500971369 | 0.694883001942738 | 0.652558499028631 |
| 30 | 0.61236363330171 | 0.775272733396581 | 0.387636366698290 |
| 31 | 0.838348859805008 | 0.323302280389984 | 0.161651140194992 |
| 32 | 0.935796435895031 | 0.128407128209938 | 0.0642035641049688 |
| 33 | 0.961609181886978 | 0.076781636226045 | 0.0383908181130225 |
| 34 | 0.985894334535324 | 0.0282113309293518 | 0.0141056654646759 |
| 35 | 0.989937587496556 | 0.0201248250068872 | 0.0100624125034436 |
| 36 | 0.986188714461378 | 0.027622571077244 | 0.013811285538622 |
| 37 | 0.974310925087187 | 0.0513781498256265 | 0.0256890749128133 |
| 38 | 0.965508506799553 | 0.0689829864008929 | 0.0344914932004465 |
| 39 | 0.952838537719198 | 0.0943229245616049 | 0.0471614622808024 |
| 40 | 0.923133025481806 | 0.153733949036388 | 0.0768669745181939 |
| 41 | 0.86750735071664 | 0.264985298566721 | 0.132492649283361 |
| 42 | 0.949694242275446 | 0.100611515449108 | 0.0503057577245541 |
| 43 | 0.981933543850821 | 0.0361329122983578 | 0.0180664561491789 |
| 44 | 0.975813948459364 | 0.0483721030812725 | 0.0241860515406362 |
| Meta Analysis of Goldfeld-Quandt test for Heteroskedasticity | |||
| Description | # significant tests | % significant tests | OK/NOK |
| 1% type I error level | 8 | 0.285714285714286 | NOK |
| 5% type I error level | 16 | 0.571428571428571 | NOK |
| 10% type I error level | 20 | 0.714285714285714 | NOK |