| Multiple Linear Regression - Estimated Regression Equation |
| X[t] = + 1.05047871431013 + 1.11395110275261Y[t] + 0.177720977944961M1[t] + 0.0691160882202088M2[t] -0.0708839117797914M3[t] -0.180511198495470M4[t] -0.341533595486408M5[t] -0.477486749871774M6[t] -0.595207727816722M7[t] -0.719254573431356M8[t] -0.803301419045992M9[t] -0.64051119849547M10[t] -0.142092665412891M11[t] + e[t] |
| Multiple Linear Regression - Ordinary Least Squares | |||||
| Variable | Parameter | S.D. | T-STAT H0: parameter = 0 | 2-tail p-value | 1-tail p-value |
| (Intercept) | 1.05047871431013 | 1.099323 | 0.9556 | 0.344396 | 0.172198 |
| Y | 1.11395110275261 | 0.184729 | 6.0302 | 0 | 0 |
| M1 | 0.177720977944961 | 0.423851 | 0.4193 | 0.676991 | 0.338496 |
| M2 | 0.0691160882202088 | 0.424092 | 0.163 | 0.871269 | 0.435634 |
| M3 | -0.0708839117797914 | 0.424092 | -0.1671 | 0.868007 | 0.434003 |
| M4 | -0.180511198495470 | 0.425137 | -0.4246 | 0.673155 | 0.336578 |
| M5 | -0.341533595486408 | 0.435416 | -0.7844 | 0.436924 | 0.218462 |
| M6 | -0.477486749871774 | 0.442058 | -1.0801 | 0.285833 | 0.142916 |
| M7 | -0.595207727816722 | 0.441022 | -1.3496 | 0.183892 | 0.091946 |
| M8 | -0.719254573431356 | 0.434584 | -1.655 | 0.104875 | 0.052438 |
| M9 | -0.803301419045992 | 0.429609 | -1.8698 | 0.06802 | 0.03401 |
| M10 | -0.64051119849547 | 0.425137 | -1.5066 | 0.138902 | 0.069451 |
| M11 | -0.142092665412891 | 0.44762 | -0.3174 | 0.752378 | 0.376189 |
| Multiple Linear Regression - Regression Statistics | |
| Multiple R | 0.70191490771637 |
| R-squared | 0.492684537674481 |
| Adjusted R-squared | 0.357400414387675 |
| F-TEST (value) | 3.64185039385575 |
| F-TEST (DF numerator) | 12 |
| F-TEST (DF denominator) | 45 |
| p-value | 0.000762777364173739 |
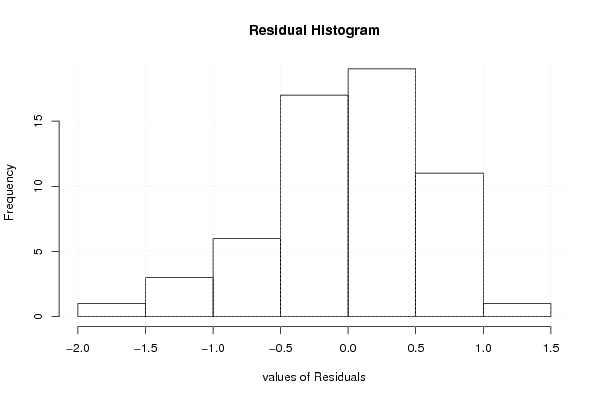
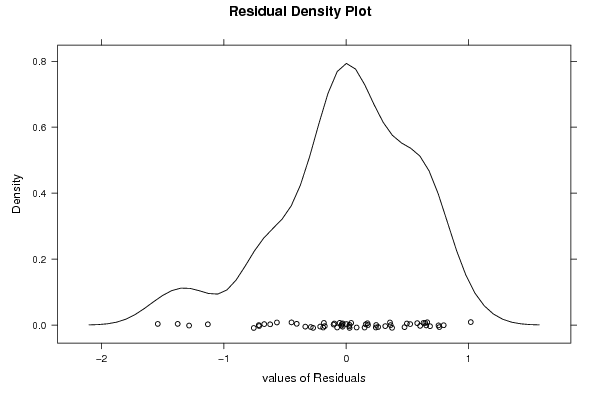
| Multiple Linear Regression - Residual Statistics | |
| Residual Standard Deviation | 0.631815781520582 |
| Sum Squared Residuals | 17.9636031800309 |
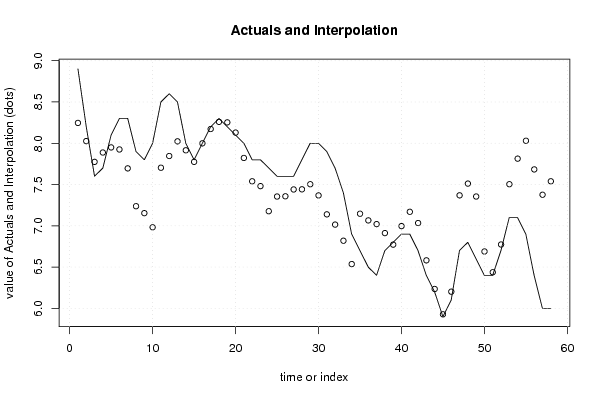
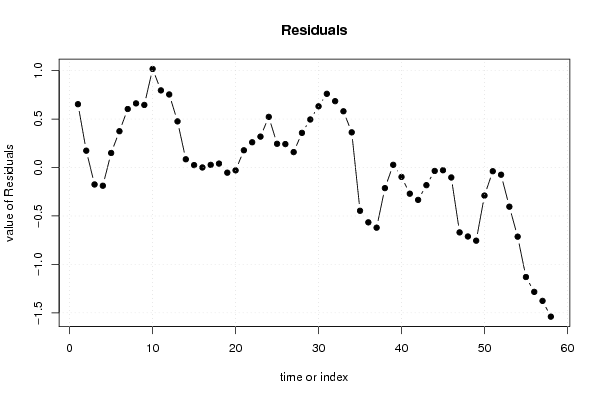
| Multiple Linear Regression - Actuals, Interpolation, and Residuals | |||
| Time or Index | Actuals | Interpolation Forecast | Residuals Prediction Error |
| 1 | 8.9 | 8.24609163959646 | 0.653908360403539 |
| 2 | 8.2 | 8.02609163959651 | 0.173908360403488 |
| 3 | 7.6 | 7.77469652932125 | -0.174696529321252 |
| 4 | 7.7 | 7.8878594631561 | -0.187859463156095 |
| 5 | 8.1 | 7.94962728671568 | 0.150372713284322 |
| 6 | 8.3 | 7.92506924260557 | 0.374930757394427 |
| 7 | 8.3 | 7.69595315438537 | 0.604046845614634 |
| 8 | 7.9 | 7.23772097794495 | 0.662279022055052 |
| 9 | 7.8 | 7.15367413233031 | 0.646325867669687 |
| 10 | 8 | 6.98227902205505 | 1.01772097794495 |
| 11 | 8.5 | 7.70348777568815 | 0.796512224311849 |
| 12 | 8.6 | 7.84558044110104 | 0.754419558898957 |
| 13 | 8.5 | 8.023301419046 | 0.476698580953996 |
| 14 | 8 | 7.91469652932125 | 0.085303470678748 |
| 15 | 7.8 | 7.77469652932125 | 0.0253034706787481 |
| 16 | 8 | 7.99925457343136 | 0.000745426568643112 |
| 17 | 8.2 | 8.1724175072662 | 0.0275824927337991 |
| 18 | 8.3 | 8.25925457343136 | 0.0407454265686433 |
| 19 | 8.2 | 8.25292870576167 | -0.0529287057616704 |
| 20 | 8.1 | 8.12888186014703 | -0.0288818601470353 |
| 21 | 8 | 7.82204479398188 | 0.177955206018122 |
| 22 | 7.8 | 7.53925457343136 | 0.260745426568643 |
| 23 | 7.8 | 7.48069755513763 | 0.319302444862369 |
| 24 | 7.7 | 7.17720977944948 | 0.522790220550521 |
| 25 | 7.6 | 7.35493075739444 | 0.245069242605561 |
| 26 | 7.6 | 7.35772097794495 | 0.242279022055052 |
| 27 | 7.6 | 7.44051119849547 | 0.159488801504530 |
| 28 | 7.8 | 7.44227902205505 | 0.357720977944947 |
| 29 | 8 | 7.50404684561463 | 0.495953154385366 |
| 30 | 8 | 7.36809369122927 | 0.63190630877073 |
| 31 | 7.9 | 7.13897760300906 | 0.761022396990939 |
| 32 | 7.7 | 7.01493075739443 | 0.685069242605574 |
| 33 | 7.4 | 6.81948880150453 | 0.580511198495469 |
| 34 | 6.9 | 6.53669858095401 | 0.363301419045992 |
| 35 | 6.7 | 7.14651222431185 | -0.446512224311848 |
| 36 | 6.5 | 7.06581466917422 | -0.565814669174218 |
| 37 | 6.4 | 7.02074542656866 | -0.620745426568656 |
| 38 | 6.7 | 6.9121405368439 | -0.212140536843905 |
| 39 | 6.8 | 6.7721405368439 | 0.0278594631560951 |
| 40 | 6.9 | 6.99669858095401 | -0.0966985809540086 |
| 41 | 6.9 | 7.16986151478885 | -0.269861514788852 |
| 42 | 6.7 | 7.03390836040349 | -0.333908360403487 |
| 43 | 6.4 | 6.58200205163276 | -0.182002051632756 |
| 44 | 6.2 | 6.2351649854676 | -0.0351649854676001 |
| 45 | 5.9 | 5.92832791930244 | -0.0283279193024429 |
| 46 | 6.1 | 6.20251325012823 | -0.102513250128226 |
| 47 | 6.7 | 7.36930244486237 | -0.66930244486237 |
| 48 | 6.8 | 7.51139511027526 | -0.711395110275261 |
| 49 | 6.6 | 7.35493075739444 | -0.75493075739444 |
| 50 | 6.4 | 6.68935031629338 | -0.289350316293383 |
| 51 | 6.4 | 6.43795520601812 | -0.0379552060181217 |
| 52 | 6.7 | 6.77390836040349 | -0.0739083604034868 |
| 53 | 7.1 | 7.50404684561463 | -0.404046845614634 |
| 54 | 7.1 | 7.81367413233031 | -0.713674132330314 |
| 55 | 6.9 | 8.03013848521115 | -1.13013848521115 |
| 56 | 6.4 | 7.68330141904599 | -1.28330141904599 |
| 57 | 6 | 7.37646435288084 | -1.37646435288083 |
| 58 | 6 | 7.53925457343136 | -1.53925457343136 |
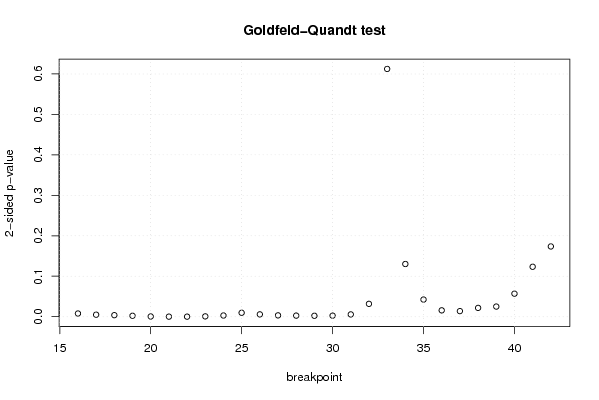
| Goldfeld-Quandt test for Heteroskedasticity | |||
| p-values | Alternative Hypothesis | ||
| breakpoint index | greater | 2-sided | less |
| 16 | 0.00395058939566930 | 0.00790117879133861 | 0.99604941060433 |
| 17 | 0.00245256530853358 | 0.00490513061706715 | 0.997547434691466 |
| 18 | 0.00188892963840830 | 0.00377785927681659 | 0.998111070361592 |
| 19 | 0.00114964360219061 | 0.00229928720438122 | 0.99885035639781 |
| 20 | 0.000265785222803165 | 0.000531570445606329 | 0.999734214777197 |
| 21 | 6.8353876962633e-05 | 0.000136707753925266 | 0.999931646123037 |
| 22 | 5.60455634651084e-05 | 0.000112091126930217 | 0.999943954436535 |
| 23 | 0.000418465177217027 | 0.000836930354434053 | 0.999581534822783 |
| 24 | 0.00147760403745991 | 0.00295520807491983 | 0.99852239596254 |
| 25 | 0.00485335790294763 | 0.00970671580589525 | 0.995146642097052 |
| 26 | 0.00288529163149753 | 0.00577058326299506 | 0.997114708368502 |
| 27 | 0.00166111903446521 | 0.00332223806893043 | 0.998338880965535 |
| 28 | 0.00134845291100804 | 0.00269690582201608 | 0.998651547088992 |
| 29 | 0.00114849919086624 | 0.00229699838173249 | 0.998851500809134 |
| 30 | 0.00129107921963813 | 0.00258215843927626 | 0.998708920780362 |
| 31 | 0.00282411205872169 | 0.00564822411744339 | 0.997175887941278 |
| 32 | 0.0158809336116152 | 0.0317618672232305 | 0.984119066388385 |
| 33 | 0.306196138163067 | 0.612392276326134 | 0.693803861836933 |
| 34 | 0.934866605282959 | 0.130266789434082 | 0.0651333947170411 |
| 35 | 0.978814291795049 | 0.0423714164099026 | 0.0211857082049513 |
| 36 | 0.992140001570517 | 0.0157199968589655 | 0.00785999842948273 |
| 37 | 0.99307678620953 | 0.0138464275809389 | 0.00692321379046943 |
| 38 | 0.989133500309537 | 0.0217329993809254 | 0.0108664996904627 |
| 39 | 0.987473532323877 | 0.0250529353522464 | 0.0125264676761232 |
| 40 | 0.971538060968684 | 0.0569238780626326 | 0.0284619390313163 |
| 41 | 0.938293431689656 | 0.123413136620689 | 0.0617065683103445 |
| 42 | 0.913185185636877 | 0.173629628726246 | 0.086814814363123 |
| Meta Analysis of Goldfeld-Quandt test for Heteroskedasticity | |||
| Description | # significant tests | % significant tests | OK/NOK |
| 1% type I error level | 16 | 0.592592592592593 | NOK |
| 5% type I error level | 22 | 0.814814814814815 | NOK |
| 10% type I error level | 23 | 0.851851851851852 | NOK |