| Multiple Linear Regression - Estimated Regression Equation |
| TWV[t] = + 5.07703772176254 + 0.167311170827881`WV-25`[t] + e[t] |
| Multiple Linear Regression - Ordinary Least Squares | |||||
| Variable | Parameter | S.D. | T-STAT H0: parameter = 0 | 2-tail p-value | 1-tail p-value |
| (Intercept) | 5.07703772176254 | 0.604195 | 8.403 | 0 | 0 |
| `WV-25` | 0.167311170827881 | 0.027892 | 5.9985 | 0 | 0 |
| Multiple Linear Regression - Regression Statistics | |
| Multiple R | 0.61875765303965 |
| R-squared | 0.382861033195136 |
| Adjusted R-squared | 0.372220706181259 |
| F-TEST (value) | 35.9820739245903 |
| F-TEST (DF numerator) | 1 |
| F-TEST (DF denominator) | 58 |
| p-value | 1.37071121231180e-07 |
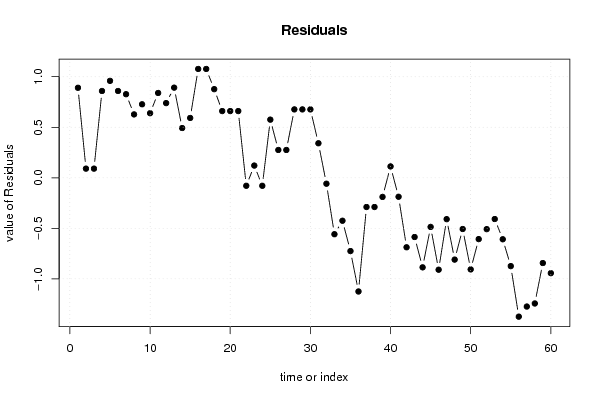
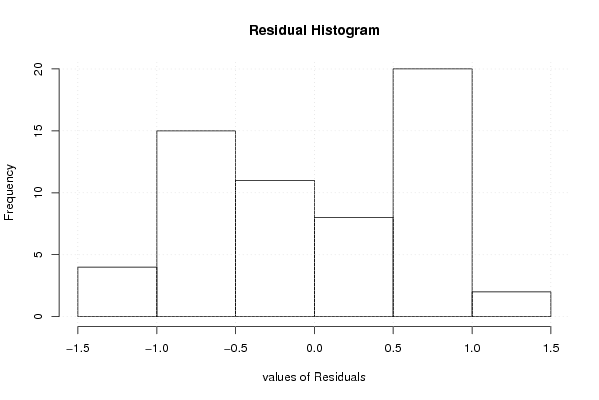
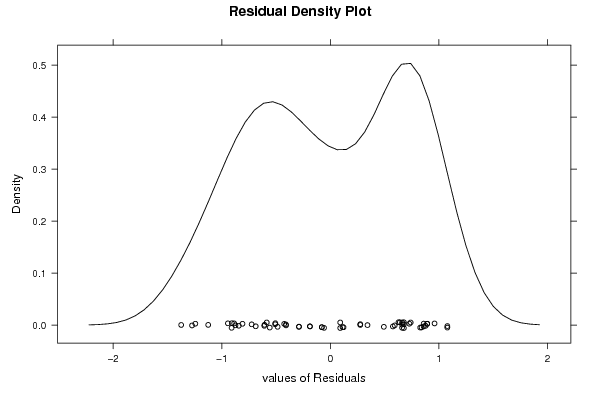
| Multiple Linear Regression - Residual Statistics | |
| Residual Standard Deviation | 0.718561573762164 |
| Sum Squared Residuals | 29.9471826466783 |
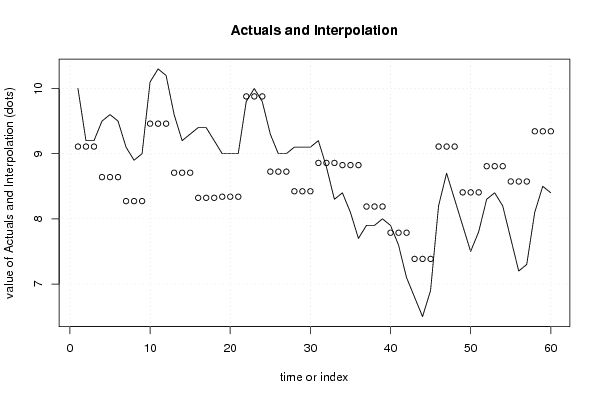
| Multiple Linear Regression - Actuals, Interpolation, and Residuals | |||
| Time or Index | Actuals | Interpolation Forecast | Residuals Prediction Error |
| 1 | 10 | 9.10923693871448 | 0.890763061285518 |
| 2 | 9.2 | 9.10923693871447 | 0.0907630612855271 |
| 3 | 9.2 | 9.10923693871447 | 0.0907630612855272 |
| 4 | 9.5 | 8.6407656603964 | 0.859234339603594 |
| 5 | 9.6 | 8.6407656603964 | 0.959234339603594 |
| 6 | 9.5 | 8.6407656603964 | 0.859234339603594 |
| 7 | 9.1 | 8.27268108457507 | 0.827318915424931 |
| 8 | 8.9 | 8.27268108457507 | 0.627318915424932 |
| 9 | 9 | 8.27268108457507 | 0.727318915424932 |
| 10 | 10.1 | 9.46059039745302 | 0.639409602546978 |
| 11 | 10.3 | 9.46059039745302 | 0.83940960254698 |
| 12 | 10.2 | 9.46059039745302 | 0.739409602546978 |
| 13 | 9.6 | 8.70769012872756 | 0.892309871272442 |
| 14 | 9.2 | 8.70769012872756 | 0.492309871272441 |
| 15 | 9.3 | 8.70769012872756 | 0.592309871272443 |
| 16 | 9.4 | 8.32287443582343 | 1.07712556417657 |
| 17 | 9.4 | 8.32287443582343 | 1.07712556417657 |
| 18 | 9.2 | 8.32287443582343 | 0.877125564176567 |
| 19 | 9 | 8.33960555290622 | 0.66039444709378 |
| 20 | 9 | 8.33960555290622 | 0.66039444709378 |
| 21 | 9 | 8.33960555290622 | 0.66039444709378 |
| 22 | 9.8 | 9.87886832452272 | -0.0788683245227226 |
| 23 | 10 | 9.87886832452272 | 0.121131675477277 |
| 24 | 9.8 | 9.87886832452272 | -0.0788683245227226 |
| 25 | 9.3 | 8.72442124581035 | 0.575578754189655 |
| 26 | 9 | 8.72442124581035 | 0.275578754189654 |
| 27 | 9 | 8.72442124581035 | 0.275578754189654 |
| 28 | 9.1 | 8.42326113832016 | 0.676738861679839 |
| 29 | 9.1 | 8.42326113832016 | 0.676738861679839 |
| 30 | 9.1 | 8.42326113832016 | 0.676738861679839 |
| 31 | 9.2 | 8.85827018247265 | 0.341729817527348 |
| 32 | 8.8 | 8.85827018247265 | -0.0582701824726502 |
| 33 | 8.3 | 8.85827018247265 | -0.55827018247265 |
| 34 | 8.4 | 8.82480794830707 | -0.424807948307074 |
| 35 | 8.1 | 8.82480794830707 | -0.724807948307075 |
| 36 | 7.7 | 8.82480794830707 | -1.12480794830707 |
| 37 | 7.9 | 8.18902549916113 | -0.289025499161128 |
| 38 | 7.9 | 8.18902549916113 | -0.289025499161128 |
| 39 | 8 | 8.18902549916113 | -0.189025499161128 |
| 40 | 7.9 | 7.78747868917421 | 0.112521310825787 |
| 41 | 7.6 | 7.78747868917421 | -0.187478689174214 |
| 42 | 7.1 | 7.78747868917421 | -0.687478689174214 |
| 43 | 6.8 | 7.3859318791873 | -0.5859318791873 |
| 44 | 6.5 | 7.3859318791873 | -0.8859318791873 |
| 45 | 6.9 | 7.3859318791873 | -0.4859318791873 |
| 46 | 8.2 | 9.10923693871447 | -0.909236938714473 |
| 47 | 8.7 | 9.10923693871447 | -0.409236938714473 |
| 48 | 8.3 | 9.10923693871447 | -0.809236938714471 |
| 49 | 7.9 | 8.40653002123737 | -0.506530021237372 |
| 50 | 7.5 | 8.40653002123737 | -0.906530021237372 |
| 51 | 7.8 | 8.40653002123737 | -0.606530021237373 |
| 52 | 8.3 | 8.80807683122429 | -0.508076831224286 |
| 53 | 8.4 | 8.80807683122429 | -0.408076831224286 |
| 54 | 8.2 | 8.80807683122429 | -0.608076831224287 |
| 55 | 7.7 | 8.57384119206525 | -0.873841192065253 |
| 56 | 7.2 | 8.57384119206525 | -1.37384119206525 |
| 57 | 7.3 | 8.57384119206525 | -1.27384119206525 |
| 58 | 8.1 | 9.3434725778735 | -1.24347257787351 |
| 59 | 8.5 | 9.3434725778735 | -0.843472577873505 |
| 60 | 8.4 | 9.3434725778735 | -0.943472577873505 |
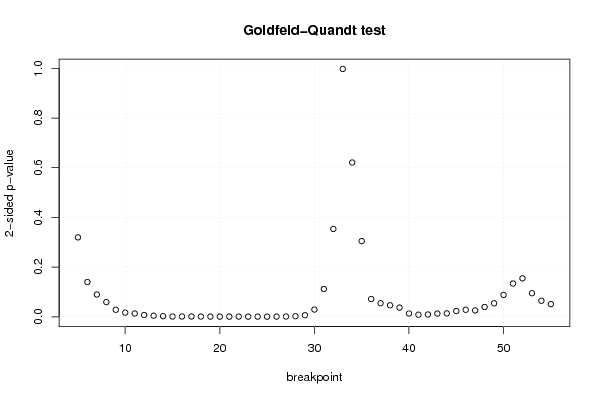
| Goldfeld-Quandt test for Heteroskedasticity | |||
| p-values | Alternative Hypothesis | ||
| breakpoint index | greater | 2-sided | less |
| 5 | 0.159856151945285 | 0.31971230389057 | 0.840143848054715 |
| 6 | 0.069858767362331 | 0.139717534724662 | 0.930141232637669 |
| 7 | 0.0448097963723201 | 0.0896195927446403 | 0.95519020362768 |
| 8 | 0.0295184941899799 | 0.0590369883799598 | 0.97048150581002 |
| 9 | 0.0140273828336618 | 0.0280547656673235 | 0.985972617166338 |
| 10 | 0.00828952786106344 | 0.0165790557221269 | 0.991710472138936 |
| 11 | 0.00652449736290181 | 0.0130489947258036 | 0.993475502637098 |
| 12 | 0.00352075650710921 | 0.00704151301421841 | 0.99647924349289 |
| 13 | 0.00208246409738692 | 0.00416492819477384 | 0.997917535902613 |
| 14 | 0.00116778348330789 | 0.00233556696661578 | 0.998832216516692 |
| 15 | 0.000570606446959266 | 0.00114121289391853 | 0.99942939355304 |
| 16 | 0.000596298128534271 | 0.00119259625706854 | 0.999403701871466 |
| 17 | 0.000627583001969954 | 0.00125516600393991 | 0.99937241699803 |
| 18 | 0.000442810562687505 | 0.00088562112537501 | 0.999557189437313 |
| 19 | 0.000324770960383537 | 0.000649541920767074 | 0.999675229039616 |
| 20 | 0.000254026980181643 | 0.000508053960363286 | 0.999745973019818 |
| 21 | 0.000218178031305413 | 0.000436356062610826 | 0.999781821968695 |
| 22 | 0.000348607614311321 | 0.000697215228622642 | 0.999651392385689 |
| 23 | 0.000228436816018343 | 0.000456873632036687 | 0.999771563183982 |
| 24 | 0.000200771575949356 | 0.000401543151898711 | 0.99979922842405 |
| 25 | 0.000215093057516629 | 0.000430186115033259 | 0.999784906942483 |
| 26 | 0.0003412365476452 | 0.0006824730952904 | 0.999658763452355 |
| 27 | 0.000537908289965125 | 0.00107581657993025 | 0.999462091710035 |
| 28 | 0.00105795037104097 | 0.00211590074208194 | 0.998942049628959 |
| 29 | 0.00304318500655735 | 0.0060863700131147 | 0.996956814993443 |
| 30 | 0.0145282261055030 | 0.0290564522110060 | 0.985471773894497 |
| 31 | 0.0558636250419303 | 0.111727250083861 | 0.94413637495807 |
| 32 | 0.176809053740353 | 0.353618107480706 | 0.823190946259647 |
| 33 | 0.501130162163331 | 0.997739675673338 | 0.498869837836669 |
| 34 | 0.68950398543488 | 0.620992029130241 | 0.310496014565120 |
| 35 | 0.847677707042682 | 0.304644585914637 | 0.152322292957318 |
| 36 | 0.964301591411243 | 0.0713968171775144 | 0.0356984085887572 |
| 37 | 0.972674835050568 | 0.0546503298988638 | 0.0273251649494319 |
| 38 | 0.976940551540387 | 0.0461188969192269 | 0.0230594484596134 |
| 39 | 0.981622333901713 | 0.0367553321965733 | 0.0183776660982867 |
| 40 | 0.993384519435009 | 0.0132309611299826 | 0.00661548056499132 |
| 41 | 0.995879801124786 | 0.00824039775042726 | 0.00412019887521363 |
| 42 | 0.995429840004792 | 0.0091403199904155 | 0.00457015999520775 |
| 43 | 0.993657662186737 | 0.0126846756265266 | 0.00634233781326328 |
| 44 | 0.993197849825754 | 0.0136043003484917 | 0.00680215017424583 |
| 45 | 0.988574472791862 | 0.022851054416276 | 0.011425527208138 |
| 46 | 0.98596474086228 | 0.0280705182754400 | 0.0140352591377200 |
| 47 | 0.987229541867143 | 0.0255409162657141 | 0.0127704581328571 |
| 48 | 0.980370309080798 | 0.0392593818384031 | 0.0196296909192015 |
| 49 | 0.972958465848075 | 0.0540830683038499 | 0.0270415341519250 |
| 50 | 0.95590557722223 | 0.088188845555539 | 0.0440944227777695 |
| 51 | 0.933083425587264 | 0.133833148825472 | 0.0669165744127361 |
| 52 | 0.922634230825406 | 0.154731538349189 | 0.0773657691745943 |
| 53 | 0.9526145984444 | 0.0947708031112017 | 0.0473854015556008 |
| 54 | 0.96784665785505 | 0.0643066842899002 | 0.0321533421449501 |
| 55 | 0.974647293997298 | 0.0507054120054047 | 0.0253527060027024 |
| Meta Analysis of Goldfeld-Quandt test for Heteroskedasticity | |||
| Description | # significant tests | % significant tests | OK/NOK |
| 1% type I error level | 20 | 0.392156862745098 | NOK |
| 5% type I error level | 33 | 0.647058823529412 | NOK |
| 10% type I error level | 42 | 0.823529411764706 | NOK |