| Multiple Linear Regression - Estimated Regression Equation |
| Y[t] = + 5.8031512605042 -0.412605042016806X[t] -0.000630252100846359M1[t] -0.100630252100840M2[t] -0.100630252100840M3[t] + 0.159369747899159M4[t] + 0.60189075630252M5[t] + 0.741890756302521M6[t] + 0.721890756302521M7[t] + 0.581890756302521M8[t] + 0.441890756302521M9[t] + 0.241890756302521M10[t] + 0.15M11[t] + e[t] |
| Multiple Linear Regression - Ordinary Least Squares | |||||
| Variable | Parameter | S.D. | T-STAT H0: parameter = 0 | 2-tail p-value | 1-tail p-value |
| (Intercept) | 5.8031512605042 | 0.234228 | 24.7756 | 0 | 0 |
| X | -0.412605042016806 | 0.134394 | -3.0701 | 0.003621 | 0.001811 |
| M1 | -0.000630252100846359 | 0.311073 | -0.002 | 0.998392 | 0.499196 |
| M2 | -0.100630252100840 | 0.311073 | -0.3235 | 0.74782 | 0.37391 |
| M3 | -0.100630252100840 | 0.311073 | -0.3235 | 0.74782 | 0.37391 |
| M4 | 0.159369747899159 | 0.311073 | 0.5123 | 0.61093 | 0.305465 |
| M5 | 0.60189075630252 | 0.311653 | 1.9313 | 0.059761 | 0.02988 |
| M6 | 0.741890756302521 | 0.311653 | 2.3805 | 0.021584 | 0.010792 |
| M7 | 0.721890756302521 | 0.311653 | 2.3163 | 0.025152 | 0.012576 |
| M8 | 0.581890756302521 | 0.311653 | 1.8671 | 0.068408 | 0.034204 |
| M9 | 0.441890756302521 | 0.311653 | 1.4179 | 0.16311 | 0.081555 |
| M10 | 0.241890756302521 | 0.311653 | 0.7762 | 0.441718 | 0.220859 |
| M11 | 0.15 | 0.327823 | 0.4576 | 0.649467 | 0.324734 |
| Multiple Linear Regression - Regression Statistics | |
| Multiple R | 0.629006732730117 |
| R-squared | 0.395649469819817 |
| Adjusted R-squared | 0.234489328438435 |
| F-TEST (value) | 2.45500820754135 |
| F-TEST (DF numerator) | 12 |
| F-TEST (DF denominator) | 45 |
| p-value | 0.0147483021027165 |
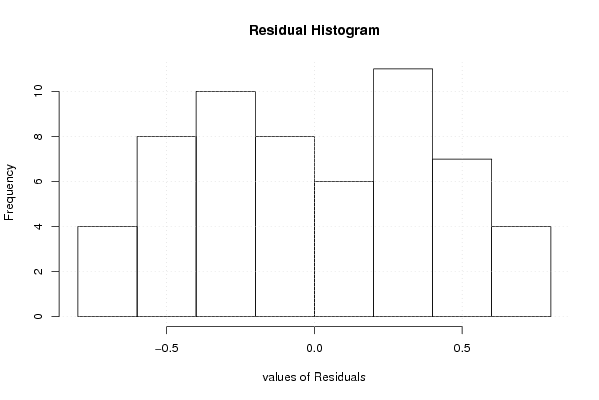
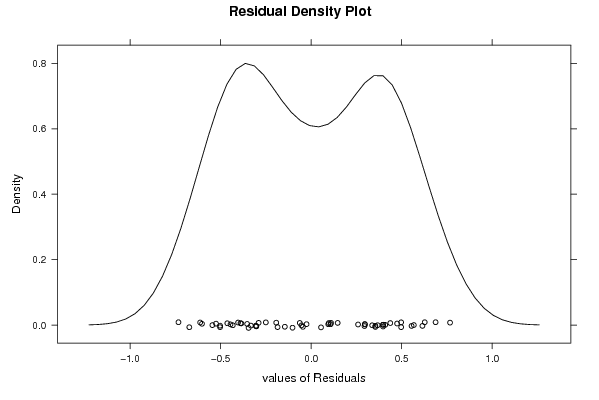
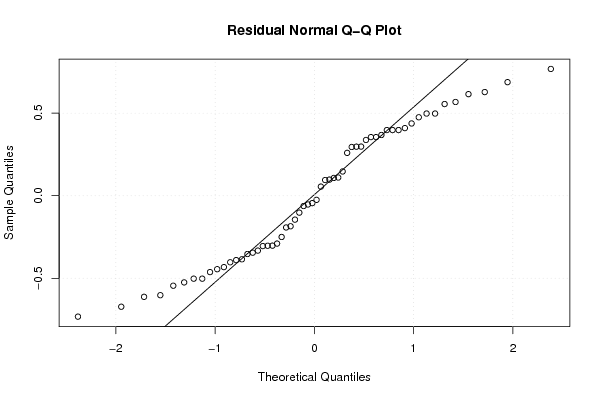
| Multiple Linear Regression - Residual Statistics | |
| Residual Standard Deviation | 0.463611648873337 |
| Sum Squared Residuals | 9.67210924369745 |
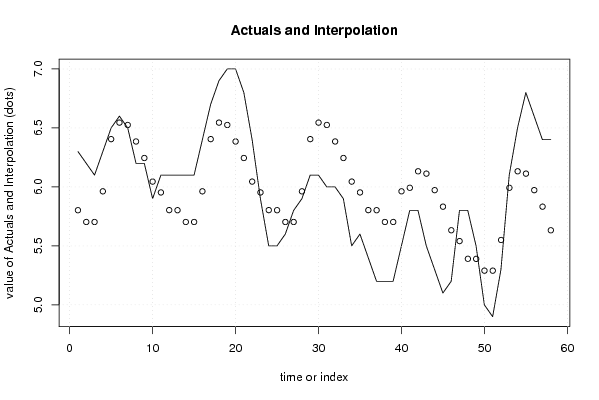
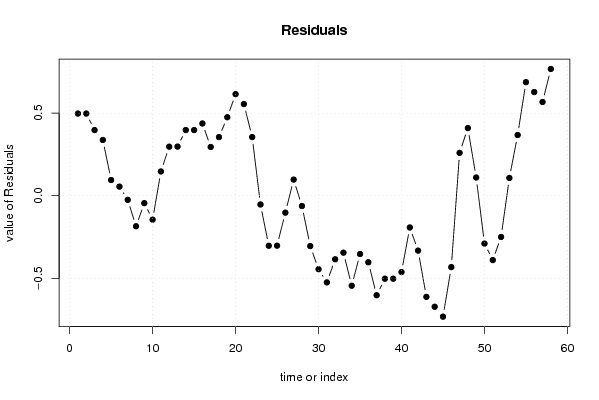
| Multiple Linear Regression - Actuals, Interpolation, and Residuals | |||
| Time or Index | Actuals | Interpolation Forecast | Residuals Prediction Error |
| 1 | 6.3 | 5.80252100840339 | 0.497478991596615 |
| 2 | 6.2 | 5.70252100840336 | 0.497478991596639 |
| 3 | 6.1 | 5.70252100840336 | 0.397478991596638 |
| 4 | 6.3 | 5.96252100840336 | 0.337478991596638 |
| 5 | 6.5 | 6.40504201680672 | 0.0949579831932773 |
| 6 | 6.6 | 6.54504201680672 | 0.0549579831932784 |
| 7 | 6.5 | 6.52504201680672 | -0.0250420168067217 |
| 8 | 6.2 | 6.38504201680672 | -0.185042016806723 |
| 9 | 6.2 | 6.24504201680672 | -0.0450420168067223 |
| 10 | 5.9 | 6.04504201680672 | -0.145042016806723 |
| 11 | 6.1 | 5.9531512605042 | 0.146848739495799 |
| 12 | 6.1 | 5.8031512605042 | 0.296848739495798 |
| 13 | 6.1 | 5.80252100840335 | 0.297478991596645 |
| 14 | 6.1 | 5.70252100840336 | 0.397478991596639 |
| 15 | 6.1 | 5.70252100840336 | 0.397478991596639 |
| 16 | 6.4 | 5.96252100840336 | 0.437478991596639 |
| 17 | 6.7 | 6.40504201680672 | 0.294957983193278 |
| 18 | 6.9 | 6.54504201680672 | 0.354957983193278 |
| 19 | 7 | 6.52504201680672 | 0.474957983193277 |
| 20 | 7 | 6.38504201680672 | 0.614957983193277 |
| 21 | 6.8 | 6.24504201680672 | 0.554957983193277 |
| 22 | 6.4 | 6.04504201680672 | 0.354957983193278 |
| 23 | 5.9 | 5.9531512605042 | -0.0531512605042011 |
| 24 | 5.5 | 5.8031512605042 | -0.303151260504202 |
| 25 | 5.5 | 5.80252100840335 | -0.302521008403355 |
| 26 | 5.6 | 5.70252100840336 | -0.102521008403362 |
| 27 | 5.8 | 5.70252100840336 | 0.0974789915966388 |
| 28 | 5.9 | 5.96252100840336 | -0.0625210084033609 |
| 29 | 6.1 | 6.40504201680672 | -0.305042016806723 |
| 30 | 6.1 | 6.54504201680672 | -0.445042016806723 |
| 31 | 6 | 6.52504201680672 | -0.525042016806723 |
| 32 | 6 | 6.38504201680672 | -0.385042016806722 |
| 33 | 5.9 | 6.24504201680672 | -0.345042016806722 |
| 34 | 5.5 | 6.04504201680672 | -0.545042016806723 |
| 35 | 5.6 | 5.9531512605042 | -0.353151260504202 |
| 36 | 5.4 | 5.8031512605042 | -0.403151260504201 |
| 37 | 5.2 | 5.80252100840335 | -0.602521008403355 |
| 38 | 5.2 | 5.70252100840336 | -0.502521008403361 |
| 39 | 5.2 | 5.70252100840336 | -0.502521008403361 |
| 40 | 5.5 | 5.96252100840336 | -0.462521008403361 |
| 41 | 5.8 | 5.99243697478992 | -0.192436974789916 |
| 42 | 5.8 | 6.13243697478992 | -0.332436974789916 |
| 43 | 5.5 | 6.11243697478992 | -0.612436974789917 |
| 44 | 5.3 | 5.97243697478992 | -0.672436974789916 |
| 45 | 5.1 | 5.83243697478992 | -0.732436974789917 |
| 46 | 5.2 | 5.63243697478992 | -0.432436974789916 |
| 47 | 5.8 | 5.5405462184874 | 0.259453781512605 |
| 48 | 5.8 | 5.3905462184874 | 0.409453781512605 |
| 49 | 5.5 | 5.38991596638655 | 0.110084033613451 |
| 50 | 5 | 5.28991596638655 | -0.289915966386555 |
| 51 | 4.9 | 5.28991596638655 | -0.389915966386555 |
| 52 | 5.3 | 5.54991596638656 | -0.249915966386555 |
| 53 | 6.1 | 5.99243697478992 | 0.107563025210084 |
| 54 | 6.5 | 6.13243697478992 | 0.367563025210084 |
| 55 | 6.8 | 6.11243697478992 | 0.687563025210083 |
| 56 | 6.6 | 5.97243697478992 | 0.627563025210084 |
| 57 | 6.4 | 5.83243697478992 | 0.567563025210084 |
| 58 | 6.4 | 5.63243697478992 | 0.767563025210084 |
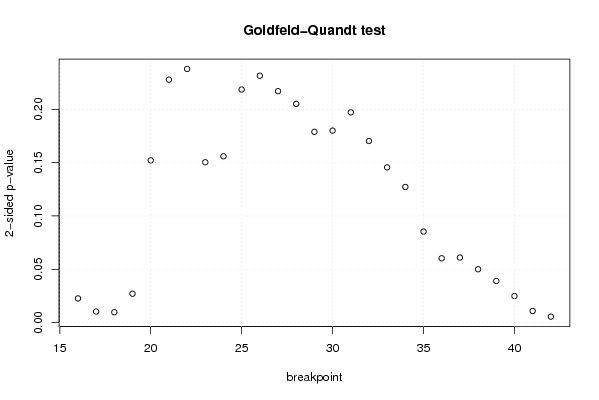
| Goldfeld-Quandt test for Heteroskedasticity | |||
| p-values | Alternative Hypothesis | ||
| breakpoint index | greater | 2-sided | less |
| 16 | 0.0113208333279507 | 0.0226416666559015 | 0.98867916667205 |
| 17 | 0.00514789252480899 | 0.0102957850496180 | 0.99485210747519 |
| 18 | 0.0048484102494393 | 0.0096968204988786 | 0.99515158975056 |
| 19 | 0.0135235781977798 | 0.0270471563955597 | 0.98647642180222 |
| 20 | 0.076096461457403 | 0.152192922914806 | 0.923903538542597 |
| 21 | 0.113985444267235 | 0.227970888534471 | 0.886014555732765 |
| 22 | 0.119010148954997 | 0.238020297909994 | 0.880989851045003 |
| 23 | 0.0752108253957213 | 0.150421650791443 | 0.924789174604279 |
| 24 | 0.0780240226420835 | 0.156048045284167 | 0.921975977357916 |
| 25 | 0.109359207322238 | 0.218718414644476 | 0.890640792677762 |
| 26 | 0.115828281216412 | 0.231656562432825 | 0.884171718783588 |
| 27 | 0.108578588816481 | 0.217157177632962 | 0.89142141118352 |
| 28 | 0.102628231863816 | 0.205256463727633 | 0.897371768136184 |
| 29 | 0.0894971269811349 | 0.178994253962270 | 0.910502873018865 |
| 30 | 0.0900666210755518 | 0.180133242151104 | 0.909933378924448 |
| 31 | 0.0986350239449495 | 0.197270047889899 | 0.90136497605505 |
| 32 | 0.0851840540951067 | 0.170368108190213 | 0.914815945904893 |
| 33 | 0.0728102313600826 | 0.145620462720165 | 0.927189768639917 |
| 34 | 0.0636287028919842 | 0.127257405783968 | 0.936371297108016 |
| 35 | 0.0426816668862187 | 0.0853633337724375 | 0.957318333113781 |
| 36 | 0.0301515636260804 | 0.0603031272521607 | 0.96984843637392 |
| 37 | 0.0304947019525504 | 0.0609894039051008 | 0.96950529804745 |
| 38 | 0.0249852828126665 | 0.0499705656253331 | 0.975014717187333 |
| 39 | 0.0194985557459480 | 0.0389971114918959 | 0.980501444254052 |
| 40 | 0.0124343851147607 | 0.0248687702295214 | 0.98756561488524 |
| 41 | 0.00540532709661672 | 0.0108106541932334 | 0.994594672903383 |
| 42 | 0.0027555012217546 | 0.0055110024435092 | 0.997244498778245 |
| Meta Analysis of Goldfeld-Quandt test for Heteroskedasticity | |||
| Description | # significant tests | % significant tests | OK/NOK |
| 1% type I error level | 2 | 0.0740740740740741 | NOK |
| 5% type I error level | 9 | 0.333333333333333 | NOK |
| 10% type I error level | 12 | 0.444444444444444 | NOK |