Free Statistics

of Irreproducible Research!

Author's title

Author*The author of this computation has been verified*
R Software Modulerwasp_multipleregression.wasp
Title produced by softwareMultiple Regression
Date of computationThu, 19 Nov 2009 13:32:12 -0700
Cite this page as followsStatistical Computations at FreeStatistics.org, Office for Research Development and Education, URL https://freestatistics.org/blog/index.php?v=date/2009/Nov/19/t1258662899a6dlsjc9dugmhjf.htm/, Retrieved Sat, 20 Apr 2024 10:08:19 +0000
Statistical Computations at FreeStatistics.org, Office for Research Development and Education, URL https://freestatistics.org/blog/index.php?pk=57939, Retrieved Sat, 20 Apr 2024 10:08:19 +0000
QR Codes:

Original text written by user:
IsPrivate?No (this computation is public)
User-defined keywords
Estimated Impact173
Family? (F = Feedback message, R = changed R code, M = changed R Module, P = changed Parameters, D = changed Data)
-     [Multiple Regression] [Q1 The Seatbeltlaw] [2007-11-14 19:27:43] [8cd6641b921d30ebe00b648d1481bba0]
- RM D  [Multiple Regression] [Seatbelt] [2009-11-12 14:10:54] [b98453cac15ba1066b407e146608df68]
F R PD      [Multiple Regression] [Model 1] [2009-11-19 20:32:12] [d5837f25ec8937f9733a894c487f865c] [Current]
F    D        [Multiple Regression] [Model 2] [2009-11-19 20:38:54] [c0117c881d5fcd069841276db0c34efe]
-               [Multiple Regression] [Model 3] [2009-11-19 20:41:09] [c0117c881d5fcd069841276db0c34efe]
-    D            [Multiple Regression] [Model 4] [2009-11-19 20:47:35] [c0117c881d5fcd069841276db0c34efe]
-   PD              [Multiple Regression] [Model 5] [2009-11-20 15:42:18] [c0117c881d5fcd069841276db0c34efe]
Feedback Forum
2009-11-21 08:22:34 [] [reply
de adjusted R²square is 63%, wat betekent dat dit model 63% verklaart van de spreiding van de variabele, maw 63% wordt verklaard door de verandering van de rentevoet.

Post a new message
Dataseries X:
3	101.2
3.21	101.1
3.37	100.7
3.51	100.1
3.75	99.9
4.11	99.7
4.25	99.5
4.25	99.2
4.5	99
4.7	99
4.75	99.3
4.75	99.5
4.75	99.7
4.75	100
4.75	100.4
4.75	100.6
4.58	100.7
4.5	100.7
4.5	100.6
4.49	100.5
4.03	100.6
3.75	100.5
3.39	100.4
3.25	100.3
3.25	100.4
3.25	100.4
3.25	100.4
3.25	100.4
3.25	100.4
3.25	100.5
3.25	100.6
3.25	100.6
3.25	100.5
3.25	100.5
3.25	100.7
2.85	101.1
2.75	101.5
2.75	101.9
2.55	102.1
2.5	102.1
2.5	102.1
2.1	102.4
2	102.8
2	103.1
2	103.1
2	102.9
2	102.4
2	101.9
2	101.3
2	100.7
2	100.6
2	101
2	101.5
2	101.9
2	102.1
2	102.3
2	102.5
2	102.9
2	103.6
2	104.3


Summary of computational transaction
Raw Inputview raw input (R code)
Raw Outputview raw output of R engine
Computing time3 seconds
R Server'Gwilym Jenkins' @ 72.249.127.135

\begin{tabular}{lllllllll}
\hline
Summary of computational transaction \tabularnewline
Raw Input & view raw input (R code)  \tabularnewline
Raw Output & view raw output of R engine  \tabularnewline
Computing time & 3 seconds \tabularnewline
R Server & 'Gwilym Jenkins' @ 72.249.127.135 \tabularnewline
\hline
\end{tabular}
%Source: https://freestatistics.org/blog/index.php?pk=57939&T=0

[TABLE]
[ROW][C]Summary of computational transaction[/C][/ROW]
[ROW][C]Raw Input[/C][C]view raw input (R code) [/C][/ROW]
[ROW][C]Raw Output[/C][C]view raw output of R engine [/C][/ROW]
[ROW][C]Computing time[/C][C]3 seconds[/C][/ROW]
[ROW][C]R Server[/C][C]'Gwilym Jenkins' @ 72.249.127.135[/C][/ROW]
[/TABLE]
Source: https://freestatistics.org/blog/index.php?pk=57939&T=0

Globally Unique Identifier (entire table): ba.freestatistics.org/blog/index.php?pk=57939&T=0

As an alternative you can also use a QR Code:  

The GUIDs for individual cells are displayed in the table below:

Summary of computational transaction
Raw Inputview raw input (R code)
Raw Outputview raw output of R engine
Computing time3 seconds
R Server'Gwilym Jenkins' @ 72.249.127.135


Multiple Linear Regression - Estimated Regression Equation
Tprod[t] = + 104.057458254309 -0.954366625790823Rente[t] + e[t]

\begin{tabular}{lllllllll}
\hline
Multiple Linear Regression - Estimated Regression Equation \tabularnewline
Tprod[t] =  +  104.057458254309 -0.954366625790823Rente[t]  + e[t] \tabularnewline
\hline
\end{tabular}
%Source: https://freestatistics.org/blog/index.php?pk=57939&T=1

[TABLE]
[ROW][C]Multiple Linear Regression - Estimated Regression Equation[/C][/ROW]
[ROW][C]Tprod[t] =  +  104.057458254309 -0.954366625790823Rente[t]  + e[t][/C][/ROW]
[/TABLE]
Source: https://freestatistics.org/blog/index.php?pk=57939&T=1

Globally Unique Identifier (entire table): ba.freestatistics.org/blog/index.php?pk=57939&T=1

As an alternative you can also use a QR Code:  

The GUIDs for individual cells are displayed in the table below:

Multiple Linear Regression - Estimated Regression Equation
Tprod[t] = + 104.057458254309 -0.954366625790823Rente[t] + e[t]


Multiple Linear Regression - Ordinary Least Squares
VariableParameterS.D.T-STATH0: parameter = 02-tail p-value1-tail p-value
(Intercept)104.0574582543090.308823336.948600
Rente-0.9543666257908230.093353-10.223200

\begin{tabular}{lllllllll}
\hline
Multiple Linear Regression - Ordinary Least Squares \tabularnewline
Variable & Parameter & S.D. & T-STATH0: parameter = 0 & 2-tail p-value & 1-tail p-value \tabularnewline
(Intercept) & 104.057458254309 & 0.308823 & 336.9486 & 0 & 0 \tabularnewline
Rente & -0.954366625790823 & 0.093353 & -10.2232 & 0 & 0 \tabularnewline
\hline
\end{tabular}
%Source: https://freestatistics.org/blog/index.php?pk=57939&T=2

[TABLE]
[ROW][C]Multiple Linear Regression - Ordinary Least Squares[/C][/ROW]
[ROW][C]Variable[/C][C]Parameter[/C][C]S.D.[/C][C]T-STATH0: parameter = 0[/C][C]2-tail p-value[/C][C]1-tail p-value[/C][/ROW]
[ROW][C](Intercept)[/C][C]104.057458254309[/C][C]0.308823[/C][C]336.9486[/C][C]0[/C][C]0[/C][/ROW]
[ROW][C]Rente[/C][C]-0.954366625790823[/C][C]0.093353[/C][C]-10.2232[/C][C]0[/C][C]0[/C][/ROW]
[/TABLE]
Source: https://freestatistics.org/blog/index.php?pk=57939&T=2

Globally Unique Identifier (entire table): ba.freestatistics.org/blog/index.php?pk=57939&T=2

As an alternative you can also use a QR Code:  

The GUIDs for individual cells are displayed in the table below:

Multiple Linear Regression - Ordinary Least Squares
VariableParameterS.D.T-STATH0: parameter = 02-tail p-value1-tail p-value
(Intercept)104.0574582543090.308823336.948600
Rente-0.9543666257908230.093353-10.223200


Multiple Linear Regression - Regression Statistics
Multiple R0.801939374471285
R-squared0.643106760327396
Adjusted R-squared0.636953428608903
F-TEST (value)104.513585444225
F-TEST (DF numerator)1
F-TEST (DF denominator)58
p-value1.35447209004269e-14
Multiple Linear Regression - Residual Statistics
Residual Standard Deviation0.715892288571204
Sum Squared Residuals29.7251025924716

\begin{tabular}{lllllllll}
\hline
Multiple Linear Regression - Regression Statistics \tabularnewline
Multiple R & 0.801939374471285 \tabularnewline
R-squared & 0.643106760327396 \tabularnewline
Adjusted R-squared & 0.636953428608903 \tabularnewline
F-TEST (value) & 104.513585444225 \tabularnewline
F-TEST (DF numerator) & 1 \tabularnewline
F-TEST (DF denominator) & 58 \tabularnewline
p-value & 1.35447209004269e-14 \tabularnewline
Multiple Linear Regression - Residual Statistics \tabularnewline
Residual Standard Deviation & 0.715892288571204 \tabularnewline
Sum Squared Residuals & 29.7251025924716 \tabularnewline
\hline
\end{tabular}
%Source: https://freestatistics.org/blog/index.php?pk=57939&T=3

[TABLE]
[ROW][C]Multiple Linear Regression - Regression Statistics[/C][/ROW]
[ROW][C]Multiple R[/C][C]0.801939374471285[/C][/ROW]
[ROW][C]R-squared[/C][C]0.643106760327396[/C][/ROW]
[ROW][C]Adjusted R-squared[/C][C]0.636953428608903[/C][/ROW]
[ROW][C]F-TEST (value)[/C][C]104.513585444225[/C][/ROW]
[ROW][C]F-TEST (DF numerator)[/C][C]1[/C][/ROW]
[ROW][C]F-TEST (DF denominator)[/C][C]58[/C][/ROW]
[ROW][C]p-value[/C][C]1.35447209004269e-14[/C][/ROW]
[ROW][C]Multiple Linear Regression - Residual Statistics[/C][/ROW]
[ROW][C]Residual Standard Deviation[/C][C]0.715892288571204[/C][/ROW]
[ROW][C]Sum Squared Residuals[/C][C]29.7251025924716[/C][/ROW]
[/TABLE]
Source: https://freestatistics.org/blog/index.php?pk=57939&T=3

Globally Unique Identifier (entire table): ba.freestatistics.org/blog/index.php?pk=57939&T=3

As an alternative you can also use a QR Code:  

The GUIDs for individual cells are displayed in the table below:

Multiple Linear Regression - Regression Statistics
Multiple R0.801939374471285
R-squared0.643106760327396
Adjusted R-squared0.636953428608903
F-TEST (value)104.513585444225
F-TEST (DF numerator)1
F-TEST (DF denominator)58
p-value1.35447209004269e-14
Multiple Linear Regression - Residual Statistics
Residual Standard Deviation0.715892288571204
Sum Squared Residuals29.7251025924716


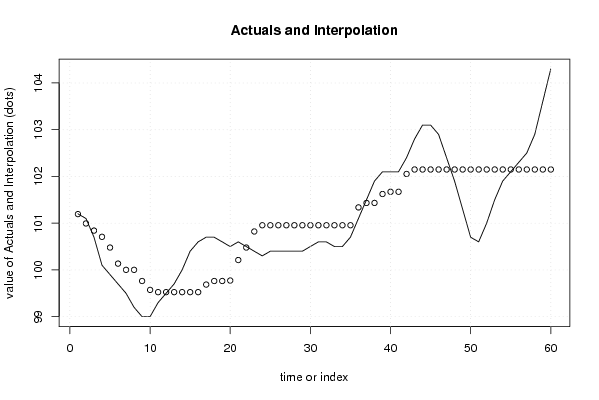
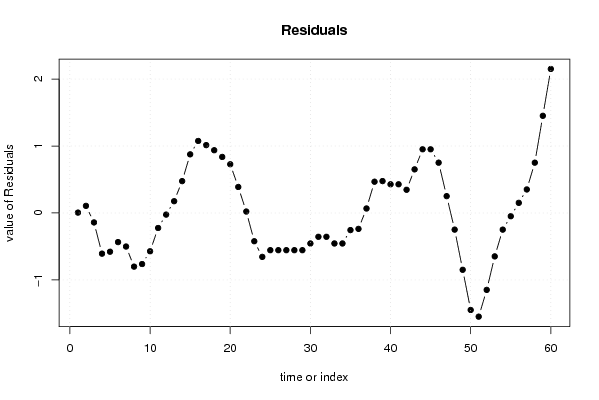
Multiple Linear Regression - Actuals, Interpolation, and Residuals
Time or IndexActualsInterpolationForecastResidualsPrediction Error
1101.2101.1943583769370.00564162306336613
2101.1100.9939413855200.106058614479800
3100.7100.841242725394-0.14124272539365
4100.1100.707631397783-0.607631397782944
599.9100.478583407593-0.578583407593135
699.7100.135011422308-0.435011422308442
799.5100.001400094698-0.50140009469773
899.2100.001400094698-0.801400094697727
99999.76280843825-0.762808438250024
109999.5719351130919-0.571935113091859
1199.399.5242167818023-0.224216781802321
1299.599.5242167818023-0.0242167818023186
1399.799.52421678180230.175783218197684
1410099.52421678180230.475783218197681
15100.499.52421678180230.875783218197687
16100.699.52421678180231.07578321819768
17100.799.68645910818681.01354089181324
18100.799.762808438250.937191561749979
19100.699.762808438250.83719156174997
20100.599.7723521045080.727647895492068
21100.6100.2113607523720.388639247628284
22100.5100.4785834075930.0214165924068594
23100.4100.822155392878-0.422155392877831
24100.3100.955766720489-0.655766720488555
25100.4100.955766720489-0.555766720488546
26100.4100.955766720489-0.555766720488546
27100.4100.955766720489-0.555766720488546
28100.4100.955766720489-0.555766720488546
29100.4100.955766720489-0.555766720488546
30100.5100.955766720489-0.455766720488552
31100.6100.955766720489-0.355766720488557
32100.6100.955766720489-0.355766720488557
33100.5100.955766720489-0.455766720488552
34100.5100.955766720489-0.455766720488552
35100.7100.955766720489-0.255766720488549
36101.1101.337513370805-0.237513370804886
37101.5101.4329500333840.0670499666160373
38101.9101.4329500333840.467049966616043
39102.1101.6238233585420.476176641457867
40102.1101.6715416898320.428458310168326
41102.1101.6715416898320.428458310168326
42102.4102.0532883401480.346711659852009
43102.8102.1487250027270.651274997272918
44103.1102.1487250027270.951274997272915
45103.1102.1487250027270.951274997272915
46102.9102.1487250027270.751274997272926
47102.4102.1487250027270.251274997272926
48101.9102.148725002727-0.248725002727074
49101.3102.148725002727-0.848725002727082
50100.7102.148725002727-1.44872500272708
51100.6102.148725002727-1.54872500272709
52101102.148725002727-1.14872500272708
53101.5102.148725002727-0.648725002727079
54101.9102.148725002727-0.248725002727074
55102.1102.148725002727-0.048725002727085
56102.3102.1487250027270.151274997272918
57102.5102.1487250027270.351274997272921
58102.9102.1487250027270.751274997272926
59103.6102.1487250027271.45127499727291
60104.3102.1487250027272.15127499727292

\begin{tabular}{lllllllll}
\hline
Multiple Linear Regression - Actuals, Interpolation, and Residuals \tabularnewline
Time or Index & Actuals & InterpolationForecast & ResidualsPrediction Error \tabularnewline
1 & 101.2 & 101.194358376937 & 0.00564162306336613 \tabularnewline
2 & 101.1 & 100.993941385520 & 0.106058614479800 \tabularnewline
3 & 100.7 & 100.841242725394 & -0.14124272539365 \tabularnewline
4 & 100.1 & 100.707631397783 & -0.607631397782944 \tabularnewline
5 & 99.9 & 100.478583407593 & -0.578583407593135 \tabularnewline
6 & 99.7 & 100.135011422308 & -0.435011422308442 \tabularnewline
7 & 99.5 & 100.001400094698 & -0.50140009469773 \tabularnewline
8 & 99.2 & 100.001400094698 & -0.801400094697727 \tabularnewline
9 & 99 & 99.76280843825 & -0.762808438250024 \tabularnewline
10 & 99 & 99.5719351130919 & -0.571935113091859 \tabularnewline
11 & 99.3 & 99.5242167818023 & -0.224216781802321 \tabularnewline
12 & 99.5 & 99.5242167818023 & -0.0242167818023186 \tabularnewline
13 & 99.7 & 99.5242167818023 & 0.175783218197684 \tabularnewline
14 & 100 & 99.5242167818023 & 0.475783218197681 \tabularnewline
15 & 100.4 & 99.5242167818023 & 0.875783218197687 \tabularnewline
16 & 100.6 & 99.5242167818023 & 1.07578321819768 \tabularnewline
17 & 100.7 & 99.6864591081868 & 1.01354089181324 \tabularnewline
18 & 100.7 & 99.76280843825 & 0.937191561749979 \tabularnewline
19 & 100.6 & 99.76280843825 & 0.83719156174997 \tabularnewline
20 & 100.5 & 99.772352104508 & 0.727647895492068 \tabularnewline
21 & 100.6 & 100.211360752372 & 0.388639247628284 \tabularnewline
22 & 100.5 & 100.478583407593 & 0.0214165924068594 \tabularnewline
23 & 100.4 & 100.822155392878 & -0.422155392877831 \tabularnewline
24 & 100.3 & 100.955766720489 & -0.655766720488555 \tabularnewline
25 & 100.4 & 100.955766720489 & -0.555766720488546 \tabularnewline
26 & 100.4 & 100.955766720489 & -0.555766720488546 \tabularnewline
27 & 100.4 & 100.955766720489 & -0.555766720488546 \tabularnewline
28 & 100.4 & 100.955766720489 & -0.555766720488546 \tabularnewline
29 & 100.4 & 100.955766720489 & -0.555766720488546 \tabularnewline
30 & 100.5 & 100.955766720489 & -0.455766720488552 \tabularnewline
31 & 100.6 & 100.955766720489 & -0.355766720488557 \tabularnewline
32 & 100.6 & 100.955766720489 & -0.355766720488557 \tabularnewline
33 & 100.5 & 100.955766720489 & -0.455766720488552 \tabularnewline
34 & 100.5 & 100.955766720489 & -0.455766720488552 \tabularnewline
35 & 100.7 & 100.955766720489 & -0.255766720488549 \tabularnewline
36 & 101.1 & 101.337513370805 & -0.237513370804886 \tabularnewline
37 & 101.5 & 101.432950033384 & 0.0670499666160373 \tabularnewline
38 & 101.9 & 101.432950033384 & 0.467049966616043 \tabularnewline
39 & 102.1 & 101.623823358542 & 0.476176641457867 \tabularnewline
40 & 102.1 & 101.671541689832 & 0.428458310168326 \tabularnewline
41 & 102.1 & 101.671541689832 & 0.428458310168326 \tabularnewline
42 & 102.4 & 102.053288340148 & 0.346711659852009 \tabularnewline
43 & 102.8 & 102.148725002727 & 0.651274997272918 \tabularnewline
44 & 103.1 & 102.148725002727 & 0.951274997272915 \tabularnewline
45 & 103.1 & 102.148725002727 & 0.951274997272915 \tabularnewline
46 & 102.9 & 102.148725002727 & 0.751274997272926 \tabularnewline
47 & 102.4 & 102.148725002727 & 0.251274997272926 \tabularnewline
48 & 101.9 & 102.148725002727 & -0.248725002727074 \tabularnewline
49 & 101.3 & 102.148725002727 & -0.848725002727082 \tabularnewline
50 & 100.7 & 102.148725002727 & -1.44872500272708 \tabularnewline
51 & 100.6 & 102.148725002727 & -1.54872500272709 \tabularnewline
52 & 101 & 102.148725002727 & -1.14872500272708 \tabularnewline
53 & 101.5 & 102.148725002727 & -0.648725002727079 \tabularnewline
54 & 101.9 & 102.148725002727 & -0.248725002727074 \tabularnewline
55 & 102.1 & 102.148725002727 & -0.048725002727085 \tabularnewline
56 & 102.3 & 102.148725002727 & 0.151274997272918 \tabularnewline
57 & 102.5 & 102.148725002727 & 0.351274997272921 \tabularnewline
58 & 102.9 & 102.148725002727 & 0.751274997272926 \tabularnewline
59 & 103.6 & 102.148725002727 & 1.45127499727291 \tabularnewline
60 & 104.3 & 102.148725002727 & 2.15127499727292 \tabularnewline
\hline
\end{tabular}
%Source: https://freestatistics.org/blog/index.php?pk=57939&T=4

[TABLE]
[ROW][C]Multiple Linear Regression - Actuals, Interpolation, and Residuals[/C][/ROW]
[ROW][C]Time or Index[/C][C]Actuals[/C][C]InterpolationForecast[/C][C]ResidualsPrediction Error[/C][/ROW]
[ROW][C]1[/C][C]101.2[/C][C]101.194358376937[/C][C]0.00564162306336613[/C][/ROW]
[ROW][C]2[/C][C]101.1[/C][C]100.993941385520[/C][C]0.106058614479800[/C][/ROW]
[ROW][C]3[/C][C]100.7[/C][C]100.841242725394[/C][C]-0.14124272539365[/C][/ROW]
[ROW][C]4[/C][C]100.1[/C][C]100.707631397783[/C][C]-0.607631397782944[/C][/ROW]
[ROW][C]5[/C][C]99.9[/C][C]100.478583407593[/C][C]-0.578583407593135[/C][/ROW]
[ROW][C]6[/C][C]99.7[/C][C]100.135011422308[/C][C]-0.435011422308442[/C][/ROW]
[ROW][C]7[/C][C]99.5[/C][C]100.001400094698[/C][C]-0.50140009469773[/C][/ROW]
[ROW][C]8[/C][C]99.2[/C][C]100.001400094698[/C][C]-0.801400094697727[/C][/ROW]
[ROW][C]9[/C][C]99[/C][C]99.76280843825[/C][C]-0.762808438250024[/C][/ROW]
[ROW][C]10[/C][C]99[/C][C]99.5719351130919[/C][C]-0.571935113091859[/C][/ROW]
[ROW][C]11[/C][C]99.3[/C][C]99.5242167818023[/C][C]-0.224216781802321[/C][/ROW]
[ROW][C]12[/C][C]99.5[/C][C]99.5242167818023[/C][C]-0.0242167818023186[/C][/ROW]
[ROW][C]13[/C][C]99.7[/C][C]99.5242167818023[/C][C]0.175783218197684[/C][/ROW]
[ROW][C]14[/C][C]100[/C][C]99.5242167818023[/C][C]0.475783218197681[/C][/ROW]
[ROW][C]15[/C][C]100.4[/C][C]99.5242167818023[/C][C]0.875783218197687[/C][/ROW]
[ROW][C]16[/C][C]100.6[/C][C]99.5242167818023[/C][C]1.07578321819768[/C][/ROW]
[ROW][C]17[/C][C]100.7[/C][C]99.6864591081868[/C][C]1.01354089181324[/C][/ROW]
[ROW][C]18[/C][C]100.7[/C][C]99.76280843825[/C][C]0.937191561749979[/C][/ROW]
[ROW][C]19[/C][C]100.6[/C][C]99.76280843825[/C][C]0.83719156174997[/C][/ROW]
[ROW][C]20[/C][C]100.5[/C][C]99.772352104508[/C][C]0.727647895492068[/C][/ROW]
[ROW][C]21[/C][C]100.6[/C][C]100.211360752372[/C][C]0.388639247628284[/C][/ROW]
[ROW][C]22[/C][C]100.5[/C][C]100.478583407593[/C][C]0.0214165924068594[/C][/ROW]
[ROW][C]23[/C][C]100.4[/C][C]100.822155392878[/C][C]-0.422155392877831[/C][/ROW]
[ROW][C]24[/C][C]100.3[/C][C]100.955766720489[/C][C]-0.655766720488555[/C][/ROW]
[ROW][C]25[/C][C]100.4[/C][C]100.955766720489[/C][C]-0.555766720488546[/C][/ROW]
[ROW][C]26[/C][C]100.4[/C][C]100.955766720489[/C][C]-0.555766720488546[/C][/ROW]
[ROW][C]27[/C][C]100.4[/C][C]100.955766720489[/C][C]-0.555766720488546[/C][/ROW]
[ROW][C]28[/C][C]100.4[/C][C]100.955766720489[/C][C]-0.555766720488546[/C][/ROW]
[ROW][C]29[/C][C]100.4[/C][C]100.955766720489[/C][C]-0.555766720488546[/C][/ROW]
[ROW][C]30[/C][C]100.5[/C][C]100.955766720489[/C][C]-0.455766720488552[/C][/ROW]
[ROW][C]31[/C][C]100.6[/C][C]100.955766720489[/C][C]-0.355766720488557[/C][/ROW]
[ROW][C]32[/C][C]100.6[/C][C]100.955766720489[/C][C]-0.355766720488557[/C][/ROW]
[ROW][C]33[/C][C]100.5[/C][C]100.955766720489[/C][C]-0.455766720488552[/C][/ROW]
[ROW][C]34[/C][C]100.5[/C][C]100.955766720489[/C][C]-0.455766720488552[/C][/ROW]
[ROW][C]35[/C][C]100.7[/C][C]100.955766720489[/C][C]-0.255766720488549[/C][/ROW]
[ROW][C]36[/C][C]101.1[/C][C]101.337513370805[/C][C]-0.237513370804886[/C][/ROW]
[ROW][C]37[/C][C]101.5[/C][C]101.432950033384[/C][C]0.0670499666160373[/C][/ROW]
[ROW][C]38[/C][C]101.9[/C][C]101.432950033384[/C][C]0.467049966616043[/C][/ROW]
[ROW][C]39[/C][C]102.1[/C][C]101.623823358542[/C][C]0.476176641457867[/C][/ROW]
[ROW][C]40[/C][C]102.1[/C][C]101.671541689832[/C][C]0.428458310168326[/C][/ROW]
[ROW][C]41[/C][C]102.1[/C][C]101.671541689832[/C][C]0.428458310168326[/C][/ROW]
[ROW][C]42[/C][C]102.4[/C][C]102.053288340148[/C][C]0.346711659852009[/C][/ROW]
[ROW][C]43[/C][C]102.8[/C][C]102.148725002727[/C][C]0.651274997272918[/C][/ROW]
[ROW][C]44[/C][C]103.1[/C][C]102.148725002727[/C][C]0.951274997272915[/C][/ROW]
[ROW][C]45[/C][C]103.1[/C][C]102.148725002727[/C][C]0.951274997272915[/C][/ROW]
[ROW][C]46[/C][C]102.9[/C][C]102.148725002727[/C][C]0.751274997272926[/C][/ROW]
[ROW][C]47[/C][C]102.4[/C][C]102.148725002727[/C][C]0.251274997272926[/C][/ROW]
[ROW][C]48[/C][C]101.9[/C][C]102.148725002727[/C][C]-0.248725002727074[/C][/ROW]
[ROW][C]49[/C][C]101.3[/C][C]102.148725002727[/C][C]-0.848725002727082[/C][/ROW]
[ROW][C]50[/C][C]100.7[/C][C]102.148725002727[/C][C]-1.44872500272708[/C][/ROW]
[ROW][C]51[/C][C]100.6[/C][C]102.148725002727[/C][C]-1.54872500272709[/C][/ROW]
[ROW][C]52[/C][C]101[/C][C]102.148725002727[/C][C]-1.14872500272708[/C][/ROW]
[ROW][C]53[/C][C]101.5[/C][C]102.148725002727[/C][C]-0.648725002727079[/C][/ROW]
[ROW][C]54[/C][C]101.9[/C][C]102.148725002727[/C][C]-0.248725002727074[/C][/ROW]
[ROW][C]55[/C][C]102.1[/C][C]102.148725002727[/C][C]-0.048725002727085[/C][/ROW]
[ROW][C]56[/C][C]102.3[/C][C]102.148725002727[/C][C]0.151274997272918[/C][/ROW]
[ROW][C]57[/C][C]102.5[/C][C]102.148725002727[/C][C]0.351274997272921[/C][/ROW]
[ROW][C]58[/C][C]102.9[/C][C]102.148725002727[/C][C]0.751274997272926[/C][/ROW]
[ROW][C]59[/C][C]103.6[/C][C]102.148725002727[/C][C]1.45127499727291[/C][/ROW]
[ROW][C]60[/C][C]104.3[/C][C]102.148725002727[/C][C]2.15127499727292[/C][/ROW]
[/TABLE]
Source: https://freestatistics.org/blog/index.php?pk=57939&T=4

Globally Unique Identifier (entire table): ba.freestatistics.org/blog/index.php?pk=57939&T=4

As an alternative you can also use a QR Code:  

The GUIDs for individual cells are displayed in the table below:

Multiple Linear Regression - Actuals, Interpolation, and Residuals
Time or IndexActualsInterpolationForecastResidualsPrediction Error
1101.2101.1943583769370.00564162306336613
2101.1100.9939413855200.106058614479800
3100.7100.841242725394-0.14124272539365
4100.1100.707631397783-0.607631397782944
599.9100.478583407593-0.578583407593135
699.7100.135011422308-0.435011422308442
799.5100.001400094698-0.50140009469773
899.2100.001400094698-0.801400094697727
99999.76280843825-0.762808438250024
109999.5719351130919-0.571935113091859
1199.399.5242167818023-0.224216781802321
1299.599.5242167818023-0.0242167818023186
1399.799.52421678180230.175783218197684
1410099.52421678180230.475783218197681
15100.499.52421678180230.875783218197687
16100.699.52421678180231.07578321819768
17100.799.68645910818681.01354089181324
18100.799.762808438250.937191561749979
19100.699.762808438250.83719156174997
20100.599.7723521045080.727647895492068
21100.6100.2113607523720.388639247628284
22100.5100.4785834075930.0214165924068594
23100.4100.822155392878-0.422155392877831
24100.3100.955766720489-0.655766720488555
25100.4100.955766720489-0.555766720488546
26100.4100.955766720489-0.555766720488546
27100.4100.955766720489-0.555766720488546
28100.4100.955766720489-0.555766720488546
29100.4100.955766720489-0.555766720488546
30100.5100.955766720489-0.455766720488552
31100.6100.955766720489-0.355766720488557
32100.6100.955766720489-0.355766720488557
33100.5100.955766720489-0.455766720488552
34100.5100.955766720489-0.455766720488552
35100.7100.955766720489-0.255766720488549
36101.1101.337513370805-0.237513370804886
37101.5101.4329500333840.0670499666160373
38101.9101.4329500333840.467049966616043
39102.1101.6238233585420.476176641457867
40102.1101.6715416898320.428458310168326
41102.1101.6715416898320.428458310168326
42102.4102.0532883401480.346711659852009
43102.8102.1487250027270.651274997272918
44103.1102.1487250027270.951274997272915
45103.1102.1487250027270.951274997272915
46102.9102.1487250027270.751274997272926
47102.4102.1487250027270.251274997272926
48101.9102.148725002727-0.248725002727074
49101.3102.148725002727-0.848725002727082
50100.7102.148725002727-1.44872500272708
51100.6102.148725002727-1.54872500272709
52101102.148725002727-1.14872500272708
53101.5102.148725002727-0.648725002727079
54101.9102.148725002727-0.248725002727074
55102.1102.148725002727-0.048725002727085
56102.3102.1487250027270.151274997272918
57102.5102.1487250027270.351274997272921
58102.9102.1487250027270.751274997272926
59103.6102.1487250027271.45127499727291
60104.3102.1487250027272.15127499727292


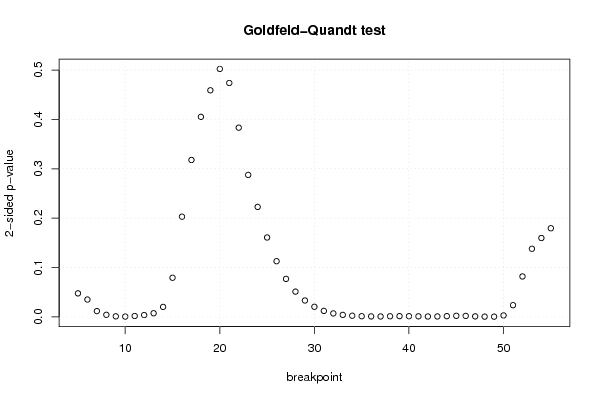
Goldfeld-Quandt test for Heteroskedasticity
p-valuesAlternative Hypothesis
breakpoint indexgreater2-sidedless
50.02384148489852470.04768296979704930.976158515101475
60.01757426573292510.03514853146585030.982425734267075
70.005881021451437330.01176204290287470.994118978548563
80.002120593486183050.00424118697236610.997879406513817
90.0005873207874810280.001174641574962060.999412679212519
100.0003557712515686550.000711542503137310.999644228748431
110.0009168606341702180.001833721268340440.99908313936583
120.001882293427581540.003764586855163070.998117706572418
130.003705845811439450.00741169162287890.99629415418856
140.01012844769091740.02025689538183490.989871552309083
150.03963724830114310.07927449660228610.960362751698857
160.1014788943524330.2029577887048660.898521105647567
170.1589061361096280.3178122722192570.841093863890372
180.2025578969564430.4051157939128860.797442103043557
190.2294502371804750.458900474360950.770549762819525
200.2510775982235120.5021551964470230.748922401776488
210.2368794864777230.4737589729554460.763120513522277
220.1916095578008840.3832191156017670.808390442199116
230.1437689484435470.2875378968870950.856231051556453
240.1113715365874790.2227430731749580.888628463412521
250.08041026190065450.1608205238013090.919589738099346
260.05640178441026950.1128035688205390.94359821558973
270.03848753082594340.07697506165188680.961512469174057
280.02559483255723550.05118966511447090.974405167442765
290.01663041118242540.03326082236485070.983369588817575
300.01025337316738880.02050674633477760.989746626832611
310.006102863341212230.01220572668242450.993897136658788
320.00353294387240690.00706588774481380.996467056127593
330.002047709886522250.00409541977304450.997952290113478
340.001205453219763790.002410906439527590.998794546780236
350.0007092189342856360.001418437868571270.999290781065714
360.000496346294412760.000992692588825520.999503653705587
370.0004492647420479600.0008985294840959190.999550735257952
380.0006355280684411090.001271056136882220.999364471931559
390.0007803521094718870.001560704218943770.999219647890528
400.0007300678438897760.001460135687779550.99926993215611
410.0005988867028345670.001197773405669130.999401113297165
420.0004264117423536790.0008528234847073570.999573588257646
430.0004505953531122420.0009011907062244830.999549404646888
440.0007594432955586330.001518886591117270.999240556704441
450.001098935986463720.002197871972927430.998901064013536
460.001026345438677350.002052690877354700.998973654561323
470.000530250119192780.001060500238385560.999469749880807
480.0002600903746498830.0005201807492997650.99973990962535
490.0002741415919005030.0005482831838010070.9997258584081
500.001476425958102910.002952851916205820.998523574041897
510.01189348024134960.02378696048269920.98810651975865
520.04095221250862780.08190442501725560.959047787491372
530.0689769328818470.1379538657636940.931023067118153
540.07987648116570250.1597529623314050.920123518834298
550.08976852569904360.1795370513980870.910231474300956

\begin{tabular}{lllllllll}
\hline
Goldfeld-Quandt test for Heteroskedasticity \tabularnewline
p-values & Alternative Hypothesis \tabularnewline
breakpoint index & greater & 2-sided & less \tabularnewline
5 & 0.0238414848985247 & 0.0476829697970493 & 0.976158515101475 \tabularnewline
6 & 0.0175742657329251 & 0.0351485314658503 & 0.982425734267075 \tabularnewline
7 & 0.00588102145143733 & 0.0117620429028747 & 0.994118978548563 \tabularnewline
8 & 0.00212059348618305 & 0.0042411869723661 & 0.997879406513817 \tabularnewline
9 & 0.000587320787481028 & 0.00117464157496206 & 0.999412679212519 \tabularnewline
10 & 0.000355771251568655 & 0.00071154250313731 & 0.999644228748431 \tabularnewline
11 & 0.000916860634170218 & 0.00183372126834044 & 0.99908313936583 \tabularnewline
12 & 0.00188229342758154 & 0.00376458685516307 & 0.998117706572418 \tabularnewline
13 & 0.00370584581143945 & 0.0074116916228789 & 0.99629415418856 \tabularnewline
14 & 0.0101284476909174 & 0.0202568953818349 & 0.989871552309083 \tabularnewline
15 & 0.0396372483011431 & 0.0792744966022861 & 0.960362751698857 \tabularnewline
16 & 0.101478894352433 & 0.202957788704866 & 0.898521105647567 \tabularnewline
17 & 0.158906136109628 & 0.317812272219257 & 0.841093863890372 \tabularnewline
18 & 0.202557896956443 & 0.405115793912886 & 0.797442103043557 \tabularnewline
19 & 0.229450237180475 & 0.45890047436095 & 0.770549762819525 \tabularnewline
20 & 0.251077598223512 & 0.502155196447023 & 0.748922401776488 \tabularnewline
21 & 0.236879486477723 & 0.473758972955446 & 0.763120513522277 \tabularnewline
22 & 0.191609557800884 & 0.383219115601767 & 0.808390442199116 \tabularnewline
23 & 0.143768948443547 & 0.287537896887095 & 0.856231051556453 \tabularnewline
24 & 0.111371536587479 & 0.222743073174958 & 0.888628463412521 \tabularnewline
25 & 0.0804102619006545 & 0.160820523801309 & 0.919589738099346 \tabularnewline
26 & 0.0564017844102695 & 0.112803568820539 & 0.94359821558973 \tabularnewline
27 & 0.0384875308259434 & 0.0769750616518868 & 0.961512469174057 \tabularnewline
28 & 0.0255948325572355 & 0.0511896651144709 & 0.974405167442765 \tabularnewline
29 & 0.0166304111824254 & 0.0332608223648507 & 0.983369588817575 \tabularnewline
30 & 0.0102533731673888 & 0.0205067463347776 & 0.989746626832611 \tabularnewline
31 & 0.00610286334121223 & 0.0122057266824245 & 0.993897136658788 \tabularnewline
32 & 0.0035329438724069 & 0.0070658877448138 & 0.996467056127593 \tabularnewline
33 & 0.00204770988652225 & 0.0040954197730445 & 0.997952290113478 \tabularnewline
34 & 0.00120545321976379 & 0.00241090643952759 & 0.998794546780236 \tabularnewline
35 & 0.000709218934285636 & 0.00141843786857127 & 0.999290781065714 \tabularnewline
36 & 0.00049634629441276 & 0.00099269258882552 & 0.999503653705587 \tabularnewline
37 & 0.000449264742047960 & 0.000898529484095919 & 0.999550735257952 \tabularnewline
38 & 0.000635528068441109 & 0.00127105613688222 & 0.999364471931559 \tabularnewline
39 & 0.000780352109471887 & 0.00156070421894377 & 0.999219647890528 \tabularnewline
40 & 0.000730067843889776 & 0.00146013568777955 & 0.99926993215611 \tabularnewline
41 & 0.000598886702834567 & 0.00119777340566913 & 0.999401113297165 \tabularnewline
42 & 0.000426411742353679 & 0.000852823484707357 & 0.999573588257646 \tabularnewline
43 & 0.000450595353112242 & 0.000901190706224483 & 0.999549404646888 \tabularnewline
44 & 0.000759443295558633 & 0.00151888659111727 & 0.999240556704441 \tabularnewline
45 & 0.00109893598646372 & 0.00219787197292743 & 0.998901064013536 \tabularnewline
46 & 0.00102634543867735 & 0.00205269087735470 & 0.998973654561323 \tabularnewline
47 & 0.00053025011919278 & 0.00106050023838556 & 0.999469749880807 \tabularnewline
48 & 0.000260090374649883 & 0.000520180749299765 & 0.99973990962535 \tabularnewline
49 & 0.000274141591900503 & 0.000548283183801007 & 0.9997258584081 \tabularnewline
50 & 0.00147642595810291 & 0.00295285191620582 & 0.998523574041897 \tabularnewline
51 & 0.0118934802413496 & 0.0237869604826992 & 0.98810651975865 \tabularnewline
52 & 0.0409522125086278 & 0.0819044250172556 & 0.959047787491372 \tabularnewline
53 & 0.068976932881847 & 0.137953865763694 & 0.931023067118153 \tabularnewline
54 & 0.0798764811657025 & 0.159752962331405 & 0.920123518834298 \tabularnewline
55 & 0.0897685256990436 & 0.179537051398087 & 0.910231474300956 \tabularnewline
\hline
\end{tabular}
%Source: https://freestatistics.org/blog/index.php?pk=57939&T=5

[TABLE]
[ROW][C]Goldfeld-Quandt test for Heteroskedasticity[/C][/ROW]
[ROW][C]p-values[/C][C]Alternative Hypothesis[/C][/ROW]
[ROW][C]breakpoint index[/C][C]greater[/C][C]2-sided[/C][C]less[/C][/ROW]
[ROW][C]5[/C][C]0.0238414848985247[/C][C]0.0476829697970493[/C][C]0.976158515101475[/C][/ROW]
[ROW][C]6[/C][C]0.0175742657329251[/C][C]0.0351485314658503[/C][C]0.982425734267075[/C][/ROW]
[ROW][C]7[/C][C]0.00588102145143733[/C][C]0.0117620429028747[/C][C]0.994118978548563[/C][/ROW]
[ROW][C]8[/C][C]0.00212059348618305[/C][C]0.0042411869723661[/C][C]0.997879406513817[/C][/ROW]
[ROW][C]9[/C][C]0.000587320787481028[/C][C]0.00117464157496206[/C][C]0.999412679212519[/C][/ROW]
[ROW][C]10[/C][C]0.000355771251568655[/C][C]0.00071154250313731[/C][C]0.999644228748431[/C][/ROW]
[ROW][C]11[/C][C]0.000916860634170218[/C][C]0.00183372126834044[/C][C]0.99908313936583[/C][/ROW]
[ROW][C]12[/C][C]0.00188229342758154[/C][C]0.00376458685516307[/C][C]0.998117706572418[/C][/ROW]
[ROW][C]13[/C][C]0.00370584581143945[/C][C]0.0074116916228789[/C][C]0.99629415418856[/C][/ROW]
[ROW][C]14[/C][C]0.0101284476909174[/C][C]0.0202568953818349[/C][C]0.989871552309083[/C][/ROW]
[ROW][C]15[/C][C]0.0396372483011431[/C][C]0.0792744966022861[/C][C]0.960362751698857[/C][/ROW]
[ROW][C]16[/C][C]0.101478894352433[/C][C]0.202957788704866[/C][C]0.898521105647567[/C][/ROW]
[ROW][C]17[/C][C]0.158906136109628[/C][C]0.317812272219257[/C][C]0.841093863890372[/C][/ROW]
[ROW][C]18[/C][C]0.202557896956443[/C][C]0.405115793912886[/C][C]0.797442103043557[/C][/ROW]
[ROW][C]19[/C][C]0.229450237180475[/C][C]0.45890047436095[/C][C]0.770549762819525[/C][/ROW]
[ROW][C]20[/C][C]0.251077598223512[/C][C]0.502155196447023[/C][C]0.748922401776488[/C][/ROW]
[ROW][C]21[/C][C]0.236879486477723[/C][C]0.473758972955446[/C][C]0.763120513522277[/C][/ROW]
[ROW][C]22[/C][C]0.191609557800884[/C][C]0.383219115601767[/C][C]0.808390442199116[/C][/ROW]
[ROW][C]23[/C][C]0.143768948443547[/C][C]0.287537896887095[/C][C]0.856231051556453[/C][/ROW]
[ROW][C]24[/C][C]0.111371536587479[/C][C]0.222743073174958[/C][C]0.888628463412521[/C][/ROW]
[ROW][C]25[/C][C]0.0804102619006545[/C][C]0.160820523801309[/C][C]0.919589738099346[/C][/ROW]
[ROW][C]26[/C][C]0.0564017844102695[/C][C]0.112803568820539[/C][C]0.94359821558973[/C][/ROW]
[ROW][C]27[/C][C]0.0384875308259434[/C][C]0.0769750616518868[/C][C]0.961512469174057[/C][/ROW]
[ROW][C]28[/C][C]0.0255948325572355[/C][C]0.0511896651144709[/C][C]0.974405167442765[/C][/ROW]
[ROW][C]29[/C][C]0.0166304111824254[/C][C]0.0332608223648507[/C][C]0.983369588817575[/C][/ROW]
[ROW][C]30[/C][C]0.0102533731673888[/C][C]0.0205067463347776[/C][C]0.989746626832611[/C][/ROW]
[ROW][C]31[/C][C]0.00610286334121223[/C][C]0.0122057266824245[/C][C]0.993897136658788[/C][/ROW]
[ROW][C]32[/C][C]0.0035329438724069[/C][C]0.0070658877448138[/C][C]0.996467056127593[/C][/ROW]
[ROW][C]33[/C][C]0.00204770988652225[/C][C]0.0040954197730445[/C][C]0.997952290113478[/C][/ROW]
[ROW][C]34[/C][C]0.00120545321976379[/C][C]0.00241090643952759[/C][C]0.998794546780236[/C][/ROW]
[ROW][C]35[/C][C]0.000709218934285636[/C][C]0.00141843786857127[/C][C]0.999290781065714[/C][/ROW]
[ROW][C]36[/C][C]0.00049634629441276[/C][C]0.00099269258882552[/C][C]0.999503653705587[/C][/ROW]
[ROW][C]37[/C][C]0.000449264742047960[/C][C]0.000898529484095919[/C][C]0.999550735257952[/C][/ROW]
[ROW][C]38[/C][C]0.000635528068441109[/C][C]0.00127105613688222[/C][C]0.999364471931559[/C][/ROW]
[ROW][C]39[/C][C]0.000780352109471887[/C][C]0.00156070421894377[/C][C]0.999219647890528[/C][/ROW]
[ROW][C]40[/C][C]0.000730067843889776[/C][C]0.00146013568777955[/C][C]0.99926993215611[/C][/ROW]
[ROW][C]41[/C][C]0.000598886702834567[/C][C]0.00119777340566913[/C][C]0.999401113297165[/C][/ROW]
[ROW][C]42[/C][C]0.000426411742353679[/C][C]0.000852823484707357[/C][C]0.999573588257646[/C][/ROW]
[ROW][C]43[/C][C]0.000450595353112242[/C][C]0.000901190706224483[/C][C]0.999549404646888[/C][/ROW]
[ROW][C]44[/C][C]0.000759443295558633[/C][C]0.00151888659111727[/C][C]0.999240556704441[/C][/ROW]
[ROW][C]45[/C][C]0.00109893598646372[/C][C]0.00219787197292743[/C][C]0.998901064013536[/C][/ROW]
[ROW][C]46[/C][C]0.00102634543867735[/C][C]0.00205269087735470[/C][C]0.998973654561323[/C][/ROW]
[ROW][C]47[/C][C]0.00053025011919278[/C][C]0.00106050023838556[/C][C]0.999469749880807[/C][/ROW]
[ROW][C]48[/C][C]0.000260090374649883[/C][C]0.000520180749299765[/C][C]0.99973990962535[/C][/ROW]
[ROW][C]49[/C][C]0.000274141591900503[/C][C]0.000548283183801007[/C][C]0.9997258584081[/C][/ROW]
[ROW][C]50[/C][C]0.00147642595810291[/C][C]0.00295285191620582[/C][C]0.998523574041897[/C][/ROW]
[ROW][C]51[/C][C]0.0118934802413496[/C][C]0.0237869604826992[/C][C]0.98810651975865[/C][/ROW]
[ROW][C]52[/C][C]0.0409522125086278[/C][C]0.0819044250172556[/C][C]0.959047787491372[/C][/ROW]
[ROW][C]53[/C][C]0.068976932881847[/C][C]0.137953865763694[/C][C]0.931023067118153[/C][/ROW]
[ROW][C]54[/C][C]0.0798764811657025[/C][C]0.159752962331405[/C][C]0.920123518834298[/C][/ROW]
[ROW][C]55[/C][C]0.0897685256990436[/C][C]0.179537051398087[/C][C]0.910231474300956[/C][/ROW]
[/TABLE]
Source: https://freestatistics.org/blog/index.php?pk=57939&T=5

Globally Unique Identifier (entire table): ba.freestatistics.org/blog/index.php?pk=57939&T=5

As an alternative you can also use a QR Code:  

The GUIDs for individual cells are displayed in the table below:

Goldfeld-Quandt test for Heteroskedasticity
p-valuesAlternative Hypothesis
breakpoint indexgreater2-sidedless
50.02384148489852470.04768296979704930.976158515101475
60.01757426573292510.03514853146585030.982425734267075
70.005881021451437330.01176204290287470.994118978548563
80.002120593486183050.00424118697236610.997879406513817
90.0005873207874810280.001174641574962060.999412679212519
100.0003557712515686550.000711542503137310.999644228748431
110.0009168606341702180.001833721268340440.99908313936583
120.001882293427581540.003764586855163070.998117706572418
130.003705845811439450.00741169162287890.99629415418856
140.01012844769091740.02025689538183490.989871552309083
150.03963724830114310.07927449660228610.960362751698857
160.1014788943524330.2029577887048660.898521105647567
170.1589061361096280.3178122722192570.841093863890372
180.2025578969564430.4051157939128860.797442103043557
190.2294502371804750.458900474360950.770549762819525
200.2510775982235120.5021551964470230.748922401776488
210.2368794864777230.4737589729554460.763120513522277
220.1916095578008840.3832191156017670.808390442199116
230.1437689484435470.2875378968870950.856231051556453
240.1113715365874790.2227430731749580.888628463412521
250.08041026190065450.1608205238013090.919589738099346
260.05640178441026950.1128035688205390.94359821558973
270.03848753082594340.07697506165188680.961512469174057
280.02559483255723550.05118966511447090.974405167442765
290.01663041118242540.03326082236485070.983369588817575
300.01025337316738880.02050674633477760.989746626832611
310.006102863341212230.01220572668242450.993897136658788
320.00353294387240690.00706588774481380.996467056127593
330.002047709886522250.00409541977304450.997952290113478
340.001205453219763790.002410906439527590.998794546780236
350.0007092189342856360.001418437868571270.999290781065714
360.000496346294412760.000992692588825520.999503653705587
370.0004492647420479600.0008985294840959190.999550735257952
380.0006355280684411090.001271056136882220.999364471931559
390.0007803521094718870.001560704218943770.999219647890528
400.0007300678438897760.001460135687779550.99926993215611
410.0005988867028345670.001197773405669130.999401113297165
420.0004264117423536790.0008528234847073570.999573588257646
430.0004505953531122420.0009011907062244830.999549404646888
440.0007594432955586330.001518886591117270.999240556704441
450.001098935986463720.002197871972927430.998901064013536
460.001026345438677350.002052690877354700.998973654561323
470.000530250119192780.001060500238385560.999469749880807
480.0002600903746498830.0005201807492997650.99973990962535
490.0002741415919005030.0005482831838010070.9997258584081
500.001476425958102910.002952851916205820.998523574041897
510.01189348024134960.02378696048269920.98810651975865
520.04095221250862780.08190442501725560.959047787491372
530.0689769328818470.1379538657636940.931023067118153
540.07987648116570250.1597529623314050.920123518834298
550.08976852569904360.1795370513980870.910231474300956


Meta Analysis of Goldfeld-Quandt test for Heteroskedasticity
Description# significant tests% significant testsOK/NOK
1% type I error level250.490196078431373NOK
5% type I error level330.647058823529412NOK
10% type I error level370.725490196078431NOK

\begin{tabular}{lllllllll}
\hline
Meta Analysis of Goldfeld-Quandt test for Heteroskedasticity \tabularnewline
Description & # significant tests & % significant tests & OK/NOK \tabularnewline
1% type I error level & 25 & 0.490196078431373 & NOK \tabularnewline
5% type I error level & 33 & 0.647058823529412 & NOK \tabularnewline
10% type I error level & 37 & 0.725490196078431 & NOK \tabularnewline
\hline
\end{tabular}
%Source: https://freestatistics.org/blog/index.php?pk=57939&T=6

[TABLE]
[ROW][C]Meta Analysis of Goldfeld-Quandt test for Heteroskedasticity[/C][/ROW]
[ROW][C]Description[/C][C]# significant tests[/C][C]% significant tests[/C][C]OK/NOK[/C][/ROW]
[ROW][C]1% type I error level[/C][C]25[/C][C]0.490196078431373[/C][C]NOK[/C][/ROW]
[ROW][C]5% type I error level[/C][C]33[/C][C]0.647058823529412[/C][C]NOK[/C][/ROW]
[ROW][C]10% type I error level[/C][C]37[/C][C]0.725490196078431[/C][C]NOK[/C][/ROW]
[/TABLE]
Source: https://freestatistics.org/blog/index.php?pk=57939&T=6

Globally Unique Identifier (entire table): ba.freestatistics.org/blog/index.php?pk=57939&T=6

As an alternative you can also use a QR Code:  

The GUIDs for individual cells are displayed in the table below:

Meta Analysis of Goldfeld-Quandt test for Heteroskedasticity
Description# significant tests% significant testsOK/NOK
1% type I error level250.490196078431373NOK
5% type I error level330.647058823529412NOK
10% type I error level370.725490196078431NOK


Parameters (Session):
par1 = 2 ; par2 = Do not include Seasonal Dummies ; par3 = No Linear Trend ;
Parameters (R input):
par1 = 2 ; par2 = Do not include Seasonal Dummies ; par3 = No Linear Trend ;
R code (references can be found in the software module):
library(lattice)
library(lmtest)
n25 <- 25 #minimum number of obs. for Goldfeld-Quandt test
par1 <- as.numeric(par1)
x <- t(y)
k <- length(x[1,])
n <- length(x[,1])
x1 <- cbind(x[,par1], x[,1:k!=par1])
mycolnames <- c(colnames(x)[par1], colnames(x)[1:k!=par1])
colnames(x1) <- mycolnames #colnames(x)[par1]
x <- x1
if (par3 == 'First Differences'){
x2 <- array(0, dim=c(n-1,k), dimnames=list(1:(n-1), paste('(1-B)',colnames(x),sep='')))
for (i in 1:n-1) {
for (j in 1:k) {
x2[i,j] <- x[i+1,j] - x[i,j]
}
}
x <- x2
}
if (par2 == 'Include Monthly Dummies'){
x2 <- array(0, dim=c(n,11), dimnames=list(1:n, paste('M', seq(1:11), sep ='')))
for (i in 1:11){
x2[seq(i,n,12),i] <- 1
}
x <- cbind(x, x2)
}
if (par2 == 'Include Quarterly Dummies'){
x2 <- array(0, dim=c(n,3), dimnames=list(1:n, paste('Q', seq(1:3), sep ='')))
for (i in 1:3){
x2[seq(i,n,4),i] <- 1
}
x <- cbind(x, x2)
}
k <- length(x[1,])
if (par3 == 'Linear Trend'){
x <- cbind(x, c(1:n))
colnames(x)[k+1] <- 't'
}
x
k <- length(x[1,])
df <- as.data.frame(x)
(mylm <- lm(df))
(mysum <- summary(mylm))
if (n > n25) {
kp3 <- k + 3
nmkm3 <- n - k - 3
gqarr <- array(NA, dim=c(nmkm3-kp3+1,3))
numgqtests <- 0
numsignificant1 <- 0
numsignificant5 <- 0
numsignificant10 <- 0
for (mypoint in kp3:nmkm3) {
j <- 0
numgqtests <- numgqtests + 1
for (myalt in c('greater', 'two.sided', 'less')) {
j <- j + 1
gqarr[mypoint-kp3+1,j] <- gqtest(mylm, point=mypoint, alternative=myalt)$p.value
}
if (gqarr[mypoint-kp3+1,2] < 0.01) numsignificant1 <- numsignificant1 + 1
if (gqarr[mypoint-kp3+1,2] < 0.05) numsignificant5 <- numsignificant5 + 1
if (gqarr[mypoint-kp3+1,2] < 0.10) numsignificant10 <- numsignificant10 + 1
}
gqarr
}
bitmap(file='test0.png')
plot(x[,1], type='l', main='Actuals and Interpolation', ylab='value of Actuals and Interpolation (dots)', xlab='time or index')
points(x[,1]-mysum$resid)
grid()
dev.off()
bitmap(file='test1.png')
plot(mysum$resid, type='b', pch=19, main='Residuals', ylab='value of Residuals', xlab='time or index')
grid()
dev.off()
bitmap(file='test2.png')
hist(mysum$resid, main='Residual Histogram', xlab='values of Residuals')
grid()
dev.off()
bitmap(file='test3.png')
densityplot(~mysum$resid,col='black',main='Residual Density Plot', xlab='values of Residuals')
dev.off()
bitmap(file='test4.png')
qqnorm(mysum$resid, main='Residual Normal Q-Q Plot')
qqline(mysum$resid)
grid()
dev.off()
(myerror <- as.ts(mysum$resid))
bitmap(file='test5.png')
dum <- cbind(lag(myerror,k=1),myerror)
dum
dum1 <- dum[2:length(myerror),]
dum1
z <- as.data.frame(dum1)
z
plot(z,main=paste('Residual Lag plot, lowess, and regression line'), ylab='values of Residuals', xlab='lagged values of Residuals')
lines(lowess(z))
abline(lm(z))
grid()
dev.off()
bitmap(file='test6.png')
acf(mysum$resid, lag.max=length(mysum$resid)/2, main='Residual Autocorrelation Function')
grid()
dev.off()
bitmap(file='test7.png')
pacf(mysum$resid, lag.max=length(mysum$resid)/2, main='Residual Partial Autocorrelation Function')
grid()
dev.off()
bitmap(file='test8.png')
opar <- par(mfrow = c(2,2), oma = c(0, 0, 1.1, 0))
plot(mylm, las = 1, sub='Residual Diagnostics')
par(opar)
dev.off()
if (n > n25) {
bitmap(file='test9.png')
plot(kp3:nmkm3,gqarr[,2], main='Goldfeld-Quandt test',ylab='2-sided p-value',xlab='breakpoint')
grid()
dev.off()
}
load(file='createtable')
a<-table.start()
a<-table.row.start(a)
a<-table.element(a, 'Multiple Linear Regression - Estimated Regression Equation', 1, TRUE)
a<-table.row.end(a)
myeq <- colnames(x)[1]
myeq <- paste(myeq, '[t] = ', sep='')
for (i in 1:k){
if (mysum$coefficients[i,1] > 0) myeq <- paste(myeq, '+', '')
myeq <- paste(myeq, mysum$coefficients[i,1], sep=' ')
if (rownames(mysum$coefficients)[i] != '(Intercept)') {
myeq <- paste(myeq, rownames(mysum$coefficients)[i], sep='')
if (rownames(mysum$coefficients)[i] != 't') myeq <- paste(myeq, '[t]', sep='')
}
}
myeq <- paste(myeq, ' + e[t]')
a<-table.row.start(a)
a<-table.element(a, myeq)
a<-table.row.end(a)
a<-table.end(a)
table.save(a,file='mytable1.tab')
a<-table.start()
a<-table.row.start(a)
a<-table.element(a,hyperlink('ols1.htm','Multiple Linear Regression - Ordinary Least Squares',''), 6, TRUE)
a<-table.row.end(a)
a<-table.row.start(a)
a<-table.element(a,'Variable',header=TRUE)
a<-table.element(a,'Parameter',header=TRUE)
a<-table.element(a,'S.D.',header=TRUE)
a<-table.element(a,'T-STAT
H0: parameter = 0',header=TRUE)
a<-table.element(a,'2-tail p-value',header=TRUE)
a<-table.element(a,'1-tail p-value',header=TRUE)
a<-table.row.end(a)
for (i in 1:k){
a<-table.row.start(a)
a<-table.element(a,rownames(mysum$coefficients)[i],header=TRUE)
a<-table.element(a,mysum$coefficients[i,1])
a<-table.element(a, round(mysum$coefficients[i,2],6))
a<-table.element(a, round(mysum$coefficients[i,3],4))
a<-table.element(a, round(mysum$coefficients[i,4],6))
a<-table.element(a, round(mysum$coefficients[i,4]/2,6))
a<-table.row.end(a)
}
a<-table.end(a)
table.save(a,file='mytable2.tab')
a<-table.start()
a<-table.row.start(a)
a<-table.element(a, 'Multiple Linear Regression - Regression Statistics', 2, TRUE)
a<-table.row.end(a)
a<-table.row.start(a)
a<-table.element(a, 'Multiple R',1,TRUE)
a<-table.element(a, sqrt(mysum$r.squared))
a<-table.row.end(a)
a<-table.row.start(a)
a<-table.element(a, 'R-squared',1,TRUE)
a<-table.element(a, mysum$r.squared)
a<-table.row.end(a)
a<-table.row.start(a)
a<-table.element(a, 'Adjusted R-squared',1,TRUE)
a<-table.element(a, mysum$adj.r.squared)
a<-table.row.end(a)
a<-table.row.start(a)
a<-table.element(a, 'F-TEST (value)',1,TRUE)
a<-table.element(a, mysum$fstatistic[1])
a<-table.row.end(a)
a<-table.row.start(a)
a<-table.element(a, 'F-TEST (DF numerator)',1,TRUE)
a<-table.element(a, mysum$fstatistic[2])
a<-table.row.end(a)
a<-table.row.start(a)
a<-table.element(a, 'F-TEST (DF denominator)',1,TRUE)
a<-table.element(a, mysum$fstatistic[3])
a<-table.row.end(a)
a<-table.row.start(a)
a<-table.element(a, 'p-value',1,TRUE)
a<-table.element(a, 1-pf(mysum$fstatistic[1],mysum$fstatistic[2],mysum$fstatistic[3]))
a<-table.row.end(a)
a<-table.row.start(a)
a<-table.element(a, 'Multiple Linear Regression - Residual Statistics', 2, TRUE)
a<-table.row.end(a)
a<-table.row.start(a)
a<-table.element(a, 'Residual Standard Deviation',1,TRUE)
a<-table.element(a, mysum$sigma)
a<-table.row.end(a)
a<-table.row.start(a)
a<-table.element(a, 'Sum Squared Residuals',1,TRUE)
a<-table.element(a, sum(myerror*myerror))
a<-table.row.end(a)
a<-table.end(a)
table.save(a,file='mytable3.tab')
a<-table.start()
a<-table.row.start(a)
a<-table.element(a, 'Multiple Linear Regression - Actuals, Interpolation, and Residuals', 4, TRUE)
a<-table.row.end(a)
a<-table.row.start(a)
a<-table.element(a, 'Time or Index', 1, TRUE)
a<-table.element(a, 'Actuals', 1, TRUE)
a<-table.element(a, 'Interpolation
Forecast', 1, TRUE)
a<-table.element(a, 'Residuals
Prediction Error', 1, TRUE)
a<-table.row.end(a)
for (i in 1:n) {
a<-table.row.start(a)
a<-table.element(a,i, 1, TRUE)
a<-table.element(a,x[i])
a<-table.element(a,x[i]-mysum$resid[i])
a<-table.element(a,mysum$resid[i])
a<-table.row.end(a)
}
a<-table.end(a)
table.save(a,file='mytable4.tab')
if (n > n25) {
a<-table.start()
a<-table.row.start(a)
a<-table.element(a,'Goldfeld-Quandt test for Heteroskedasticity',4,TRUE)
a<-table.row.end(a)
a<-table.row.start(a)
a<-table.element(a,'p-values',header=TRUE)
a<-table.element(a,'Alternative Hypothesis',3,header=TRUE)
a<-table.row.end(a)
a<-table.row.start(a)
a<-table.element(a,'breakpoint index',header=TRUE)
a<-table.element(a,'greater',header=TRUE)
a<-table.element(a,'2-sided',header=TRUE)
a<-table.element(a,'less',header=TRUE)
a<-table.row.end(a)
for (mypoint in kp3:nmkm3) {
a<-table.row.start(a)
a<-table.element(a,mypoint,header=TRUE)
a<-table.element(a,gqarr[mypoint-kp3+1,1])
a<-table.element(a,gqarr[mypoint-kp3+1,2])
a<-table.element(a,gqarr[mypoint-kp3+1,3])
a<-table.row.end(a)
}
a<-table.end(a)
table.save(a,file='mytable5.tab')
a<-table.start()
a<-table.row.start(a)
a<-table.element(a,'Meta Analysis of Goldfeld-Quandt test for Heteroskedasticity',4,TRUE)
a<-table.row.end(a)
a<-table.row.start(a)
a<-table.element(a,'Description',header=TRUE)
a<-table.element(a,'# significant tests',header=TRUE)
a<-table.element(a,'% significant tests',header=TRUE)
a<-table.element(a,'OK/NOK',header=TRUE)
a<-table.row.end(a)
a<-table.row.start(a)
a<-table.element(a,'1% type I error level',header=TRUE)
a<-table.element(a,numsignificant1)
a<-table.element(a,numsignificant1/numgqtests)
if (numsignificant1/numgqtests < 0.01) dum <- 'OK' else dum <- 'NOK'
a<-table.element(a,dum)
a<-table.row.end(a)
a<-table.row.start(a)
a<-table.element(a,'5% type I error level',header=TRUE)
a<-table.element(a,numsignificant5)
a<-table.element(a,numsignificant5/numgqtests)
if (numsignificant5/numgqtests < 0.05) dum <- 'OK' else dum <- 'NOK'
a<-table.element(a,dum)
a<-table.row.end(a)
a<-table.row.start(a)
a<-table.element(a,'10% type I error level',header=TRUE)
a<-table.element(a,numsignificant10)
a<-table.element(a,numsignificant10/numgqtests)
if (numsignificant10/numgqtests < 0.1) dum <- 'OK' else dum <- 'NOK'
a<-table.element(a,dum)
a<-table.row.end(a)
a<-table.end(a)
table.save(a,file='mytable6.tab')
}