Free Statistics

of Irreproducible Research!

Author's title

Author*The author of this computation has been verified*
R Software Modulerwasp_multipleregression.wasp
Title produced by softwareMultiple Regression
Date of computationThu, 19 Nov 2009 13:38:54 -0700
Cite this page as followsStatistical Computations at FreeStatistics.org, Office for Research Development and Education, URL https://freestatistics.org/blog/index.php?v=date/2009/Nov/19/t1258663194avt1561g1ekoyrr.htm/, Retrieved Sat, 20 Apr 2024 09:34:58 +0000
Statistical Computations at FreeStatistics.org, Office for Research Development and Education, URL https://freestatistics.org/blog/index.php?pk=57942, Retrieved Sat, 20 Apr 2024 09:34:58 +0000
QR Codes:

Original text written by user:
IsPrivate?No (this computation is public)
User-defined keywords
Estimated Impact190
Family? (F = Feedback message, R = changed R code, M = changed R Module, P = changed Parameters, D = changed Data)
-     [Multiple Regression] [Q1 The Seatbeltlaw] [2007-11-14 19:27:43] [8cd6641b921d30ebe00b648d1481bba0]
- RM D  [Multiple Regression] [Seatbelt] [2009-11-12 14:10:54] [b98453cac15ba1066b407e146608df68]
F R PD    [Multiple Regression] [Model 1] [2009-11-19 20:32:12] [c0117c881d5fcd069841276db0c34efe]
F    D        [Multiple Regression] [Model 2] [2009-11-19 20:38:54] [d5837f25ec8937f9733a894c487f865c] [Current]
-               [Multiple Regression] [Model 3] [2009-11-19 20:41:09] [c0117c881d5fcd069841276db0c34efe]
-    D            [Multiple Regression] [Model 4] [2009-11-19 20:47:35] [c0117c881d5fcd069841276db0c34efe]
-   PD              [Multiple Regression] [Model 5] [2009-11-20 15:42:18] [c0117c881d5fcd069841276db0c34efe]
Feedback Forum
2009-11-21 08:20:16 [] [reply
de adjusted R²square is 63%, wat betekent dat dit model 63% verklaart van de spreiding van de variabele, maw 63% wordt verklaard door de verandering van de rentevoet.
2009-11-21 08:23:55 [d41d8cd98f00b204e9800998ecf8427e] [reply
sorry, feedback hierboven hoort bij model 1

Post a new message
Dataseries X:
3	101.2
3.21	101.1
3.37	100.7
3.51	100.1
3.75	99.9
4.11	99.7
4.25	99.5
4.25	99.2
4.5	99
4.7	99
4.75	99.3
4.75	99.5
4.75	99.7
4.75	100
4.75	100.4
4.75	100.6
4.58	100.7
4.5	100.7
4.5	100.6
4.49	100.5
4.03	100.6
3.75	100.5
3.39	100.4
3.25	100.3
3.25	100.4
3.25	100.4
3.25	100.4
3.25	100.4
3.25	100.4
3.25	100.5
3.25	100.6
3.25	100.6
3.25	100.5
3.25	100.5
3.25	100.7
2.85	101.1
2.75	101.5
2.75	101.9
2.55	102.1
2.5	102.1
2.5	102.1
2.1	102.4
2	102.8
2	103.1
2	103.1
2	102.9
2	102.4
2	101.9
2	101.3
2	100.7
2	100.6
2	101
2	101.5
2	101.9
2	102.1
2	102.3
2	102.5
2	102.9
2	103.6
2	104.3


Summary of computational transaction
Raw Inputview raw input (R code)
Raw Outputview raw output of R engine
Computing time4 seconds
R Server'Gwilym Jenkins' @ 72.249.127.135

\begin{tabular}{lllllllll}
\hline
Summary of computational transaction \tabularnewline
Raw Input & view raw input (R code)  \tabularnewline
Raw Output & view raw output of R engine  \tabularnewline
Computing time & 4 seconds \tabularnewline
R Server & 'Gwilym Jenkins' @ 72.249.127.135 \tabularnewline
\hline
\end{tabular}
%Source: https://freestatistics.org/blog/index.php?pk=57942&T=0

[TABLE]
[ROW][C]Summary of computational transaction[/C][/ROW]
[ROW][C]Raw Input[/C][C]view raw input (R code) [/C][/ROW]
[ROW][C]Raw Output[/C][C]view raw output of R engine [/C][/ROW]
[ROW][C]Computing time[/C][C]4 seconds[/C][/ROW]
[ROW][C]R Server[/C][C]'Gwilym Jenkins' @ 72.249.127.135[/C][/ROW]
[/TABLE]
Source: https://freestatistics.org/blog/index.php?pk=57942&T=0

Globally Unique Identifier (entire table): ba.freestatistics.org/blog/index.php?pk=57942&T=0

As an alternative you can also use a QR Code:  

The GUIDs for individual cells are displayed in the table below:

Summary of computational transaction
Raw Inputview raw input (R code)
Raw Outputview raw output of R engine
Computing time4 seconds
R Server'Gwilym Jenkins' @ 72.249.127.135


Multiple Linear Regression - Estimated Regression Equation
Tprod[t] = + 104.239014386218 -0.949163093002725Rente[t] -0.429150643259583M1[t] -0.389285793353394M2[t] -0.376879098097416M3[t] -0.35979416242337M4[t] -0.266505879121328M5[t] -0.169285793353391M6[t] -0.0816924886093766M7[t] -0.0635908147953803M8[t] -0.103455664701495M9[t] -0.0986422741895337M10[t] -0.037490385955704M11[t] + e[t]

\begin{tabular}{lllllllll}
\hline
Multiple Linear Regression - Estimated Regression Equation \tabularnewline
Tprod[t] =  +  104.239014386218 -0.949163093002725Rente[t] -0.429150643259583M1[t] -0.389285793353394M2[t] -0.376879098097416M3[t] -0.35979416242337M4[t] -0.266505879121328M5[t] -0.169285793353391M6[t] -0.0816924886093766M7[t] -0.0635908147953803M8[t] -0.103455664701495M9[t] -0.0986422741895337M10[t] -0.037490385955704M11[t]  + e[t] \tabularnewline
\hline
\end{tabular}
%Source: https://freestatistics.org/blog/index.php?pk=57942&T=1

[TABLE]
[ROW][C]Multiple Linear Regression - Estimated Regression Equation[/C][/ROW]
[ROW][C]Tprod[t] =  +  104.239014386218 -0.949163093002725Rente[t] -0.429150643259583M1[t] -0.389285793353394M2[t] -0.376879098097416M3[t] -0.35979416242337M4[t] -0.266505879121328M5[t] -0.169285793353391M6[t] -0.0816924886093766M7[t] -0.0635908147953803M8[t] -0.103455664701495M9[t] -0.0986422741895337M10[t] -0.037490385955704M11[t]  + e[t][/C][/ROW]
[/TABLE]
Source: https://freestatistics.org/blog/index.php?pk=57942&T=1

Globally Unique Identifier (entire table): ba.freestatistics.org/blog/index.php?pk=57942&T=1

As an alternative you can also use a QR Code:  

The GUIDs for individual cells are displayed in the table below:

Multiple Linear Regression - Estimated Regression Equation
Tprod[t] = + 104.239014386218 -0.949163093002725Rente[t] -0.429150643259583M1[t] -0.389285793353394M2[t] -0.376879098097416M3[t] -0.35979416242337M4[t] -0.266505879121328M5[t] -0.169285793353391M6[t] -0.0816924886093766M7[t] -0.0635908147953803M8[t] -0.103455664701495M9[t] -0.0986422741895337M10[t] -0.037490385955704M11[t] + e[t]


Multiple Linear Regression - Ordinary Least Squares
VariableParameterS.D.T-STATH0: parameter = 02-tail p-value1-tail p-value
(Intercept)104.2390143862180.460177226.519600
Rente-0.9491630930027250.101565-9.345400
M1-0.4291506432595830.49181-0.87260.387320.19366
M2-0.3892857933533940.491987-0.79130.4327720.216386
M3-0.3768790980974160.49195-0.76610.4474520.223726
M4-0.359794162423370.492035-0.73120.4682640.234132
M5-0.2665058791213280.492105-0.54160.5906770.295339
M6-0.1692857933533910.491987-0.34410.7323160.366158
M7-0.08169248860937660.492025-0.1660.8688430.434421
M8-0.06359081479538030.492015-0.12920.8977150.448857
M9-0.1034556647014950.491833-0.21030.8343060.417153
M10-0.09864227418953370.491773-0.20060.8418890.420944
M11-0.0374903859557040.491592-0.07630.9395330.469767

\begin{tabular}{lllllllll}
\hline
Multiple Linear Regression - Ordinary Least Squares \tabularnewline
Variable & Parameter & S.D. & T-STATH0: parameter = 0 & 2-tail p-value & 1-tail p-value \tabularnewline
(Intercept) & 104.239014386218 & 0.460177 & 226.5196 & 0 & 0 \tabularnewline
Rente & -0.949163093002725 & 0.101565 & -9.3454 & 0 & 0 \tabularnewline
M1 & -0.429150643259583 & 0.49181 & -0.8726 & 0.38732 & 0.19366 \tabularnewline
M2 & -0.389285793353394 & 0.491987 & -0.7913 & 0.432772 & 0.216386 \tabularnewline
M3 & -0.376879098097416 & 0.49195 & -0.7661 & 0.447452 & 0.223726 \tabularnewline
M4 & -0.35979416242337 & 0.492035 & -0.7312 & 0.468264 & 0.234132 \tabularnewline
M5 & -0.266505879121328 & 0.492105 & -0.5416 & 0.590677 & 0.295339 \tabularnewline
M6 & -0.169285793353391 & 0.491987 & -0.3441 & 0.732316 & 0.366158 \tabularnewline
M7 & -0.0816924886093766 & 0.492025 & -0.166 & 0.868843 & 0.434421 \tabularnewline
M8 & -0.0635908147953803 & 0.492015 & -0.1292 & 0.897715 & 0.448857 \tabularnewline
M9 & -0.103455664701495 & 0.491833 & -0.2103 & 0.834306 & 0.417153 \tabularnewline
M10 & -0.0986422741895337 & 0.491773 & -0.2006 & 0.841889 & 0.420944 \tabularnewline
M11 & -0.037490385955704 & 0.491592 & -0.0763 & 0.939533 & 0.469767 \tabularnewline
\hline
\end{tabular}
%Source: https://freestatistics.org/blog/index.php?pk=57942&T=2

[TABLE]
[ROW][C]Multiple Linear Regression - Ordinary Least Squares[/C][/ROW]
[ROW][C]Variable[/C][C]Parameter[/C][C]S.D.[/C][C]T-STATH0: parameter = 0[/C][C]2-tail p-value[/C][C]1-tail p-value[/C][/ROW]
[ROW][C](Intercept)[/C][C]104.239014386218[/C][C]0.460177[/C][C]226.5196[/C][C]0[/C][C]0[/C][/ROW]
[ROW][C]Rente[/C][C]-0.949163093002725[/C][C]0.101565[/C][C]-9.3454[/C][C]0[/C][C]0[/C][/ROW]
[ROW][C]M1[/C][C]-0.429150643259583[/C][C]0.49181[/C][C]-0.8726[/C][C]0.38732[/C][C]0.19366[/C][/ROW]
[ROW][C]M2[/C][C]-0.389285793353394[/C][C]0.491987[/C][C]-0.7913[/C][C]0.432772[/C][C]0.216386[/C][/ROW]
[ROW][C]M3[/C][C]-0.376879098097416[/C][C]0.49195[/C][C]-0.7661[/C][C]0.447452[/C][C]0.223726[/C][/ROW]
[ROW][C]M4[/C][C]-0.35979416242337[/C][C]0.492035[/C][C]-0.7312[/C][C]0.468264[/C][C]0.234132[/C][/ROW]
[ROW][C]M5[/C][C]-0.266505879121328[/C][C]0.492105[/C][C]-0.5416[/C][C]0.590677[/C][C]0.295339[/C][/ROW]
[ROW][C]M6[/C][C]-0.169285793353391[/C][C]0.491987[/C][C]-0.3441[/C][C]0.732316[/C][C]0.366158[/C][/ROW]
[ROW][C]M7[/C][C]-0.0816924886093766[/C][C]0.492025[/C][C]-0.166[/C][C]0.868843[/C][C]0.434421[/C][/ROW]
[ROW][C]M8[/C][C]-0.0635908147953803[/C][C]0.492015[/C][C]-0.1292[/C][C]0.897715[/C][C]0.448857[/C][/ROW]
[ROW][C]M9[/C][C]-0.103455664701495[/C][C]0.491833[/C][C]-0.2103[/C][C]0.834306[/C][C]0.417153[/C][/ROW]
[ROW][C]M10[/C][C]-0.0986422741895337[/C][C]0.491773[/C][C]-0.2006[/C][C]0.841889[/C][C]0.420944[/C][/ROW]
[ROW][C]M11[/C][C]-0.037490385955704[/C][C]0.491592[/C][C]-0.0763[/C][C]0.939533[/C][C]0.469767[/C][/ROW]
[/TABLE]
Source: https://freestatistics.org/blog/index.php?pk=57942&T=2

Globally Unique Identifier (entire table): ba.freestatistics.org/blog/index.php?pk=57942&T=2

As an alternative you can also use a QR Code:  

The GUIDs for individual cells are displayed in the table below:

Multiple Linear Regression - Ordinary Least Squares
VariableParameterS.D.T-STATH0: parameter = 02-tail p-value1-tail p-value
(Intercept)104.2390143862180.460177226.519600
Rente-0.9491630930027250.101565-9.345400
M1-0.4291506432595830.49181-0.87260.387320.19366
M2-0.3892857933533940.491987-0.79130.4327720.216386
M3-0.3768790980974160.49195-0.76610.4474520.223726
M4-0.359794162423370.492035-0.73120.4682640.234132
M5-0.2665058791213280.492105-0.54160.5906770.295339
M6-0.1692857933533910.491987-0.34410.7323160.366158
M7-0.08169248860937660.492025-0.1660.8688430.434421
M8-0.06359081479538030.492015-0.12920.8977150.448857
M9-0.1034556647014950.491833-0.21030.8343060.417153
M10-0.09864227418953370.491773-0.20060.8418890.420944
M11-0.0374903859557040.491592-0.07630.9395330.469767


Multiple Linear Regression - Regression Statistics
Multiple R0.811936829502331
R-squared0.659241415102298
Adjusted R-squared0.572239223213523
F-TEST (value)7.57729662656181
F-TEST (DF numerator)12
F-TEST (DF denominator)47
p-value1.54445368716338e-07
Multiple Linear Regression - Residual Statistics
Residual Standard Deviation0.77708225964867
Sum Squared Residuals28.3812713982522

\begin{tabular}{lllllllll}
\hline
Multiple Linear Regression - Regression Statistics \tabularnewline
Multiple R & 0.811936829502331 \tabularnewline
R-squared & 0.659241415102298 \tabularnewline
Adjusted R-squared & 0.572239223213523 \tabularnewline
F-TEST (value) & 7.57729662656181 \tabularnewline
F-TEST (DF numerator) & 12 \tabularnewline
F-TEST (DF denominator) & 47 \tabularnewline
p-value & 1.54445368716338e-07 \tabularnewline
Multiple Linear Regression - Residual Statistics \tabularnewline
Residual Standard Deviation & 0.77708225964867 \tabularnewline
Sum Squared Residuals & 28.3812713982522 \tabularnewline
\hline
\end{tabular}
%Source: https://freestatistics.org/blog/index.php?pk=57942&T=3

[TABLE]
[ROW][C]Multiple Linear Regression - Regression Statistics[/C][/ROW]
[ROW][C]Multiple R[/C][C]0.811936829502331[/C][/ROW]
[ROW][C]R-squared[/C][C]0.659241415102298[/C][/ROW]
[ROW][C]Adjusted R-squared[/C][C]0.572239223213523[/C][/ROW]
[ROW][C]F-TEST (value)[/C][C]7.57729662656181[/C][/ROW]
[ROW][C]F-TEST (DF numerator)[/C][C]12[/C][/ROW]
[ROW][C]F-TEST (DF denominator)[/C][C]47[/C][/ROW]
[ROW][C]p-value[/C][C]1.54445368716338e-07[/C][/ROW]
[ROW][C]Multiple Linear Regression - Residual Statistics[/C][/ROW]
[ROW][C]Residual Standard Deviation[/C][C]0.77708225964867[/C][/ROW]
[ROW][C]Sum Squared Residuals[/C][C]28.3812713982522[/C][/ROW]
[/TABLE]
Source: https://freestatistics.org/blog/index.php?pk=57942&T=3

Globally Unique Identifier (entire table): ba.freestatistics.org/blog/index.php?pk=57942&T=3

As an alternative you can also use a QR Code:  

The GUIDs for individual cells are displayed in the table below:

Multiple Linear Regression - Regression Statistics
Multiple R0.811936829502331
R-squared0.659241415102298
Adjusted R-squared0.572239223213523
F-TEST (value)7.57729662656181
F-TEST (DF numerator)12
F-TEST (DF denominator)47
p-value1.54445368716338e-07
Multiple Linear Regression - Residual Statistics
Residual Standard Deviation0.77708225964867
Sum Squared Residuals28.3812713982522


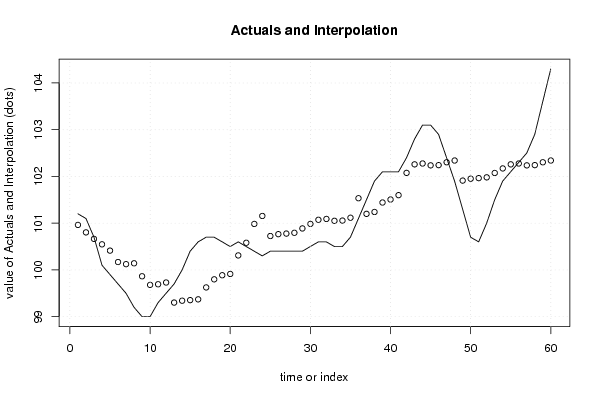
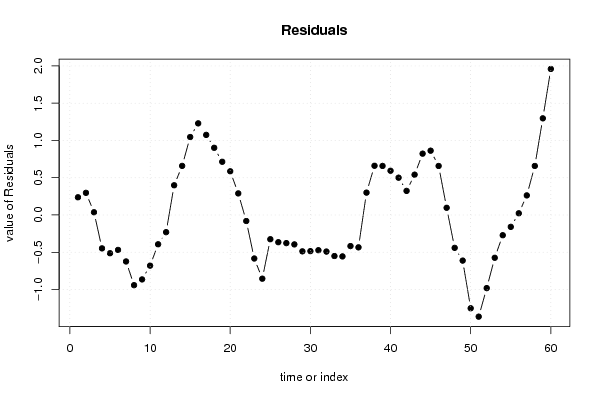
Multiple Linear Regression - Actuals, Interpolation, and Residuals
Time or IndexActualsInterpolationForecastResidualsPrediction Error
1101.2100.9623744639510.237625536049289
2101.1100.8029150643260.297084935674034
3100.7100.6634556647010.0365443352985084
4100.1100.547657767355-0.447657767355165
599.9100.413146908337-0.513146908336542
699.7100.168668280624-0.4686682806235
799.5100.123378752347-0.623378752347136
899.2100.141480426161-0.94148042616113
99999.8643248030043-0.864324803004337
109999.6793055749158-0.679305574915753
1199.399.6929993084995-0.39299930849945
1299.599.7304896944551-0.230489694455151
1399.799.30133905119560.398660948804435
1410099.34120390110170.658796098898244
15100.499.35361059635771.04638940364227
16100.699.37069553203181.22930446796821
17100.799.62534154114431.07465845885572
18100.799.79849467435240.901505325647562
19100.699.88608797909650.713912020903539
20100.599.91368128384050.586318716159522
21100.6100.3104314567160.289568543284378
22100.5100.581010513268-0.081010513268341
23100.4100.983861114983-0.583861114983145
24100.3101.154234333959-0.85423433395924
25100.4100.725083690700-0.325083690699647
26100.4100.764948540606-0.364948540605836
27100.4100.777355235862-0.377355235861815
28100.4100.794440171536-0.394440171535861
29100.4100.887728454838-0.487728454837904
30100.5100.984948540606-0.484948540605845
31100.6101.072541845350-0.472541845349865
32100.6101.090643519164-0.490643519163862
33100.5101.050778669258-0.550778669257742
34100.5101.055592059770-0.555592059769703
35100.7101.116743948004-0.41674394800353
36101.1101.533899571160-0.433899571160332
37101.5101.1996652372010.300334762798985
38101.9101.2395300871070.660469912892802
39102.1101.4417694009640.658230599036267
40102.1101.5063124912880.593687508712085
41102.1101.599600774590.500399225410042
42102.4102.0764860975590.323513902441028
43102.8102.2589957116030.541004288396733
44103.1102.2770973854170.822902614582734
45103.1102.2372325355110.862767464488848
46102.9102.2420459260230.657954073976898
47102.4102.3031978142570.0968021857430683
48101.9102.340688200213-0.440688200212636
49101.3101.911537556953-0.61153755695306
50100.7101.951402406859-1.25140240685924
51100.6101.963809102115-1.36380910211523
52101101.980894037789-0.980894037789271
53101.5102.074182321091-0.574182321091314
54101.9102.171402406859-0.271402406859245
55102.1102.258995711603-0.158995711603270
56102.3102.2770973854170.0229026145827360
57102.5102.2372325355110.262767464488854
58102.9102.2420459260230.657954073976898
59103.6102.3031978142571.29680218574306
60104.3102.3406882002131.95931179978736

\begin{tabular}{lllllllll}
\hline
Multiple Linear Regression - Actuals, Interpolation, and Residuals \tabularnewline
Time or Index & Actuals & InterpolationForecast & ResidualsPrediction Error \tabularnewline
1 & 101.2 & 100.962374463951 & 0.237625536049289 \tabularnewline
2 & 101.1 & 100.802915064326 & 0.297084935674034 \tabularnewline
3 & 100.7 & 100.663455664701 & 0.0365443352985084 \tabularnewline
4 & 100.1 & 100.547657767355 & -0.447657767355165 \tabularnewline
5 & 99.9 & 100.413146908337 & -0.513146908336542 \tabularnewline
6 & 99.7 & 100.168668280624 & -0.4686682806235 \tabularnewline
7 & 99.5 & 100.123378752347 & -0.623378752347136 \tabularnewline
8 & 99.2 & 100.141480426161 & -0.94148042616113 \tabularnewline
9 & 99 & 99.8643248030043 & -0.864324803004337 \tabularnewline
10 & 99 & 99.6793055749158 & -0.679305574915753 \tabularnewline
11 & 99.3 & 99.6929993084995 & -0.39299930849945 \tabularnewline
12 & 99.5 & 99.7304896944551 & -0.230489694455151 \tabularnewline
13 & 99.7 & 99.3013390511956 & 0.398660948804435 \tabularnewline
14 & 100 & 99.3412039011017 & 0.658796098898244 \tabularnewline
15 & 100.4 & 99.3536105963577 & 1.04638940364227 \tabularnewline
16 & 100.6 & 99.3706955320318 & 1.22930446796821 \tabularnewline
17 & 100.7 & 99.6253415411443 & 1.07465845885572 \tabularnewline
18 & 100.7 & 99.7984946743524 & 0.901505325647562 \tabularnewline
19 & 100.6 & 99.8860879790965 & 0.713912020903539 \tabularnewline
20 & 100.5 & 99.9136812838405 & 0.586318716159522 \tabularnewline
21 & 100.6 & 100.310431456716 & 0.289568543284378 \tabularnewline
22 & 100.5 & 100.581010513268 & -0.081010513268341 \tabularnewline
23 & 100.4 & 100.983861114983 & -0.583861114983145 \tabularnewline
24 & 100.3 & 101.154234333959 & -0.85423433395924 \tabularnewline
25 & 100.4 & 100.725083690700 & -0.325083690699647 \tabularnewline
26 & 100.4 & 100.764948540606 & -0.364948540605836 \tabularnewline
27 & 100.4 & 100.777355235862 & -0.377355235861815 \tabularnewline
28 & 100.4 & 100.794440171536 & -0.394440171535861 \tabularnewline
29 & 100.4 & 100.887728454838 & -0.487728454837904 \tabularnewline
30 & 100.5 & 100.984948540606 & -0.484948540605845 \tabularnewline
31 & 100.6 & 101.072541845350 & -0.472541845349865 \tabularnewline
32 & 100.6 & 101.090643519164 & -0.490643519163862 \tabularnewline
33 & 100.5 & 101.050778669258 & -0.550778669257742 \tabularnewline
34 & 100.5 & 101.055592059770 & -0.555592059769703 \tabularnewline
35 & 100.7 & 101.116743948004 & -0.41674394800353 \tabularnewline
36 & 101.1 & 101.533899571160 & -0.433899571160332 \tabularnewline
37 & 101.5 & 101.199665237201 & 0.300334762798985 \tabularnewline
38 & 101.9 & 101.239530087107 & 0.660469912892802 \tabularnewline
39 & 102.1 & 101.441769400964 & 0.658230599036267 \tabularnewline
40 & 102.1 & 101.506312491288 & 0.593687508712085 \tabularnewline
41 & 102.1 & 101.59960077459 & 0.500399225410042 \tabularnewline
42 & 102.4 & 102.076486097559 & 0.323513902441028 \tabularnewline
43 & 102.8 & 102.258995711603 & 0.541004288396733 \tabularnewline
44 & 103.1 & 102.277097385417 & 0.822902614582734 \tabularnewline
45 & 103.1 & 102.237232535511 & 0.862767464488848 \tabularnewline
46 & 102.9 & 102.242045926023 & 0.657954073976898 \tabularnewline
47 & 102.4 & 102.303197814257 & 0.0968021857430683 \tabularnewline
48 & 101.9 & 102.340688200213 & -0.440688200212636 \tabularnewline
49 & 101.3 & 101.911537556953 & -0.61153755695306 \tabularnewline
50 & 100.7 & 101.951402406859 & -1.25140240685924 \tabularnewline
51 & 100.6 & 101.963809102115 & -1.36380910211523 \tabularnewline
52 & 101 & 101.980894037789 & -0.980894037789271 \tabularnewline
53 & 101.5 & 102.074182321091 & -0.574182321091314 \tabularnewline
54 & 101.9 & 102.171402406859 & -0.271402406859245 \tabularnewline
55 & 102.1 & 102.258995711603 & -0.158995711603270 \tabularnewline
56 & 102.3 & 102.277097385417 & 0.0229026145827360 \tabularnewline
57 & 102.5 & 102.237232535511 & 0.262767464488854 \tabularnewline
58 & 102.9 & 102.242045926023 & 0.657954073976898 \tabularnewline
59 & 103.6 & 102.303197814257 & 1.29680218574306 \tabularnewline
60 & 104.3 & 102.340688200213 & 1.95931179978736 \tabularnewline
\hline
\end{tabular}
%Source: https://freestatistics.org/blog/index.php?pk=57942&T=4

[TABLE]
[ROW][C]Multiple Linear Regression - Actuals, Interpolation, and Residuals[/C][/ROW]
[ROW][C]Time or Index[/C][C]Actuals[/C][C]InterpolationForecast[/C][C]ResidualsPrediction Error[/C][/ROW]
[ROW][C]1[/C][C]101.2[/C][C]100.962374463951[/C][C]0.237625536049289[/C][/ROW]
[ROW][C]2[/C][C]101.1[/C][C]100.802915064326[/C][C]0.297084935674034[/C][/ROW]
[ROW][C]3[/C][C]100.7[/C][C]100.663455664701[/C][C]0.0365443352985084[/C][/ROW]
[ROW][C]4[/C][C]100.1[/C][C]100.547657767355[/C][C]-0.447657767355165[/C][/ROW]
[ROW][C]5[/C][C]99.9[/C][C]100.413146908337[/C][C]-0.513146908336542[/C][/ROW]
[ROW][C]6[/C][C]99.7[/C][C]100.168668280624[/C][C]-0.4686682806235[/C][/ROW]
[ROW][C]7[/C][C]99.5[/C][C]100.123378752347[/C][C]-0.623378752347136[/C][/ROW]
[ROW][C]8[/C][C]99.2[/C][C]100.141480426161[/C][C]-0.94148042616113[/C][/ROW]
[ROW][C]9[/C][C]99[/C][C]99.8643248030043[/C][C]-0.864324803004337[/C][/ROW]
[ROW][C]10[/C][C]99[/C][C]99.6793055749158[/C][C]-0.679305574915753[/C][/ROW]
[ROW][C]11[/C][C]99.3[/C][C]99.6929993084995[/C][C]-0.39299930849945[/C][/ROW]
[ROW][C]12[/C][C]99.5[/C][C]99.7304896944551[/C][C]-0.230489694455151[/C][/ROW]
[ROW][C]13[/C][C]99.7[/C][C]99.3013390511956[/C][C]0.398660948804435[/C][/ROW]
[ROW][C]14[/C][C]100[/C][C]99.3412039011017[/C][C]0.658796098898244[/C][/ROW]
[ROW][C]15[/C][C]100.4[/C][C]99.3536105963577[/C][C]1.04638940364227[/C][/ROW]
[ROW][C]16[/C][C]100.6[/C][C]99.3706955320318[/C][C]1.22930446796821[/C][/ROW]
[ROW][C]17[/C][C]100.7[/C][C]99.6253415411443[/C][C]1.07465845885572[/C][/ROW]
[ROW][C]18[/C][C]100.7[/C][C]99.7984946743524[/C][C]0.901505325647562[/C][/ROW]
[ROW][C]19[/C][C]100.6[/C][C]99.8860879790965[/C][C]0.713912020903539[/C][/ROW]
[ROW][C]20[/C][C]100.5[/C][C]99.9136812838405[/C][C]0.586318716159522[/C][/ROW]
[ROW][C]21[/C][C]100.6[/C][C]100.310431456716[/C][C]0.289568543284378[/C][/ROW]
[ROW][C]22[/C][C]100.5[/C][C]100.581010513268[/C][C]-0.081010513268341[/C][/ROW]
[ROW][C]23[/C][C]100.4[/C][C]100.983861114983[/C][C]-0.583861114983145[/C][/ROW]
[ROW][C]24[/C][C]100.3[/C][C]101.154234333959[/C][C]-0.85423433395924[/C][/ROW]
[ROW][C]25[/C][C]100.4[/C][C]100.725083690700[/C][C]-0.325083690699647[/C][/ROW]
[ROW][C]26[/C][C]100.4[/C][C]100.764948540606[/C][C]-0.364948540605836[/C][/ROW]
[ROW][C]27[/C][C]100.4[/C][C]100.777355235862[/C][C]-0.377355235861815[/C][/ROW]
[ROW][C]28[/C][C]100.4[/C][C]100.794440171536[/C][C]-0.394440171535861[/C][/ROW]
[ROW][C]29[/C][C]100.4[/C][C]100.887728454838[/C][C]-0.487728454837904[/C][/ROW]
[ROW][C]30[/C][C]100.5[/C][C]100.984948540606[/C][C]-0.484948540605845[/C][/ROW]
[ROW][C]31[/C][C]100.6[/C][C]101.072541845350[/C][C]-0.472541845349865[/C][/ROW]
[ROW][C]32[/C][C]100.6[/C][C]101.090643519164[/C][C]-0.490643519163862[/C][/ROW]
[ROW][C]33[/C][C]100.5[/C][C]101.050778669258[/C][C]-0.550778669257742[/C][/ROW]
[ROW][C]34[/C][C]100.5[/C][C]101.055592059770[/C][C]-0.555592059769703[/C][/ROW]
[ROW][C]35[/C][C]100.7[/C][C]101.116743948004[/C][C]-0.41674394800353[/C][/ROW]
[ROW][C]36[/C][C]101.1[/C][C]101.533899571160[/C][C]-0.433899571160332[/C][/ROW]
[ROW][C]37[/C][C]101.5[/C][C]101.199665237201[/C][C]0.300334762798985[/C][/ROW]
[ROW][C]38[/C][C]101.9[/C][C]101.239530087107[/C][C]0.660469912892802[/C][/ROW]
[ROW][C]39[/C][C]102.1[/C][C]101.441769400964[/C][C]0.658230599036267[/C][/ROW]
[ROW][C]40[/C][C]102.1[/C][C]101.506312491288[/C][C]0.593687508712085[/C][/ROW]
[ROW][C]41[/C][C]102.1[/C][C]101.59960077459[/C][C]0.500399225410042[/C][/ROW]
[ROW][C]42[/C][C]102.4[/C][C]102.076486097559[/C][C]0.323513902441028[/C][/ROW]
[ROW][C]43[/C][C]102.8[/C][C]102.258995711603[/C][C]0.541004288396733[/C][/ROW]
[ROW][C]44[/C][C]103.1[/C][C]102.277097385417[/C][C]0.822902614582734[/C][/ROW]
[ROW][C]45[/C][C]103.1[/C][C]102.237232535511[/C][C]0.862767464488848[/C][/ROW]
[ROW][C]46[/C][C]102.9[/C][C]102.242045926023[/C][C]0.657954073976898[/C][/ROW]
[ROW][C]47[/C][C]102.4[/C][C]102.303197814257[/C][C]0.0968021857430683[/C][/ROW]
[ROW][C]48[/C][C]101.9[/C][C]102.340688200213[/C][C]-0.440688200212636[/C][/ROW]
[ROW][C]49[/C][C]101.3[/C][C]101.911537556953[/C][C]-0.61153755695306[/C][/ROW]
[ROW][C]50[/C][C]100.7[/C][C]101.951402406859[/C][C]-1.25140240685924[/C][/ROW]
[ROW][C]51[/C][C]100.6[/C][C]101.963809102115[/C][C]-1.36380910211523[/C][/ROW]
[ROW][C]52[/C][C]101[/C][C]101.980894037789[/C][C]-0.980894037789271[/C][/ROW]
[ROW][C]53[/C][C]101.5[/C][C]102.074182321091[/C][C]-0.574182321091314[/C][/ROW]
[ROW][C]54[/C][C]101.9[/C][C]102.171402406859[/C][C]-0.271402406859245[/C][/ROW]
[ROW][C]55[/C][C]102.1[/C][C]102.258995711603[/C][C]-0.158995711603270[/C][/ROW]
[ROW][C]56[/C][C]102.3[/C][C]102.277097385417[/C][C]0.0229026145827360[/C][/ROW]
[ROW][C]57[/C][C]102.5[/C][C]102.237232535511[/C][C]0.262767464488854[/C][/ROW]
[ROW][C]58[/C][C]102.9[/C][C]102.242045926023[/C][C]0.657954073976898[/C][/ROW]
[ROW][C]59[/C][C]103.6[/C][C]102.303197814257[/C][C]1.29680218574306[/C][/ROW]
[ROW][C]60[/C][C]104.3[/C][C]102.340688200213[/C][C]1.95931179978736[/C][/ROW]
[/TABLE]
Source: https://freestatistics.org/blog/index.php?pk=57942&T=4

Globally Unique Identifier (entire table): ba.freestatistics.org/blog/index.php?pk=57942&T=4

As an alternative you can also use a QR Code:  

The GUIDs for individual cells are displayed in the table below:

Multiple Linear Regression - Actuals, Interpolation, and Residuals
Time or IndexActualsInterpolationForecastResidualsPrediction Error
1101.2100.9623744639510.237625536049289
2101.1100.8029150643260.297084935674034
3100.7100.6634556647010.0365443352985084
4100.1100.547657767355-0.447657767355165
599.9100.413146908337-0.513146908336542
699.7100.168668280624-0.4686682806235
799.5100.123378752347-0.623378752347136
899.2100.141480426161-0.94148042616113
99999.8643248030043-0.864324803004337
109999.6793055749158-0.679305574915753
1199.399.6929993084995-0.39299930849945
1299.599.7304896944551-0.230489694455151
1399.799.30133905119560.398660948804435
1410099.34120390110170.658796098898244
15100.499.35361059635771.04638940364227
16100.699.37069553203181.22930446796821
17100.799.62534154114431.07465845885572
18100.799.79849467435240.901505325647562
19100.699.88608797909650.713912020903539
20100.599.91368128384050.586318716159522
21100.6100.3104314567160.289568543284378
22100.5100.581010513268-0.081010513268341
23100.4100.983861114983-0.583861114983145
24100.3101.154234333959-0.85423433395924
25100.4100.725083690700-0.325083690699647
26100.4100.764948540606-0.364948540605836
27100.4100.777355235862-0.377355235861815
28100.4100.794440171536-0.394440171535861
29100.4100.887728454838-0.487728454837904
30100.5100.984948540606-0.484948540605845
31100.6101.072541845350-0.472541845349865
32100.6101.090643519164-0.490643519163862
33100.5101.050778669258-0.550778669257742
34100.5101.055592059770-0.555592059769703
35100.7101.116743948004-0.41674394800353
36101.1101.533899571160-0.433899571160332
37101.5101.1996652372010.300334762798985
38101.9101.2395300871070.660469912892802
39102.1101.4417694009640.658230599036267
40102.1101.5063124912880.593687508712085
41102.1101.599600774590.500399225410042
42102.4102.0764860975590.323513902441028
43102.8102.2589957116030.541004288396733
44103.1102.2770973854170.822902614582734
45103.1102.2372325355110.862767464488848
46102.9102.2420459260230.657954073976898
47102.4102.3031978142570.0968021857430683
48101.9102.340688200213-0.440688200212636
49101.3101.911537556953-0.61153755695306
50100.7101.951402406859-1.25140240685924
51100.6101.963809102115-1.36380910211523
52101101.980894037789-0.980894037789271
53101.5102.074182321091-0.574182321091314
54101.9102.171402406859-0.271402406859245
55102.1102.258995711603-0.158995711603270
56102.3102.2770973854170.0229026145827360
57102.5102.2372325355110.262767464488854
58102.9102.2420459260230.657954073976898
59103.6102.3031978142571.29680218574306
60104.3102.3406882002131.95931179978736


Goldfeld-Quandt test for Heteroskedasticity
p-valuesAlternative Hypothesis
breakpoint indexgreater2-sidedless
160.3105351729267220.6210703458534440.689464827073278
170.3670707223317680.7341414446635360.632929277668232
180.408036097844930.816072195689860.59196390215507
190.4502055154402600.9004110308805190.54979448455974
200.5254032456780410.9491935086439180.474596754321959
210.5847768979282570.8304462041434860.415223102071743
220.5596333624056630.8807332751886750.440366637594337
230.4728482710277720.9456965420555440.527151728972228
240.3939850904250490.7879701808500970.606014909574951
250.3055184837602960.6110369675205920.694481516239704
260.2367171656078750.4734343312157490.763282834392125
270.1801540299602530.3603080599205050.819845970039747
280.1252560226989810.2505120453979620.874743977301019
290.08224957348475730.1644991469695150.917750426515243
300.05042438563514330.1008487712702870.949575614364857
310.02973464679669310.05946929359338620.970265353203307
320.01835768987870990.03671537975741970.98164231012129
330.01233617454752520.02467234909505050.987663825452475
340.01090663993233430.02181327986466860.989093360067666
350.02050226244934180.04100452489868360.979497737550658
360.1775266221759920.3550532443519850.822473377824008
370.1858739244410090.3717478488820180.814126075558991
380.1595892181216500.3191784362433010.84041078187835
390.1356631228653820.2713262457307640.864336877134618
400.1073659586275570.2147319172551130.892634041372443
410.07966888073666140.1593377614733230.920331119263339
420.04994172037049340.09988344074098680.950058279629507
430.03920182939234450.0784036587846890.960798170607656
440.03424093803349640.06848187606699270.965759061966504

\begin{tabular}{lllllllll}
\hline
Goldfeld-Quandt test for Heteroskedasticity \tabularnewline
p-values & Alternative Hypothesis \tabularnewline
breakpoint index & greater & 2-sided & less \tabularnewline
16 & 0.310535172926722 & 0.621070345853444 & 0.689464827073278 \tabularnewline
17 & 0.367070722331768 & 0.734141444663536 & 0.632929277668232 \tabularnewline
18 & 0.40803609784493 & 0.81607219568986 & 0.59196390215507 \tabularnewline
19 & 0.450205515440260 & 0.900411030880519 & 0.54979448455974 \tabularnewline
20 & 0.525403245678041 & 0.949193508643918 & 0.474596754321959 \tabularnewline
21 & 0.584776897928257 & 0.830446204143486 & 0.415223102071743 \tabularnewline
22 & 0.559633362405663 & 0.880733275188675 & 0.440366637594337 \tabularnewline
23 & 0.472848271027772 & 0.945696542055544 & 0.527151728972228 \tabularnewline
24 & 0.393985090425049 & 0.787970180850097 & 0.606014909574951 \tabularnewline
25 & 0.305518483760296 & 0.611036967520592 & 0.694481516239704 \tabularnewline
26 & 0.236717165607875 & 0.473434331215749 & 0.763282834392125 \tabularnewline
27 & 0.180154029960253 & 0.360308059920505 & 0.819845970039747 \tabularnewline
28 & 0.125256022698981 & 0.250512045397962 & 0.874743977301019 \tabularnewline
29 & 0.0822495734847573 & 0.164499146969515 & 0.917750426515243 \tabularnewline
30 & 0.0504243856351433 & 0.100848771270287 & 0.949575614364857 \tabularnewline
31 & 0.0297346467966931 & 0.0594692935933862 & 0.970265353203307 \tabularnewline
32 & 0.0183576898787099 & 0.0367153797574197 & 0.98164231012129 \tabularnewline
33 & 0.0123361745475252 & 0.0246723490950505 & 0.987663825452475 \tabularnewline
34 & 0.0109066399323343 & 0.0218132798646686 & 0.989093360067666 \tabularnewline
35 & 0.0205022624493418 & 0.0410045248986836 & 0.979497737550658 \tabularnewline
36 & 0.177526622175992 & 0.355053244351985 & 0.822473377824008 \tabularnewline
37 & 0.185873924441009 & 0.371747848882018 & 0.814126075558991 \tabularnewline
38 & 0.159589218121650 & 0.319178436243301 & 0.84041078187835 \tabularnewline
39 & 0.135663122865382 & 0.271326245730764 & 0.864336877134618 \tabularnewline
40 & 0.107365958627557 & 0.214731917255113 & 0.892634041372443 \tabularnewline
41 & 0.0796688807366614 & 0.159337761473323 & 0.920331119263339 \tabularnewline
42 & 0.0499417203704934 & 0.0998834407409868 & 0.950058279629507 \tabularnewline
43 & 0.0392018293923445 & 0.078403658784689 & 0.960798170607656 \tabularnewline
44 & 0.0342409380334964 & 0.0684818760669927 & 0.965759061966504 \tabularnewline
\hline
\end{tabular}
%Source: https://freestatistics.org/blog/index.php?pk=57942&T=5

[TABLE]
[ROW][C]Goldfeld-Quandt test for Heteroskedasticity[/C][/ROW]
[ROW][C]p-values[/C][C]Alternative Hypothesis[/C][/ROW]
[ROW][C]breakpoint index[/C][C]greater[/C][C]2-sided[/C][C]less[/C][/ROW]
[ROW][C]16[/C][C]0.310535172926722[/C][C]0.621070345853444[/C][C]0.689464827073278[/C][/ROW]
[ROW][C]17[/C][C]0.367070722331768[/C][C]0.734141444663536[/C][C]0.632929277668232[/C][/ROW]
[ROW][C]18[/C][C]0.40803609784493[/C][C]0.81607219568986[/C][C]0.59196390215507[/C][/ROW]
[ROW][C]19[/C][C]0.450205515440260[/C][C]0.900411030880519[/C][C]0.54979448455974[/C][/ROW]
[ROW][C]20[/C][C]0.525403245678041[/C][C]0.949193508643918[/C][C]0.474596754321959[/C][/ROW]
[ROW][C]21[/C][C]0.584776897928257[/C][C]0.830446204143486[/C][C]0.415223102071743[/C][/ROW]
[ROW][C]22[/C][C]0.559633362405663[/C][C]0.880733275188675[/C][C]0.440366637594337[/C][/ROW]
[ROW][C]23[/C][C]0.472848271027772[/C][C]0.945696542055544[/C][C]0.527151728972228[/C][/ROW]
[ROW][C]24[/C][C]0.393985090425049[/C][C]0.787970180850097[/C][C]0.606014909574951[/C][/ROW]
[ROW][C]25[/C][C]0.305518483760296[/C][C]0.611036967520592[/C][C]0.694481516239704[/C][/ROW]
[ROW][C]26[/C][C]0.236717165607875[/C][C]0.473434331215749[/C][C]0.763282834392125[/C][/ROW]
[ROW][C]27[/C][C]0.180154029960253[/C][C]0.360308059920505[/C][C]0.819845970039747[/C][/ROW]
[ROW][C]28[/C][C]0.125256022698981[/C][C]0.250512045397962[/C][C]0.874743977301019[/C][/ROW]
[ROW][C]29[/C][C]0.0822495734847573[/C][C]0.164499146969515[/C][C]0.917750426515243[/C][/ROW]
[ROW][C]30[/C][C]0.0504243856351433[/C][C]0.100848771270287[/C][C]0.949575614364857[/C][/ROW]
[ROW][C]31[/C][C]0.0297346467966931[/C][C]0.0594692935933862[/C][C]0.970265353203307[/C][/ROW]
[ROW][C]32[/C][C]0.0183576898787099[/C][C]0.0367153797574197[/C][C]0.98164231012129[/C][/ROW]
[ROW][C]33[/C][C]0.0123361745475252[/C][C]0.0246723490950505[/C][C]0.987663825452475[/C][/ROW]
[ROW][C]34[/C][C]0.0109066399323343[/C][C]0.0218132798646686[/C][C]0.989093360067666[/C][/ROW]
[ROW][C]35[/C][C]0.0205022624493418[/C][C]0.0410045248986836[/C][C]0.979497737550658[/C][/ROW]
[ROW][C]36[/C][C]0.177526622175992[/C][C]0.355053244351985[/C][C]0.822473377824008[/C][/ROW]
[ROW][C]37[/C][C]0.185873924441009[/C][C]0.371747848882018[/C][C]0.814126075558991[/C][/ROW]
[ROW][C]38[/C][C]0.159589218121650[/C][C]0.319178436243301[/C][C]0.84041078187835[/C][/ROW]
[ROW][C]39[/C][C]0.135663122865382[/C][C]0.271326245730764[/C][C]0.864336877134618[/C][/ROW]
[ROW][C]40[/C][C]0.107365958627557[/C][C]0.214731917255113[/C][C]0.892634041372443[/C][/ROW]
[ROW][C]41[/C][C]0.0796688807366614[/C][C]0.159337761473323[/C][C]0.920331119263339[/C][/ROW]
[ROW][C]42[/C][C]0.0499417203704934[/C][C]0.0998834407409868[/C][C]0.950058279629507[/C][/ROW]
[ROW][C]43[/C][C]0.0392018293923445[/C][C]0.078403658784689[/C][C]0.960798170607656[/C][/ROW]
[ROW][C]44[/C][C]0.0342409380334964[/C][C]0.0684818760669927[/C][C]0.965759061966504[/C][/ROW]
[/TABLE]
Source: https://freestatistics.org/blog/index.php?pk=57942&T=5

Globally Unique Identifier (entire table): ba.freestatistics.org/blog/index.php?pk=57942&T=5

As an alternative you can also use a QR Code:  

The GUIDs for individual cells are displayed in the table below:

Goldfeld-Quandt test for Heteroskedasticity
p-valuesAlternative Hypothesis
breakpoint indexgreater2-sidedless
160.3105351729267220.6210703458534440.689464827073278
170.3670707223317680.7341414446635360.632929277668232
180.408036097844930.816072195689860.59196390215507
190.4502055154402600.9004110308805190.54979448455974
200.5254032456780410.9491935086439180.474596754321959
210.5847768979282570.8304462041434860.415223102071743
220.5596333624056630.8807332751886750.440366637594337
230.4728482710277720.9456965420555440.527151728972228
240.3939850904250490.7879701808500970.606014909574951
250.3055184837602960.6110369675205920.694481516239704
260.2367171656078750.4734343312157490.763282834392125
270.1801540299602530.3603080599205050.819845970039747
280.1252560226989810.2505120453979620.874743977301019
290.08224957348475730.1644991469695150.917750426515243
300.05042438563514330.1008487712702870.949575614364857
310.02973464679669310.05946929359338620.970265353203307
320.01835768987870990.03671537975741970.98164231012129
330.01233617454752520.02467234909505050.987663825452475
340.01090663993233430.02181327986466860.989093360067666
350.02050226244934180.04100452489868360.979497737550658
360.1775266221759920.3550532443519850.822473377824008
370.1858739244410090.3717478488820180.814126075558991
380.1595892181216500.3191784362433010.84041078187835
390.1356631228653820.2713262457307640.864336877134618
400.1073659586275570.2147319172551130.892634041372443
410.07966888073666140.1593377614733230.920331119263339
420.04994172037049340.09988344074098680.950058279629507
430.03920182939234450.0784036587846890.960798170607656
440.03424093803349640.06848187606699270.965759061966504


Meta Analysis of Goldfeld-Quandt test for Heteroskedasticity
Description# significant tests% significant testsOK/NOK
1% type I error level00OK
5% type I error level40.137931034482759NOK
10% type I error level80.275862068965517NOK

\begin{tabular}{lllllllll}
\hline
Meta Analysis of Goldfeld-Quandt test for Heteroskedasticity \tabularnewline
Description & # significant tests & % significant tests & OK/NOK \tabularnewline
1% type I error level & 0 & 0 & OK \tabularnewline
5% type I error level & 4 & 0.137931034482759 & NOK \tabularnewline
10% type I error level & 8 & 0.275862068965517 & NOK \tabularnewline
\hline
\end{tabular}
%Source: https://freestatistics.org/blog/index.php?pk=57942&T=6

[TABLE]
[ROW][C]Meta Analysis of Goldfeld-Quandt test for Heteroskedasticity[/C][/ROW]
[ROW][C]Description[/C][C]# significant tests[/C][C]% significant tests[/C][C]OK/NOK[/C][/ROW]
[ROW][C]1% type I error level[/C][C]0[/C][C]0[/C][C]OK[/C][/ROW]
[ROW][C]5% type I error level[/C][C]4[/C][C]0.137931034482759[/C][C]NOK[/C][/ROW]
[ROW][C]10% type I error level[/C][C]8[/C][C]0.275862068965517[/C][C]NOK[/C][/ROW]
[/TABLE]
Source: https://freestatistics.org/blog/index.php?pk=57942&T=6

Globally Unique Identifier (entire table): ba.freestatistics.org/blog/index.php?pk=57942&T=6

As an alternative you can also use a QR Code:  

The GUIDs for individual cells are displayed in the table below:

Meta Analysis of Goldfeld-Quandt test for Heteroskedasticity
Description# significant tests% significant testsOK/NOK
1% type I error level00OK
5% type I error level40.137931034482759NOK
10% type I error level80.275862068965517NOK


Parameters (Session):
par1 = 2 ; par2 = Do not include Seasonal Dummies ; par3 = No Linear Trend ;
Parameters (R input):
par1 = 2 ; par2 = Include Monthly Dummies ; par3 = No Linear Trend ;
R code (references can be found in the software module):
library(lattice)
library(lmtest)
n25 <- 25 #minimum number of obs. for Goldfeld-Quandt test
par1 <- as.numeric(par1)
x <- t(y)
k <- length(x[1,])
n <- length(x[,1])
x1 <- cbind(x[,par1], x[,1:k!=par1])
mycolnames <- c(colnames(x)[par1], colnames(x)[1:k!=par1])
colnames(x1) <- mycolnames #colnames(x)[par1]
x <- x1
if (par3 == 'First Differences'){
x2 <- array(0, dim=c(n-1,k), dimnames=list(1:(n-1), paste('(1-B)',colnames(x),sep='')))
for (i in 1:n-1) {
for (j in 1:k) {
x2[i,j] <- x[i+1,j] - x[i,j]
}
}
x <- x2
}
if (par2 == 'Include Monthly Dummies'){
x2 <- array(0, dim=c(n,11), dimnames=list(1:n, paste('M', seq(1:11), sep ='')))
for (i in 1:11){
x2[seq(i,n,12),i] <- 1
}
x <- cbind(x, x2)
}
if (par2 == 'Include Quarterly Dummies'){
x2 <- array(0, dim=c(n,3), dimnames=list(1:n, paste('Q', seq(1:3), sep ='')))
for (i in 1:3){
x2[seq(i,n,4),i] <- 1
}
x <- cbind(x, x2)
}
k <- length(x[1,])
if (par3 == 'Linear Trend'){
x <- cbind(x, c(1:n))
colnames(x)[k+1] <- 't'
}
x
k <- length(x[1,])
df <- as.data.frame(x)
(mylm <- lm(df))
(mysum <- summary(mylm))
if (n > n25) {
kp3 <- k + 3
nmkm3 <- n - k - 3
gqarr <- array(NA, dim=c(nmkm3-kp3+1,3))
numgqtests <- 0
numsignificant1 <- 0
numsignificant5 <- 0
numsignificant10 <- 0
for (mypoint in kp3:nmkm3) {
j <- 0
numgqtests <- numgqtests + 1
for (myalt in c('greater', 'two.sided', 'less')) {
j <- j + 1
gqarr[mypoint-kp3+1,j] <- gqtest(mylm, point=mypoint, alternative=myalt)$p.value
}
if (gqarr[mypoint-kp3+1,2] < 0.01) numsignificant1 <- numsignificant1 + 1
if (gqarr[mypoint-kp3+1,2] < 0.05) numsignificant5 <- numsignificant5 + 1
if (gqarr[mypoint-kp3+1,2] < 0.10) numsignificant10 <- numsignificant10 + 1
}
gqarr
}
bitmap(file='test0.png')
plot(x[,1], type='l', main='Actuals and Interpolation', ylab='value of Actuals and Interpolation (dots)', xlab='time or index')
points(x[,1]-mysum$resid)
grid()
dev.off()
bitmap(file='test1.png')
plot(mysum$resid, type='b', pch=19, main='Residuals', ylab='value of Residuals', xlab='time or index')
grid()
dev.off()
bitmap(file='test2.png')
hist(mysum$resid, main='Residual Histogram', xlab='values of Residuals')
grid()
dev.off()
bitmap(file='test3.png')
densityplot(~mysum$resid,col='black',main='Residual Density Plot', xlab='values of Residuals')
dev.off()
bitmap(file='test4.png')
qqnorm(mysum$resid, main='Residual Normal Q-Q Plot')
qqline(mysum$resid)
grid()
dev.off()
(myerror <- as.ts(mysum$resid))
bitmap(file='test5.png')
dum <- cbind(lag(myerror,k=1),myerror)
dum
dum1 <- dum[2:length(myerror),]
dum1
z <- as.data.frame(dum1)
z
plot(z,main=paste('Residual Lag plot, lowess, and regression line'), ylab='values of Residuals', xlab='lagged values of Residuals')
lines(lowess(z))
abline(lm(z))
grid()
dev.off()
bitmap(file='test6.png')
acf(mysum$resid, lag.max=length(mysum$resid)/2, main='Residual Autocorrelation Function')
grid()
dev.off()
bitmap(file='test7.png')
pacf(mysum$resid, lag.max=length(mysum$resid)/2, main='Residual Partial Autocorrelation Function')
grid()
dev.off()
bitmap(file='test8.png')
opar <- par(mfrow = c(2,2), oma = c(0, 0, 1.1, 0))
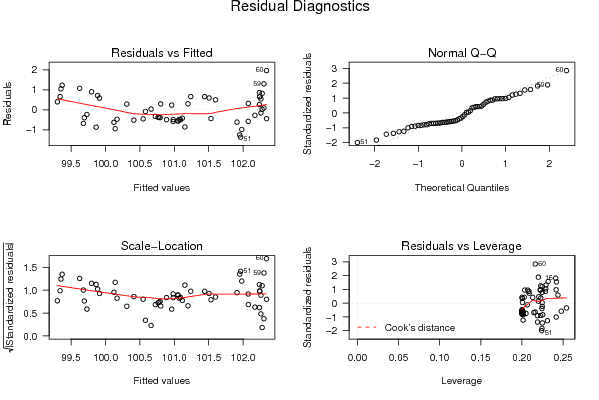
plot(mylm, las = 1, sub='Residual Diagnostics')
par(opar)
dev.off()
if (n > n25) {
bitmap(file='test9.png')
plot(kp3:nmkm3,gqarr[,2], main='Goldfeld-Quandt test',ylab='2-sided p-value',xlab='breakpoint')
grid()
dev.off()
}
load(file='createtable')
a<-table.start()
a<-table.row.start(a)
a<-table.element(a, 'Multiple Linear Regression - Estimated Regression Equation', 1, TRUE)
a<-table.row.end(a)
myeq <- colnames(x)[1]
myeq <- paste(myeq, '[t] = ', sep='')
for (i in 1:k){
if (mysum$coefficients[i,1] > 0) myeq <- paste(myeq, '+', '')
myeq <- paste(myeq, mysum$coefficients[i,1], sep=' ')
if (rownames(mysum$coefficients)[i] != '(Intercept)') {
myeq <- paste(myeq, rownames(mysum$coefficients)[i], sep='')
if (rownames(mysum$coefficients)[i] != 't') myeq <- paste(myeq, '[t]', sep='')
}
}
myeq <- paste(myeq, ' + e[t]')
a<-table.row.start(a)
a<-table.element(a, myeq)
a<-table.row.end(a)
a<-table.end(a)
table.save(a,file='mytable1.tab')
a<-table.start()
a<-table.row.start(a)
a<-table.element(a,hyperlink('ols1.htm','Multiple Linear Regression - Ordinary Least Squares',''), 6, TRUE)
a<-table.row.end(a)
a<-table.row.start(a)
a<-table.element(a,'Variable',header=TRUE)
a<-table.element(a,'Parameter',header=TRUE)
a<-table.element(a,'S.D.',header=TRUE)
a<-table.element(a,'T-STAT
H0: parameter = 0',header=TRUE)
a<-table.element(a,'2-tail p-value',header=TRUE)
a<-table.element(a,'1-tail p-value',header=TRUE)
a<-table.row.end(a)
for (i in 1:k){
a<-table.row.start(a)
a<-table.element(a,rownames(mysum$coefficients)[i],header=TRUE)
a<-table.element(a,mysum$coefficients[i,1])
a<-table.element(a, round(mysum$coefficients[i,2],6))
a<-table.element(a, round(mysum$coefficients[i,3],4))
a<-table.element(a, round(mysum$coefficients[i,4],6))
a<-table.element(a, round(mysum$coefficients[i,4]/2,6))
a<-table.row.end(a)
}
a<-table.end(a)
table.save(a,file='mytable2.tab')
a<-table.start()
a<-table.row.start(a)
a<-table.element(a, 'Multiple Linear Regression - Regression Statistics', 2, TRUE)
a<-table.row.end(a)
a<-table.row.start(a)
a<-table.element(a, 'Multiple R',1,TRUE)
a<-table.element(a, sqrt(mysum$r.squared))
a<-table.row.end(a)
a<-table.row.start(a)
a<-table.element(a, 'R-squared',1,TRUE)
a<-table.element(a, mysum$r.squared)
a<-table.row.end(a)
a<-table.row.start(a)
a<-table.element(a, 'Adjusted R-squared',1,TRUE)
a<-table.element(a, mysum$adj.r.squared)
a<-table.row.end(a)
a<-table.row.start(a)
a<-table.element(a, 'F-TEST (value)',1,TRUE)
a<-table.element(a, mysum$fstatistic[1])
a<-table.row.end(a)
a<-table.row.start(a)
a<-table.element(a, 'F-TEST (DF numerator)',1,TRUE)
a<-table.element(a, mysum$fstatistic[2])
a<-table.row.end(a)
a<-table.row.start(a)
a<-table.element(a, 'F-TEST (DF denominator)',1,TRUE)
a<-table.element(a, mysum$fstatistic[3])
a<-table.row.end(a)
a<-table.row.start(a)
a<-table.element(a, 'p-value',1,TRUE)
a<-table.element(a, 1-pf(mysum$fstatistic[1],mysum$fstatistic[2],mysum$fstatistic[3]))
a<-table.row.end(a)
a<-table.row.start(a)
a<-table.element(a, 'Multiple Linear Regression - Residual Statistics', 2, TRUE)
a<-table.row.end(a)
a<-table.row.start(a)
a<-table.element(a, 'Residual Standard Deviation',1,TRUE)
a<-table.element(a, mysum$sigma)
a<-table.row.end(a)
a<-table.row.start(a)
a<-table.element(a, 'Sum Squared Residuals',1,TRUE)
a<-table.element(a, sum(myerror*myerror))
a<-table.row.end(a)
a<-table.end(a)
table.save(a,file='mytable3.tab')
a<-table.start()
a<-table.row.start(a)
a<-table.element(a, 'Multiple Linear Regression - Actuals, Interpolation, and Residuals', 4, TRUE)
a<-table.row.end(a)
a<-table.row.start(a)
a<-table.element(a, 'Time or Index', 1, TRUE)
a<-table.element(a, 'Actuals', 1, TRUE)
a<-table.element(a, 'Interpolation
Forecast', 1, TRUE)
a<-table.element(a, 'Residuals
Prediction Error', 1, TRUE)
a<-table.row.end(a)
for (i in 1:n) {
a<-table.row.start(a)
a<-table.element(a,i, 1, TRUE)
a<-table.element(a,x[i])
a<-table.element(a,x[i]-mysum$resid[i])
a<-table.element(a,mysum$resid[i])
a<-table.row.end(a)
}
a<-table.end(a)
table.save(a,file='mytable4.tab')
if (n > n25) {
a<-table.start()
a<-table.row.start(a)
a<-table.element(a,'Goldfeld-Quandt test for Heteroskedasticity',4,TRUE)
a<-table.row.end(a)
a<-table.row.start(a)
a<-table.element(a,'p-values',header=TRUE)
a<-table.element(a,'Alternative Hypothesis',3,header=TRUE)
a<-table.row.end(a)
a<-table.row.start(a)
a<-table.element(a,'breakpoint index',header=TRUE)
a<-table.element(a,'greater',header=TRUE)
a<-table.element(a,'2-sided',header=TRUE)
a<-table.element(a,'less',header=TRUE)
a<-table.row.end(a)
for (mypoint in kp3:nmkm3) {
a<-table.row.start(a)
a<-table.element(a,mypoint,header=TRUE)
a<-table.element(a,gqarr[mypoint-kp3+1,1])
a<-table.element(a,gqarr[mypoint-kp3+1,2])
a<-table.element(a,gqarr[mypoint-kp3+1,3])
a<-table.row.end(a)
}
a<-table.end(a)
table.save(a,file='mytable5.tab')
a<-table.start()
a<-table.row.start(a)
a<-table.element(a,'Meta Analysis of Goldfeld-Quandt test for Heteroskedasticity',4,TRUE)
a<-table.row.end(a)
a<-table.row.start(a)
a<-table.element(a,'Description',header=TRUE)
a<-table.element(a,'# significant tests',header=TRUE)
a<-table.element(a,'% significant tests',header=TRUE)
a<-table.element(a,'OK/NOK',header=TRUE)
a<-table.row.end(a)
a<-table.row.start(a)
a<-table.element(a,'1% type I error level',header=TRUE)
a<-table.element(a,numsignificant1)
a<-table.element(a,numsignificant1/numgqtests)
if (numsignificant1/numgqtests < 0.01) dum <- 'OK' else dum <- 'NOK'
a<-table.element(a,dum)
a<-table.row.end(a)
a<-table.row.start(a)
a<-table.element(a,'5% type I error level',header=TRUE)
a<-table.element(a,numsignificant5)
a<-table.element(a,numsignificant5/numgqtests)
if (numsignificant5/numgqtests < 0.05) dum <- 'OK' else dum <- 'NOK'
a<-table.element(a,dum)
a<-table.row.end(a)
a<-table.row.start(a)
a<-table.element(a,'10% type I error level',header=TRUE)
a<-table.element(a,numsignificant10)
a<-table.element(a,numsignificant10/numgqtests)
if (numsignificant10/numgqtests < 0.1) dum <- 'OK' else dum <- 'NOK'
a<-table.element(a,dum)
a<-table.row.end(a)
a<-table.end(a)
table.save(a,file='mytable6.tab')
}