| Multiple Linear Regression - Estimated Regression Equation |
| Y[t] = + 6.16057692307692 + 0.0480769230769208X[t] -0.0563621794871855M1[t] -0.140608974358974M2[t] -0.124855769230769M3[t] + 0.150897435897435M4[t] + 0.517035256410256M5[t] + 0.672788461538462M6[t] + 0.668541666666667M7[t] + 0.544294871794872M8[t] + 0.420048076923077M9[t] + 0.235801282051282M10[t] + 0.134246794871795M11[t] -0.0157532051282050t + e[t] |
| Multiple Linear Regression - Ordinary Least Squares | |||||
| Variable | Parameter | S.D. | T-STAT H0: parameter = 0 | 2-tail p-value | 1-tail p-value |
| (Intercept) | 6.16057692307692 | 0.25502 | 24.1572 | 0 | 0 |
| X | 0.0480769230769208 | 0.210142 | 0.2288 | 0.820098 | 0.410049 |
| M1 | -0.0563621794871855 | 0.291549 | -0.1933 | 0.847598 | 0.423799 |
| M2 | -0.140608974358974 | 0.291203 | -0.4829 | 0.631592 | 0.315796 |
| M3 | -0.124855769230769 | 0.290971 | -0.4291 | 0.669943 | 0.334972 |
| M4 | 0.150897435897435 | 0.290852 | 0.5188 | 0.606492 | 0.303246 |
| M5 | 0.517035256410256 | 0.293025 | 1.7645 | 0.084593 | 0.042297 |
| M6 | 0.672788461538462 | 0.292471 | 2.3004 | 0.026228 | 0.013114 |
| M7 | 0.668541666666667 | 0.29203 | 2.2893 | 0.026918 | 0.013459 |
| M8 | 0.544294871794872 | 0.291702 | 1.8659 | 0.068726 | 0.034363 |
| M9 | 0.420048076923077 | 0.291487 | 1.4411 | 0.15665 | 0.078325 |
| M10 | 0.235801282051282 | 0.291387 | 0.8092 | 0.422732 | 0.211366 |
| M11 | 0.134246794871795 | 0.30655 | 0.4379 | 0.663581 | 0.331791 |
| t | -0.0157532051282050 | 0.00576 | -2.735 | 0.008957 | 0.004478 |
| Multiple Linear Regression - Regression Statistics | |
| Multiple R | 0.695315838819151 |
| R-squared | 0.48346411571278 |
| Adjusted R-squared | 0.330851240809738 |
| F-TEST (value) | 3.16791172448546 |
| F-TEST (DF numerator) | 13 |
| F-TEST (DF denominator) | 44 |
| p-value | 0.0020884763094301 |
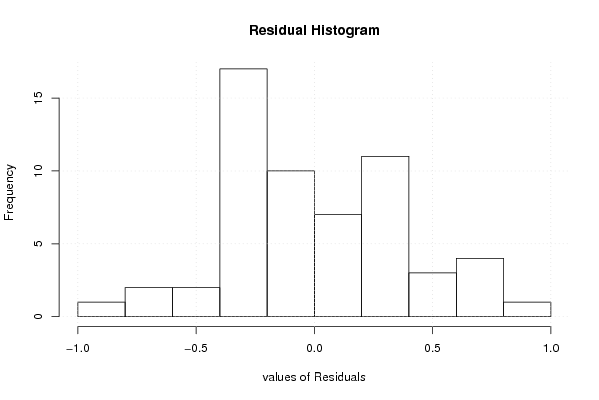
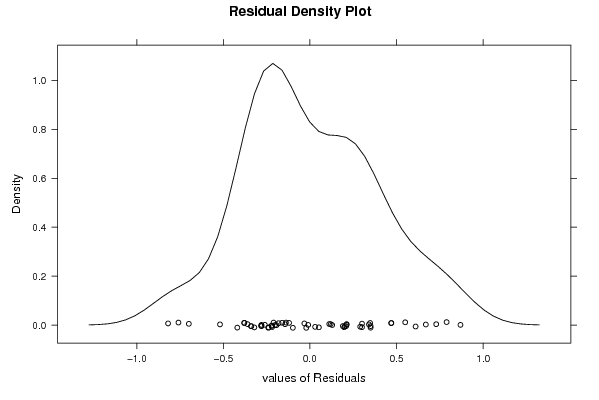
| Multiple Linear Regression - Residual Statistics | |
| Residual Standard Deviation | 0.433451044170282 |
| Sum Squared Residuals | 8.26671153846153 |
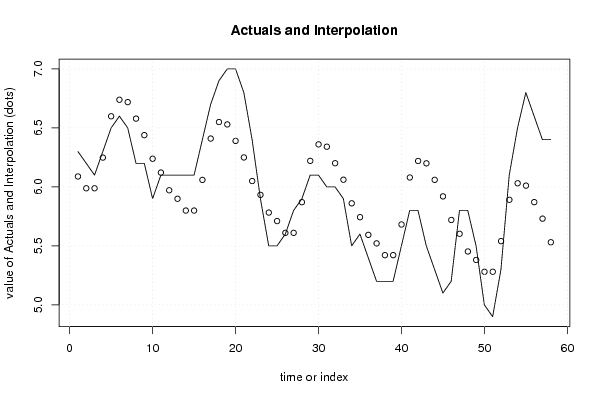
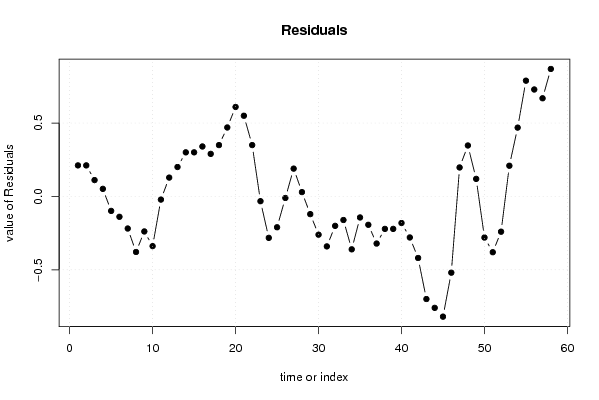
| Multiple Linear Regression - Actuals, Interpolation, and Residuals | |||
| Time or Index | Actuals | Interpolation Forecast | Residuals Prediction Error |
| 1 | 6.3 | 6.08846153846156 | 0.211538461538438 |
| 2 | 6.2 | 5.98846153846154 | 0.211538461538464 |
| 3 | 6.1 | 5.98846153846154 | 0.111538461538463 |
| 4 | 6.3 | 6.24846153846154 | 0.0515384615384633 |
| 5 | 6.5 | 6.59884615384615 | -0.0988461538461528 |
| 6 | 6.6 | 6.73884615384615 | -0.138846153846152 |
| 7 | 6.5 | 6.71884615384615 | -0.218846153846152 |
| 8 | 6.2 | 6.57884615384615 | -0.378846153846153 |
| 9 | 6.2 | 6.43884615384615 | -0.238846153846152 |
| 10 | 5.9 | 6.23884615384615 | -0.338846153846153 |
| 11 | 6.1 | 6.12153846153846 | -0.0215384615384604 |
| 12 | 6.1 | 5.97153846153846 | 0.128461538461539 |
| 13 | 6.1 | 5.89942307692307 | 0.20057692307693 |
| 14 | 6.1 | 5.79942307692308 | 0.300576923076924 |
| 15 | 6.1 | 5.79942307692308 | 0.300576923076924 |
| 16 | 6.4 | 6.05942307692308 | 0.340576923076924 |
| 17 | 6.7 | 6.40980769230769 | 0.290192307692308 |
| 18 | 6.9 | 6.5498076923077 | 0.350192307692308 |
| 19 | 7 | 6.52980769230769 | 0.470192307692308 |
| 20 | 7 | 6.38980769230769 | 0.610192307692308 |
| 21 | 6.8 | 6.24980769230769 | 0.550192307692308 |
| 22 | 6.4 | 6.04980769230769 | 0.350192307692308 |
| 23 | 5.9 | 5.9325 | -0.0324999999999996 |
| 24 | 5.5 | 5.7825 | -0.2825 |
| 25 | 5.5 | 5.71038461538461 | -0.210384615384610 |
| 26 | 5.6 | 5.61038461538462 | -0.0103846153846166 |
| 27 | 5.8 | 5.61038461538462 | 0.189615384615384 |
| 28 | 5.9 | 5.87038461538462 | 0.0296153846153845 |
| 29 | 6.1 | 6.22076923076923 | -0.120769230769232 |
| 30 | 6.1 | 6.36076923076923 | -0.260769230769232 |
| 31 | 6 | 6.34076923076923 | -0.340769230769232 |
| 32 | 6 | 6.20076923076923 | -0.200769230769232 |
| 33 | 5.9 | 6.06076923076923 | -0.160769230769232 |
| 34 | 5.5 | 5.86076923076923 | -0.360769230769232 |
| 35 | 5.6 | 5.74346153846154 | -0.143461538461540 |
| 36 | 5.4 | 5.59346153846154 | -0.193461538461539 |
| 37 | 5.2 | 5.52134615384615 | -0.321346153846149 |
| 38 | 5.2 | 5.42134615384616 | -0.221346153846155 |
| 39 | 5.2 | 5.42134615384616 | -0.221346153846155 |
| 40 | 5.5 | 5.68134615384616 | -0.181346153846156 |
| 41 | 5.8 | 6.07980769230769 | -0.279807692307692 |
| 42 | 5.8 | 6.21980769230769 | -0.419807692307692 |
| 43 | 5.5 | 6.19980769230769 | -0.699807692307692 |
| 44 | 5.3 | 6.05980769230769 | -0.759807692307692 |
| 45 | 5.1 | 5.91980769230769 | -0.819807692307692 |
| 46 | 5.2 | 5.71980769230769 | -0.519807692307692 |
| 47 | 5.8 | 5.6025 | 0.1975 |
| 48 | 5.8 | 5.4525 | 0.3475 |
| 49 | 5.5 | 5.38038461538461 | 0.119615384615391 |
| 50 | 5 | 5.28038461538462 | -0.280384615384616 |
| 51 | 4.9 | 5.28038461538462 | -0.380384615384615 |
| 52 | 5.3 | 5.54038461538462 | -0.240384615384616 |
| 53 | 6.1 | 5.89076923076923 | 0.209230769230768 |
| 54 | 6.5 | 6.03076923076923 | 0.469230769230768 |
| 55 | 6.8 | 6.01076923076923 | 0.789230769230768 |
| 56 | 6.6 | 5.87076923076923 | 0.729230769230768 |
| 57 | 6.4 | 5.73076923076923 | 0.669230769230769 |
| 58 | 6.4 | 5.53076923076923 | 0.869230769230769 |
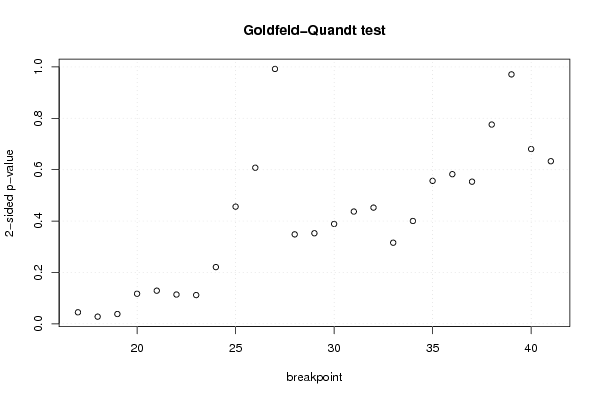
| Goldfeld-Quandt test for Heteroskedasticity | |||
| p-values | Alternative Hypothesis | ||
| breakpoint index | greater | 2-sided | less |
| 17 | 0.0224952761950950 | 0.0449905523901900 | 0.977504723804905 |
| 18 | 0.0140300207335437 | 0.0280600414670874 | 0.985969979266456 |
| 19 | 0.0190867395006751 | 0.0381734790013501 | 0.980913260499325 |
| 20 | 0.0585791549482075 | 0.117158309896415 | 0.941420845051792 |
| 21 | 0.0645541493977776 | 0.129108298795555 | 0.935445850602222 |
| 22 | 0.0570353024545892 | 0.114070604909178 | 0.94296469754541 |
| 23 | 0.0560341758327837 | 0.112068351665567 | 0.943965824167216 |
| 24 | 0.110488550688467 | 0.220977101376935 | 0.889511449311533 |
| 25 | 0.228099436960463 | 0.456198873920927 | 0.771900563039537 |
| 26 | 0.30383062857762 | 0.60766125715524 | 0.69616937142238 |
| 27 | 0.503961085505142 | 0.992077828989716 | 0.496038914494858 |
| 28 | 0.82583436206265 | 0.3483312758747 | 0.17416563793735 |
| 29 | 0.823706092071848 | 0.352587815856303 | 0.176293907928152 |
| 30 | 0.805573371007704 | 0.388853257984592 | 0.194426628992296 |
| 31 | 0.781444260352466 | 0.437111479295068 | 0.218555739647534 |
| 32 | 0.773829703805591 | 0.452340592388817 | 0.226170296194409 |
| 33 | 0.842072070331408 | 0.315855859337184 | 0.157927929668592 |
| 34 | 0.799827432029169 | 0.400345135941663 | 0.200172567970831 |
| 35 | 0.721745012790795 | 0.55650997441841 | 0.278254987209205 |
| 36 | 0.708739895812433 | 0.582520208375134 | 0.291260104187567 |
| 37 | 0.72334883766318 | 0.553302324673642 | 0.276651162336821 |
| 38 | 0.612155512586226 | 0.775688974827548 | 0.387844487413774 |
| 39 | 0.485496432567538 | 0.970992865135076 | 0.514503567432462 |
| 40 | 0.340175135133243 | 0.680350270266486 | 0.659824864866757 |
| 41 | 0.683521976969071 | 0.632956046061858 | 0.316478023030929 |
| Meta Analysis of Goldfeld-Quandt test for Heteroskedasticity | |||
| Description | # significant tests | % significant tests | OK/NOK |
| 1% type I error level | 0 | 0 | OK |
| 5% type I error level | 3 | 0.12 | NOK |
| 10% type I error level | 3 | 0.12 | NOK |