| Multiple Linear Regression - Estimated Regression Equation |
| Tprod[t] = + 9.03287437636819 + 0.0100535761591053Rente[t] + 2.06088898976321y1[t] -1.65997795678992y2[t] + 0.66397755103948y3[t] -0.156268465277844y4[t] + 0.00673278043645512t + e[t] |
| Multiple Linear Regression - Ordinary Least Squares | |||||
| Variable | Parameter | S.D. | T-STAT H0: parameter = 0 | 2-tail p-value | 1-tail p-value |
| (Intercept) | 9.03287437636819 | 4.691774 | 1.9253 | 0.060012 | 0.030006 |
| Rente | 0.0100535761591053 | 0.071091 | 0.1414 | 0.88812 | 0.44406 |
| y1 | 2.06088898976321 | 0.14162 | 14.5523 | 0 | 0 |
| y2 | -1.65997795678992 | 0.316673 | -5.2419 | 3e-06 | 2e-06 |
| y3 | 0.66397755103948 | 0.322999 | 2.0557 | 0.045164 | 0.022582 |
| y4 | -0.156268465277844 | 0.152604 | -1.024 | 0.310858 | 0.155429 |
| t | 0.00673278043645512 | 0.003976 | 1.6935 | 0.096715 | 0.048358 |
| Multiple Linear Regression - Regression Statistics | |
| Multiple R | 0.993522928795038 |
| R-squared | 0.98708781004147 |
| Adjusted R-squared | 0.985506725556751 |
| F-TEST (value) | 624.310604260666 |
| F-TEST (DF numerator) | 6 |
| F-TEST (DF denominator) | 49 |
| p-value | 0 |
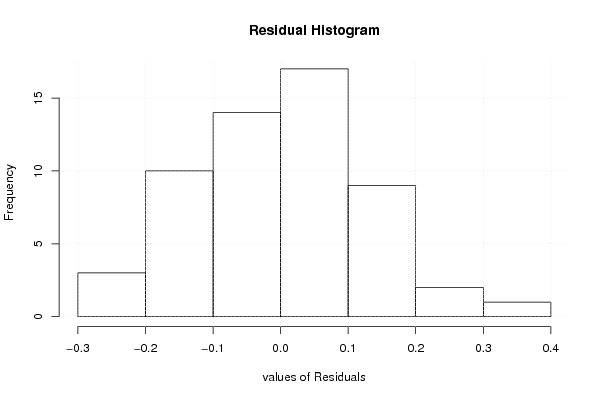
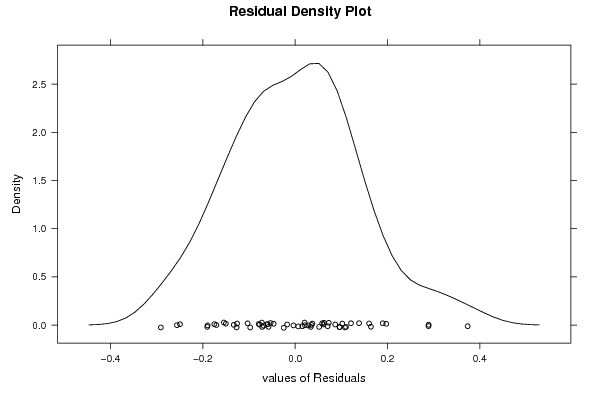
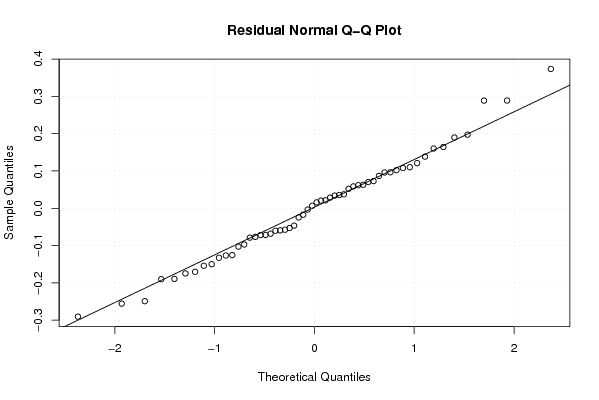
| Multiple Linear Regression - Residual Statistics | |
| Residual Standard Deviation | 0.147201856015383 |
| Sum Squared Residuals | 1.06175093430430 |
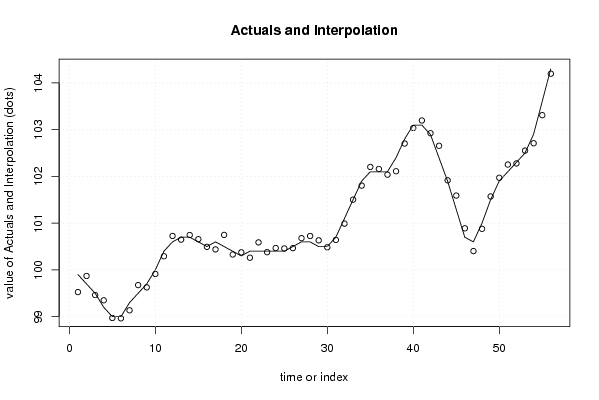
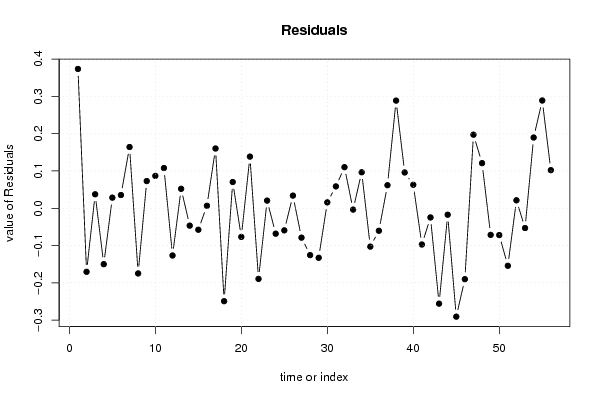
| Multiple Linear Regression - Actuals, Interpolation, and Residuals | |||
| Time or Index | Actuals | Interpolation Forecast | Residuals Prediction Error |
| 1 | 99.9 | 99.5262774179268 | 0.373722582073162 |
| 2 | 99.7 | 99.870474288014 | -0.170474288013908 |
| 3 | 99.5 | 99.4625532180054 | 0.0374467819945941 |
| 4 | 99.2 | 99.350069360806 | -0.150069360806019 |
| 5 | 99 | 98.971502612559 | 0.0284973874410457 |
| 6 | 99 | 98.9645198801592 | 0.0354801198407734 |
| 7 | 99.3 | 99.1358113585054 | 0.164188641494644 |
| 8 | 99.5 | 99.6748958652462 | -0.174895865246220 |
| 9 | 99.7 | 99.627066749654 | 0.0729332503460831 |
| 10 | 100 | 99.9131750019969 | 0.0868249980031247 |
| 11 | 100.4 | 100.292093858629 | 0.107906141371163 |
| 12 | 100.6 | 100.726730665086 | -0.126730665085955 |
| 13 | 100.7 | 100.647880525068 | 0.052119474931733 |
| 14 | 100.7 | 100.746612807863 | -0.0466128078628094 |
| 15 | 100.6 | 100.657635916717 | -0.0576359167170165 |
| 16 | 100.5 | 100.493323324464 | 0.00667667553607671 |
| 17 | 100.6 | 100.439713510042 | 0.160286489957892 |
| 18 | 100.5 | 100.749320228705 | -0.249320228705347 |
| 19 | 100.4 | 100.329576118493 | 0.0704238815069325 |
| 20 | 100.3 | 100.376834896602 | -0.0768348966016582 |
| 21 | 100.4 | 100.261451972109 | 0.138548027890979 |
| 22 | 100.4 | 100.589500538625 | -0.189500538624661 |
| 23 | 100.4 | 100.379464614806 | 0.0205353851940609 |
| 24 | 100.4 | 100.468221996874 | -0.0682219968741338 |
| 25 | 100.4 | 100.459327930783 | -0.0593279307828032 |
| 26 | 100.5 | 100.466060711219 | 0.0339392887807360 |
| 27 | 100.6 | 100.678882390632 | -0.078882390632034 |
| 28 | 100.6 | 100.725706274366 | -0.125706274365815 |
| 29 | 100.5 | 100.632839014227 | -0.132839014227226 |
| 30 | 100.5 | 100.484253804264 | 0.0157461957364671 |
| 31 | 100.7 | 100.641357533851 | 0.0586424661488154 |
| 32 | 101.1 | 100.989848926673 | 0.110151073327290 |
| 33 | 101.5 | 101.503563200568 | -0.00356320056830893 |
| 34 | 101.9 | 101.803455904402 | 0.0965440955980037 |
| 35 | 102.1 | 102.202879710156 | -0.102879710156175 |
| 36 | 102.1 | 102.160380061326 | -0.0603800613259744 |
| 37 | 102.1 | 102.038200884709 | 0.0617991152908789 |
| 38 | 102.4 | 102.111200358779 | 0.288799641221327 |
| 39 | 102.8 | 102.703940785473 | 0.0960592145273543 |
| 40 | 103.1 | 103.037035774777 | 0.0629642252226264 |
| 41 | 103.1 | 103.197237334739 | -0.0972373347386817 |
| 42 | 102.9 | 102.924687208971 | -0.0246872089705846 |
| 43 | 102.4 | 102.655928070655 | -0.255928070655128 |
| 44 | 101.9 | 101.917331407985 | -0.0173314079845912 |
| 45 | 101.3 | 101.590813161727 | -0.290813161726524 |
| 46 | 100.7 | 100.890266444236 | -0.190266444235819 |
| 47 | 100.6 | 100.402598062008 | 0.197401937992481 |
| 48 | 101 | 100.878976419557 | 0.121023580443197 |
| 49 | 101.5 | 101.571437140121 | -0.0714371401205832 |
| 50 | 101.9 | 101.971986556785 | -0.0719865567854098 |
| 51 | 102.1 | 102.254303821676 | -0.154303821675791 |
| 52 | 102.3 | 102.278704606757 | 0.0212953932425151 |
| 53 | 102.5 | 102.553076381565 | -0.0530763815654929 |
| 54 | 102.9 | 102.710279492693 | 0.189720507306649 |
| 55 | 103.6 | 103.310914094829 | 0.289085905170546 |
| 56 | 104.3 | 104.197819802536 | 0.102180197463521 |
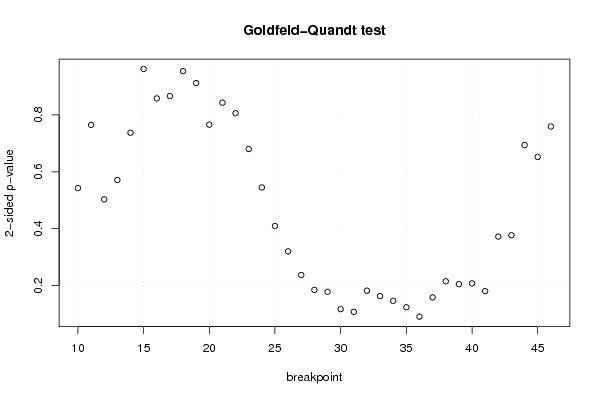
| Goldfeld-Quandt test for Heteroskedasticity | |||
| p-values | Alternative Hypothesis | ||
| breakpoint index | greater | 2-sided | less |
| 10 | 0.271181533643645 | 0.542363067287290 | 0.728818466356355 |
| 11 | 0.617484323797822 | 0.765031352404357 | 0.382515676202178 |
| 12 | 0.748682317858286 | 0.502635364283427 | 0.251317682141714 |
| 13 | 0.714446407998396 | 0.571107184003208 | 0.285553592001604 |
| 14 | 0.63128678058339 | 0.73742643883322 | 0.36871321941661 |
| 15 | 0.518963628551646 | 0.962072742896709 | 0.481036371448354 |
| 16 | 0.429113147700908 | 0.858226295401816 | 0.570886852299092 |
| 17 | 0.433309302455932 | 0.866618604911864 | 0.566690697544068 |
| 18 | 0.52274649930562 | 0.95450700138876 | 0.47725350069438 |
| 19 | 0.456213793848702 | 0.912427587697403 | 0.543786206151298 |
| 20 | 0.382904594504487 | 0.765809189008973 | 0.617095405495513 |
| 21 | 0.421654931882504 | 0.843309863765008 | 0.578345068117496 |
| 22 | 0.403051616033867 | 0.806103232067733 | 0.596948383966133 |
| 23 | 0.340062673122351 | 0.680125346244703 | 0.659937326877649 |
| 24 | 0.272373771339463 | 0.544747542678925 | 0.727626228660537 |
| 25 | 0.204473000046142 | 0.408946000092284 | 0.795526999953858 |
| 26 | 0.159790512233035 | 0.31958102446607 | 0.840209487766965 |
| 27 | 0.118118936985378 | 0.236237873970756 | 0.881881063014622 |
| 28 | 0.0919210414102472 | 0.183842082820494 | 0.908078958589753 |
| 29 | 0.0886529171193103 | 0.177305834238621 | 0.91134708288069 |
| 30 | 0.0580341433475005 | 0.116068286695001 | 0.9419658566525 |
| 31 | 0.0533490258322642 | 0.106698051664528 | 0.946650974167736 |
| 32 | 0.090549438920489 | 0.181098877840978 | 0.909450561079511 |
| 33 | 0.0810178521635331 | 0.162035704327066 | 0.918982147836467 |
| 34 | 0.0727419075884224 | 0.145483815176845 | 0.927258092411578 |
| 35 | 0.0613366679856953 | 0.122673335971391 | 0.938663332014305 |
| 36 | 0.0448228584033816 | 0.089645716806763 | 0.955177141596618 |
| 37 | 0.0787022207466955 | 0.157404441493391 | 0.921297779253305 |
| 38 | 0.107111728595488 | 0.214223457190975 | 0.892888271404512 |
| 39 | 0.101966213059102 | 0.203932426118205 | 0.898033786940898 |
| 40 | 0.103420104704999 | 0.206840209409998 | 0.896579895295001 |
| 41 | 0.0897536164216421 | 0.179507232843284 | 0.910246383578358 |
| 42 | 0.185823457638471 | 0.371646915276942 | 0.814176542361529 |
| 43 | 0.188133462461684 | 0.376266924923368 | 0.811866537538316 |
| 44 | 0.653024817680585 | 0.693950364638830 | 0.346975182319415 |
| 45 | 0.673893861864632 | 0.652212276270736 | 0.326106138135368 |
| 46 | 0.620291329403054 | 0.759417341193892 | 0.379708670596946 |
| Meta Analysis of Goldfeld-Quandt test for Heteroskedasticity | |||
| Description | # significant tests | % significant tests | OK/NOK |
| 1% type I error level | 0 | 0 | OK |
| 5% type I error level | 0 | 0 | OK |
| 10% type I error level | 1 | 0.0270270270270270 | OK |