| Multiple Linear Regression - Estimated Regression Equation |
| X[t] = + 11.6127781126472 -0.0344041663588246Y[t] + e[t] |
| Multiple Linear Regression - Ordinary Least Squares | |||||
| Variable | Parameter | S.D. | T-STAT H0: parameter = 0 | 2-tail p-value | 1-tail p-value |
| (Intercept) | 11.6127781126472 | 0.989812 | 11.7323 | 0 | 0 |
| Y | -0.0344041663588246 | 0.009339 | -3.6838 | 0.000495 | 0.000248 |
| Multiple Linear Regression - Regression Statistics | |
| Multiple R | 0.429486184697689 |
| R-squared | 0.184458382846178 |
| Adjusted R-squared | 0.170866022560281 |
| F-TEST (value) | 13.5707396630418 |
| F-TEST (DF numerator) | 1 |
| F-TEST (DF denominator) | 60 |
| p-value | 0.000495007860921937 |
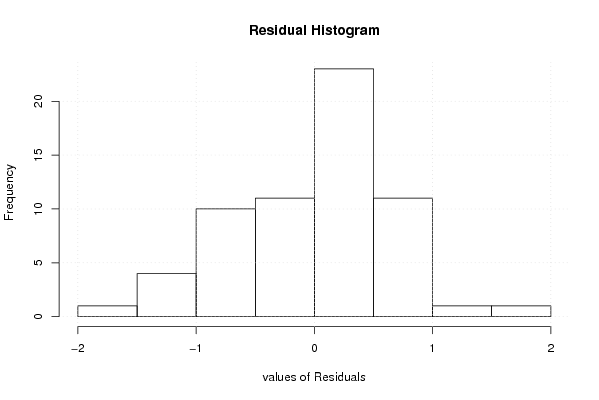
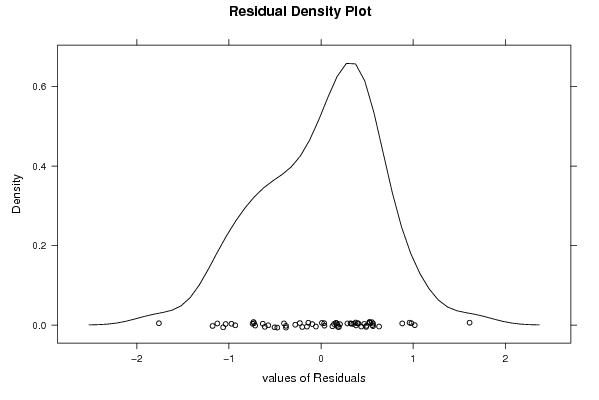
| Multiple Linear Regression - Residual Statistics | |
| Residual Standard Deviation | 0.646636120062257 |
| Sum Squared Residuals | 25.0882963061502 |
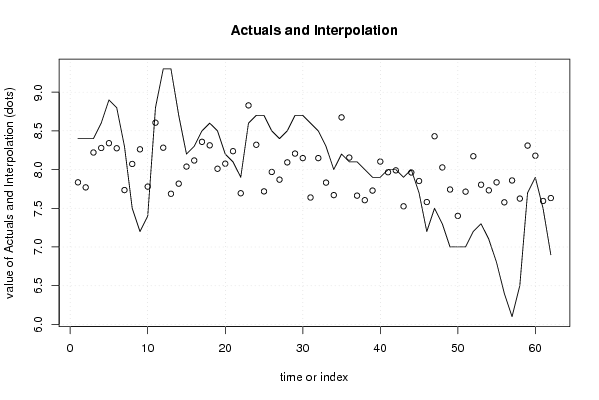
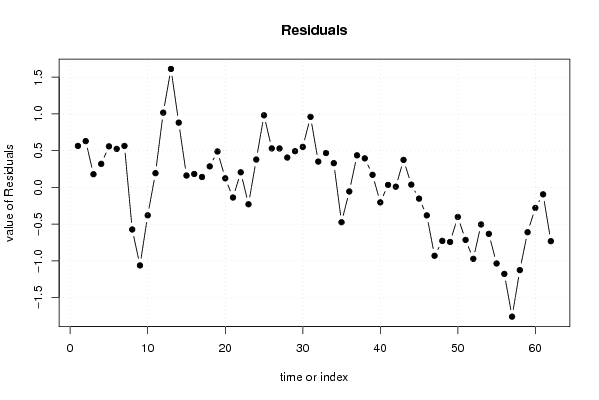
| Multiple Linear Regression - Actuals, Interpolation, and Residuals | |||
| Time or Index | Actuals | Interpolation Forecast | Residuals Prediction Error |
| 1 | 8.4 | 7.8352006464483 | 0.564799353551695 |
| 2 | 8.4 | 7.7698327303665 | 0.630167269633499 |
| 3 | 8.4 | 8.2205273096671 | 0.179472690332897 |
| 4 | 8.6 | 8.27901439247711 | 0.320985607522894 |
| 5 | 8.9 | 8.34094189192299 | 0.55905810807701 |
| 6 | 8.8 | 8.27557397584122 | 0.524426024158778 |
| 7 | 8.3 | 7.73542856400768 | 0.564571435992324 |
| 8 | 7.5 | 8.07258939432416 | -0.572589394324158 |
| 9 | 7.2 | 8.2618123092977 | -1.06181230929769 |
| 10 | 7.4 | 7.78015398027415 | -0.380153980274148 |
| 11 | 8.8 | 8.60585397288594 | 0.194146027114062 |
| 12 | 9.3 | 8.28245480911299 | 1.01754519088701 |
| 13 | 9.3 | 7.68726273110532 | 1.61273726889468 |
| 14 | 8.7 | 7.81799856326886 | 0.882001436731143 |
| 15 | 8.2 | 8.03818522796533 | 0.161814772034666 |
| 16 | 8.3 | 8.11731481059063 | 0.182685189409371 |
| 17 | 8.5 | 8.3581439751024 | 0.141856024897598 |
| 18 | 8.6 | 8.31341855883593 | 0.28658144116407 |
| 19 | 8.5 | 8.01066189487827 | 0.489338105121726 |
| 20 | 8.2 | 8.07602981096004 | 0.123970189039959 |
| 21 | 8.1 | 8.23772939284652 | -0.137729392846517 |
| 22 | 7.9 | 7.69414356437709 | 0.205856435622913 |
| 23 | 8.6 | 8.8294810542183 | -0.229481054218299 |
| 24 | 8.7 | 8.3202993921077 | 0.379700607892304 |
| 25 | 8.7 | 7.71822648082826 | 0.981773519171735 |
| 26 | 8.5 | 7.96937689524768 | 0.530623104752316 |
| 27 | 8.4 | 7.8696048128071 | 0.530395187192907 |
| 28 | 8.5 | 8.09323189413945 | 0.406768105860547 |
| 29 | 8.7 | 8.20676564312357 | 0.493234356876425 |
| 30 | 8.7 | 8.14827856031357 | 0.551721439686427 |
| 31 | 8.6 | 7.63909689820297 | 0.960903101797032 |
| 32 | 8.5 | 8.14827856031357 | 0.351721439686428 |
| 33 | 8.3 | 7.83176022981239 | 0.468239770187615 |
| 34 | 8 | 7.67006064792591 | 0.32993935207409 |
| 35 | 8.2 | 8.67466230560359 | -0.474662305603589 |
| 36 | 8.1 | 8.15515939358534 | -0.0551593935853373 |
| 37 | 8.1 | 7.66317981465415 | 0.436820185345854 |
| 38 | 8 | 7.60469273184414 | 0.395307268155857 |
| 39 | 7.9 | 7.72854773073591 | 0.171452269264089 |
| 40 | 7.9 | 8.1035531440471 | -0.203553144047100 |
| 41 | 8 | 7.9659364786118 | 0.0340635213881983 |
| 42 | 8 | 7.99001939506298 | 0.00998060493702104 |
| 43 | 7.9 | 7.52556314921885 | 0.374436850781153 |
| 44 | 8 | 7.96249606197592 | 0.0375039380240806 |
| 45 | 7.7 | 7.85240272962768 | -0.152402729627680 |
| 46 | 7.2 | 7.58060981539297 | -0.380609815392966 |
| 47 | 7.5 | 8.43039272445593 | -0.930392724455934 |
| 48 | 7.3 | 8.02786397805769 | -0.727863978057686 |
| 49 | 7 | 7.74230939727944 | -0.742309397279442 |
| 50 | 7 | 7.40170815032708 | -0.401708150327078 |
| 51 | 7 | 7.71478606419238 | -0.714786064192382 |
| 52 | 7.2 | 8.17236147676475 | -0.97236147676475 |
| 53 | 7.3 | 7.80423689672533 | -0.504236896725326 |
| 54 | 7.1 | 7.7319881473718 | -0.631988147371795 |
| 55 | 6.8 | 7.83520064644827 | -1.03520064644827 |
| 56 | 6.4 | 7.57716939875708 | -1.17716939875708 |
| 57 | 6.1 | 7.85928356289945 | -1.75928356289945 |
| 58 | 6.5 | 7.62533523165944 | -1.12533523165944 |
| 59 | 7.7 | 8.30997814220005 | -0.609978142200047 |
| 60 | 7.9 | 8.17924231003651 | -0.279242310036514 |
| 61 | 7.5 | 7.5943714819365 | -0.094371481936496 |
| 62 | 6.9 | 7.6322160649312 | -0.732216064931203 |
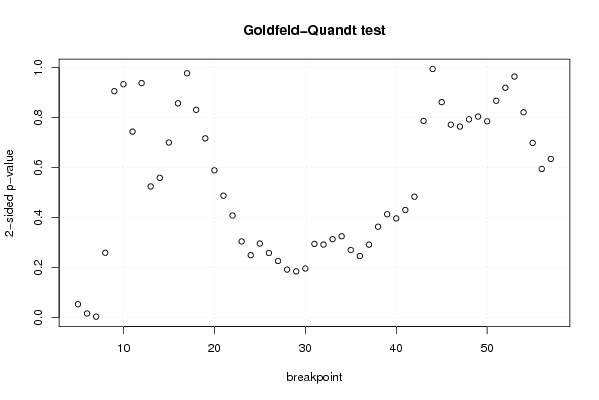
| Goldfeld-Quandt test for Heteroskedasticity | |||
| p-values | Alternative Hypothesis | ||
| breakpoint index | greater | 2-sided | less |
| 5 | 0.0266674269188702 | 0.0533348538377403 | 0.97333257308113 |
| 6 | 0.00819380938049885 | 0.0163876187609977 | 0.991806190619501 |
| 7 | 0.00184394609786804 | 0.00368789219573608 | 0.998156053902132 |
| 8 | 0.129547010747023 | 0.259094021494046 | 0.870452989252977 |
| 9 | 0.452580082674904 | 0.905160165349808 | 0.547419917325096 |
| 10 | 0.466540854778919 | 0.933081709557838 | 0.533459145221081 |
| 11 | 0.371711726594823 | 0.743423453189646 | 0.628288273405177 |
| 12 | 0.468757925207109 | 0.937515850414217 | 0.531242074792891 |
| 13 | 0.737870346634635 | 0.52425930673073 | 0.262129653365365 |
| 14 | 0.72063386923326 | 0.558732261533481 | 0.279366130766740 |
| 15 | 0.650034117893633 | 0.699931764212734 | 0.349965882106367 |
| 16 | 0.571689327545459 | 0.856621344909083 | 0.428310672454541 |
| 17 | 0.488406809914952 | 0.976813619829904 | 0.511593190085048 |
| 18 | 0.415317822119307 | 0.830635644238615 | 0.584682177880693 |
| 19 | 0.3582888556941 | 0.7165777113882 | 0.6417111443059 |
| 20 | 0.294435999593108 | 0.588871999186216 | 0.705564000406892 |
| 21 | 0.243629361212151 | 0.487258722424302 | 0.75637063878785 |
| 22 | 0.204106689821956 | 0.408213379643912 | 0.795893310178044 |
| 23 | 0.152151700653680 | 0.304303401307361 | 0.84784829934632 |
| 24 | 0.124729725179130 | 0.249459450358261 | 0.87527027482087 |
| 25 | 0.147938047231586 | 0.295876094463172 | 0.852061952768414 |
| 26 | 0.129124392440786 | 0.258248784881572 | 0.870875607559214 |
| 27 | 0.113112913591421 | 0.226225827182841 | 0.88688708640858 |
| 28 | 0.0958560675925447 | 0.191712135185089 | 0.904143932407455 |
| 29 | 0.0923245216989698 | 0.184649043397940 | 0.90767547830103 |
| 30 | 0.0981102247662521 | 0.196220449532504 | 0.901889775233748 |
| 31 | 0.147324250089703 | 0.294648500179406 | 0.852675749910297 |
| 32 | 0.145984281557092 | 0.291968563114185 | 0.854015718442908 |
| 33 | 0.156747644889252 | 0.313495289778503 | 0.843252355110748 |
| 34 | 0.162536687134698 | 0.325073374269396 | 0.837463312865302 |
| 35 | 0.135113671429518 | 0.270227342859035 | 0.864886328570482 |
| 36 | 0.123006859258857 | 0.246013718517714 | 0.876993140741143 |
| 37 | 0.145765575038755 | 0.291531150077510 | 0.854234424961245 |
| 38 | 0.181631604685817 | 0.363263209371635 | 0.818368395314183 |
| 39 | 0.206540080323850 | 0.413080160647701 | 0.79345991967615 |
| 40 | 0.198274926624589 | 0.396549853249178 | 0.801725073375411 |
| 41 | 0.215007484312093 | 0.430014968624186 | 0.784992515687907 |
| 42 | 0.241581913650343 | 0.483163827300686 | 0.758418086349657 |
| 43 | 0.393252515058979 | 0.786505030117959 | 0.606747484941021 |
| 44 | 0.497022416868219 | 0.994044833736437 | 0.502977583131781 |
| 45 | 0.569322453866494 | 0.861355092267012 | 0.430677546133506 |
| 46 | 0.614375778761916 | 0.771248442476169 | 0.385624221238085 |
| 47 | 0.618113246425053 | 0.763773507149894 | 0.381886753574947 |
| 48 | 0.603662390397156 | 0.792675219205689 | 0.396337609602844 |
| 49 | 0.598157291053562 | 0.803685417892877 | 0.401842708946438 |
| 50 | 0.607585267539702 | 0.784829464920595 | 0.392414732460298 |
| 51 | 0.566601982761219 | 0.866796034477562 | 0.433398017238781 |
| 52 | 0.540611775988873 | 0.918776448022253 | 0.459388224011127 |
| 53 | 0.481803826231858 | 0.963607652463716 | 0.518196173768142 |
| 54 | 0.410349340203453 | 0.820698680406906 | 0.589650659796547 |
| 55 | 0.349135124551108 | 0.698270249102215 | 0.650864875448892 |
| 56 | 0.297185546121702 | 0.594371092243404 | 0.702814453878298 |
| 57 | 0.68289976419962 | 0.634200471600759 | 0.317100235800380 |
| Meta Analysis of Goldfeld-Quandt test for Heteroskedasticity | |||
| Description | # significant tests | % significant tests | OK/NOK |
| 1% type I error level | 1 | 0.0188679245283019 | NOK |
| 5% type I error level | 2 | 0.0377358490566038 | OK |
| 10% type I error level | 3 | 0.0566037735849057 | OK |