| Multiple Linear Regression - Estimated Regression Equation |
| Y[t] = -3.40051685044881 -0.134543923383781X[t] + 2.11094925623521`Y(t-1)`[t] -0.9087922772981`Y(t-2)`[t] + 0.928796384659762`Y(t-3)`[t] -0.536884959196374`Y(t-4)`[t] -1.77521792588231M1[t] -0.303259869607554M2[t] -0.398487322461913M3[t] -0.233131366754861M4[t] + 0.279722394838491M5[t] + 1.73437634941900M6[t] + 0.305099087362743M7[t] + 0.182267571428939M8[t] -0.752535129732793M9[t] -0.324731479878309M10[t] + 0.384426209322359M11[t] + 0.0369476158030248t + e[t] |
| Multiple Linear Regression - Ordinary Least Squares | |||||
| Variable | Parameter | S.D. | T-STAT H0: parameter = 0 | 2-tail p-value | 1-tail p-value |
| (Intercept) | -3.40051685044881 | 5.922119 | -0.5742 | 0.569212 | 0.284606 |
| X | -0.134543923383781 | 0.15339 | -0.8771 | 0.385925 | 0.192963 |
| `Y(t-1)` | 2.11094925623521 | 1.279515 | 1.6498 | 0.107226 | 0.053613 |
| `Y(t-2)` | -0.9087922772981 | 1.814831 | -0.5008 | 0.619429 | 0.309715 |
| `Y(t-3)` | 0.928796384659762 | 1.802582 | 0.5153 | 0.609357 | 0.304678 |
| `Y(t-4)` | -0.536884959196374 | 1.007742 | -0.5328 | 0.597301 | 0.298651 |
| M1 | -1.77521792588231 | 0.933856 | -1.901 | 0.064912 | 0.032456 |
| M2 | -0.303259869607554 | 0.981059 | -0.3091 | 0.758923 | 0.379461 |
| M3 | -0.398487322461913 | 0.993127 | -0.4012 | 0.690487 | 0.345244 |
| M4 | -0.233131366754861 | 0.974736 | -0.2392 | 0.812256 | 0.406128 |
| M5 | 0.279722394838491 | 1.009996 | 0.277 | 0.783317 | 0.391658 |
| M6 | 1.73437634941900 | 1.506449 | 1.1513 | 0.256801 | 0.128401 |
| M7 | 0.305099087362743 | 1.122502 | 0.2718 | 0.787245 | 0.393623 |
| M8 | 0.182267571428939 | 1.436923 | 0.1268 | 0.899731 | 0.449866 |
| M9 | -0.752535129732793 | 1.304439 | -0.5769 | 0.567407 | 0.283703 |
| M10 | -0.324731479878309 | 1.049079 | -0.3095 | 0.758602 | 0.379301 |
| M11 | 0.384426209322359 | 1.002269 | 0.3836 | 0.703445 | 0.351723 |
| t | 0.0369476158030248 | 0.033765 | 1.0943 | 0.280731 | 0.140366 |
| Multiple Linear Regression - Regression Statistics | |
| Multiple R | 0.6652577704075 |
| R-squared | 0.442567901087558 |
| Adjusted R-squared | 0.193190383153044 |
| F-TEST (value) | 1.77469045627351 |
| F-TEST (DF numerator) | 17 |
| F-TEST (DF denominator) | 38 |
| p-value | 0.0704654438906093 |
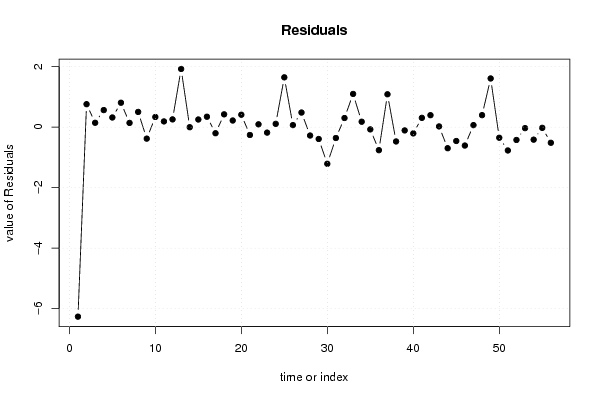
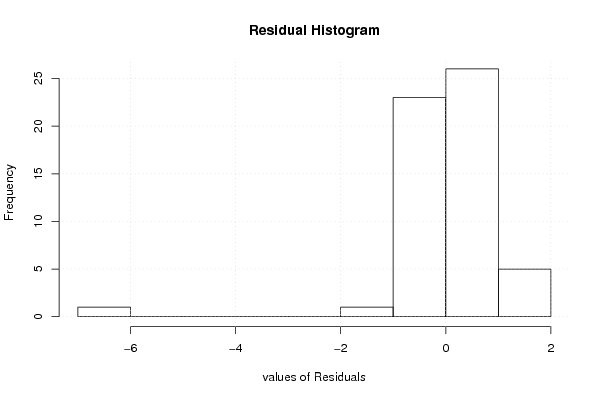
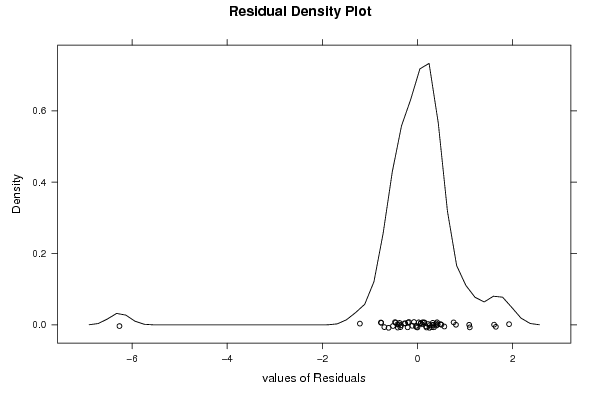
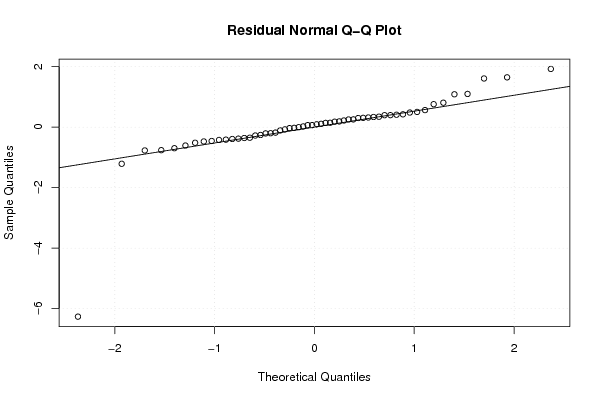
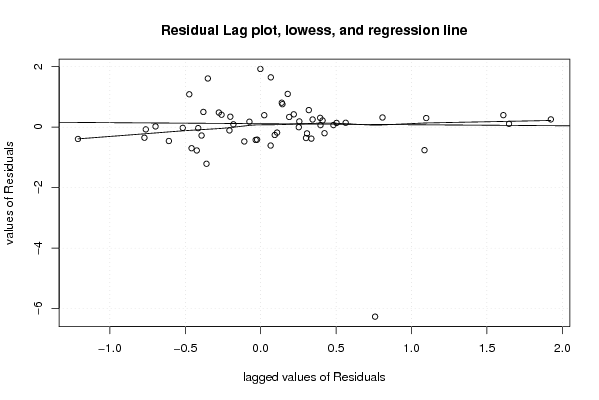
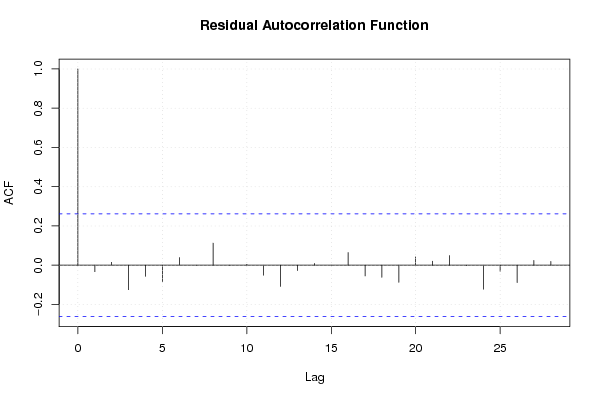
| Multiple Linear Regression - Residual Statistics | |
| Residual Standard Deviation | 1.25163224664294 |
| Sum Squared Residuals | 59.5301646717848 |
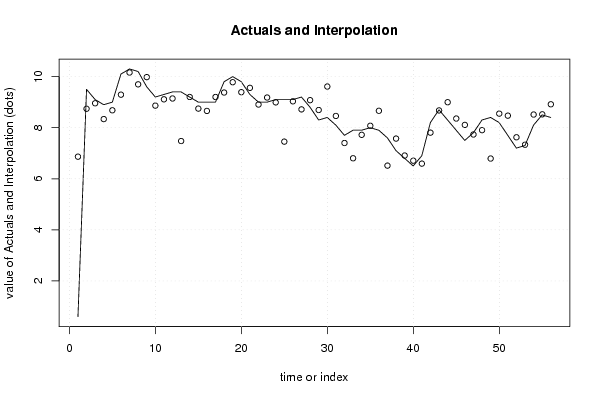
| Multiple Linear Regression - Actuals, Interpolation, and Residuals | |||
| Time or Index | Actuals | Interpolation Forecast | Residuals Prediction Error |
| 1 | 0.6 | 6.86463340139552 | -6.26463340139552 |
| 2 | 9.5 | 8.7415042832644 | 0.758495716735606 |
| 3 | 9.1 | 8.95588583970197 | 0.144114160298025 |
| 4 | 8.9 | 8.33650308715484 | 0.563496912845157 |
| 5 | 9 | 8.6810633898378 | 0.318936610162192 |
| 6 | 10.1 | 9.29242642733536 | 0.807573572664635 |
| 7 | 10.3 | 10.1602564419576 | 0.139743558042351 |
| 8 | 10.2 | 9.69714751835125 | 0.502852481648744 |
| 9 | 9.6 | 9.97987423434252 | -0.37987423434252 |
| 10 | 9.2 | 8.86412099580466 | 0.335879004195342 |
| 11 | 9.3 | 9.11086533438787 | 0.189134665612129 |
| 12 | 9.4 | 9.14386026631778 | 0.256139733682221 |
| 13 | 9.4 | 7.47641807578612 | 1.92358192421388 |
| 14 | 9.2 | 9.20207814227862 | -0.00207814227862302 |
| 15 | 9 | 8.7473452041882 | 0.252654795811797 |
| 16 | 9 | 8.65552888399122 | 0.344471116008777 |
| 17 | 9 | 9.20132943991526 | -0.201329439915265 |
| 18 | 9.8 | 9.37674463007534 | 0.423255369924664 |
| 19 | 10 | 9.78055138064955 | 0.219448619350453 |
| 20 | 9.8 | 9.38982350992733 | 0.410176490072674 |
| 21 | 9.3 | 9.55941029693786 | -0.25941029693786 |
| 22 | 9 | 8.90669669951224 | 0.0933033004877626 |
| 23 | 9 | 9.18077709752319 | -0.180777097523188 |
| 24 | 9.1 | 8.99109404879349 | 0.108905951206515 |
| 25 | 9.1 | 7.45372222853798 | 1.64627777146202 |
| 26 | 9.1 | 9.03281416064486 | 0.0671858393551382 |
| 27 | 9.2 | 8.71759976126167 | 0.482400238738328 |
| 28 | 8.8 | 9.07730976247563 | -0.277309762475630 |
| 29 | 8.3 | 8.69185220964812 | -0.391852209648117 |
| 30 | 8.4 | 9.61128448597602 | -1.21128448597602 |
| 31 | 8.1 | 8.45923885421182 | -0.359238854211815 |
| 32 | 7.7 | 7.39954674082933 | 0.300453259170672 |
| 33 | 7.9 | 6.8025386630885 | 1.0974613369115 |
| 34 | 7.9 | 7.72066927959473 | 0.179330720405275 |
| 35 | 8 | 8.0745630630338 | -0.0745630630338049 |
| 36 | 7.9 | 8.66159807186957 | -0.76159807186957 |
| 37 | 7.6 | 6.51397661659768 | 1.08602338340232 |
| 38 | 7.1 | 7.57335637800068 | -0.473356378000682 |
| 39 | 6.8 | 6.90857687775663 | -0.108576877756635 |
| 40 | 6.5 | 6.7070413915669 | -0.207041391566907 |
| 41 | 6.9 | 6.59286297071118 | 0.307137029288818 |
| 42 | 8.2 | 7.80548308012554 | 0.394516919874456 |
| 43 | 8.7 | 8.67629712841982 | 0.0237028715801756 |
| 44 | 8.3 | 8.99704193754194 | -0.697041937541937 |
| 45 | 7.9 | 8.35817680563112 | -0.458176805631121 |
| 46 | 7.5 | 8.10851302508838 | -0.60851302508838 |
| 47 | 7.8 | 7.73379450505514 | 0.0662054949448635 |
| 48 | 8.3 | 7.90344761301917 | 0.396552386980827 |
| 49 | 8.4 | 6.79124967768271 | 1.60875032231729 |
| 50 | 8.2 | 8.55024703581144 | -0.35024703581144 |
| 51 | 7.7 | 8.47059231709152 | -0.770592317091515 |
| 52 | 7.2 | 7.6236168748114 | -0.423616874811398 |
| 53 | 7.3 | 7.33289198988763 | -0.0328919898876289 |
| 54 | 8.1 | 8.51406137648774 | -0.414061376487735 |
| 55 | 8.5 | 8.52365619476116 | -0.0236561947611641 |
| 56 | 8.4 | 8.91644029335015 | -0.516440293350152 |
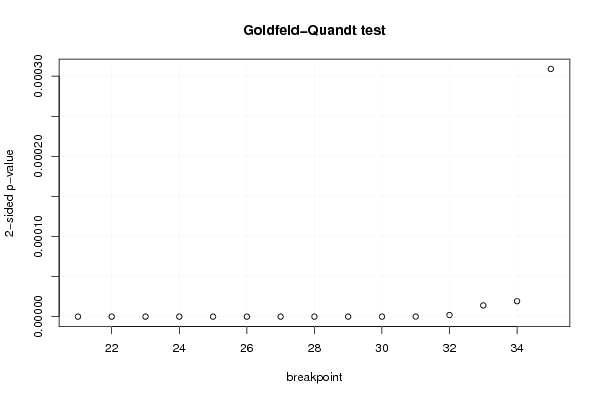
| Goldfeld-Quandt test for Heteroskedasticity | |||
| p-values | Alternative Hypothesis | ||
| breakpoint index | greater | 2-sided | less |
| 21 | 0.999999999422232 | 1.15553604809741e-09 | 5.77768024048704e-10 |
| 22 | 0.999999999981861 | 3.62780054313983e-11 | 1.81390027156991e-11 |
| 23 | 0.9999999998869 | 2.26200309557485e-10 | 1.13100154778743e-10 |
| 24 | 0.99999999955124 | 8.97521821857054e-10 | 4.48760910928527e-10 |
| 25 | 0.999999997287287 | 5.42542516826538e-09 | 2.71271258413269e-09 |
| 26 | 0.999999996777257 | 6.44548500741335e-09 | 3.22274250370667e-09 |
| 27 | 0.999999999123011 | 1.75397767101586e-09 | 8.76988835507932e-10 |
| 28 | 0.99999999772735 | 4.54530199453031e-09 | 2.27265099726515e-09 |
| 29 | 0.99999997801668 | 4.39666388834681e-08 | 2.19833194417340e-08 |
| 30 | 0.999999994602313 | 1.07953731860369e-08 | 5.39768659301845e-09 |
| 31 | 0.999999937790685 | 1.24418630365924e-07 | 6.22093151829618e-08 |
| 32 | 0.999999004610797 | 1.99077840599051e-06 | 9.95389202995255e-07 |
| 33 | 0.99999299955111 | 1.40008977822431e-05 | 7.00044889112154e-06 |
| 34 | 0.999990351226243 | 1.92975475137934e-05 | 9.6487737568967e-06 |
| 35 | 0.999845458551998 | 0.000309082896003076 | 0.000154541448001538 |
| Meta Analysis of Goldfeld-Quandt test for Heteroskedasticity | |||
| Description | # significant tests | % significant tests | OK/NOK |
| 1% type I error level | 15 | 1 | NOK |
| 5% type I error level | 15 | 1 | NOK |
| 10% type I error level | 15 | 1 | NOK |